

Fundamental Analysis of Talbros Automotive: India has one of the world’s fastest-growing economies. This rapid growth, combined with rising incomes, greater infrastructure spending, and increased manufacturing incentives, has boosted the vehicle sector, resulting in the expansion of the auto component business.

Some successful investors, such as Vijay Kedia and Dolly Khanna, have chosen to keep their investment in a particular stock in this industry. This stock has shown a significant return of 151% in the last six months. The stock in question is Talbros Automotive Components.
In this article, we will conduct a fundamental analysis of Talbros Automotive Components and see if the stock has the potential to increase in the future.

Fundamental Analysis of Talbros Automotive
We’ll begin our Fundamental Analysis of Talbros Automotive Components by becoming acquainted with the company’s operations, products and the overview of the industry. Following that, we’ll go into the stock’s financials. The article concludes with a highlight of future plans and a summary.
Company Overview
Talbros automobile Components Ltd., founded in 1956, is an Indian multinational automobile component company headquartered in Faridabad, Haryana.

With over six decades of experience in auto component production, the company serves a variety of automobile categories, including two-wheelers, passenger vehicles, commercial vehicles, off-highway vehicles, and farm equipment. In recent years, the company has also ventured into supplying components for EV vehicles.
The joint venture of the company includes: Nippon Leakless Corporation (NLK), Marelli Talbros Chassis Systems Pvt Ltd (MTC) and Talbros Marugo Rubber Pvt. Ltd. (TMR).

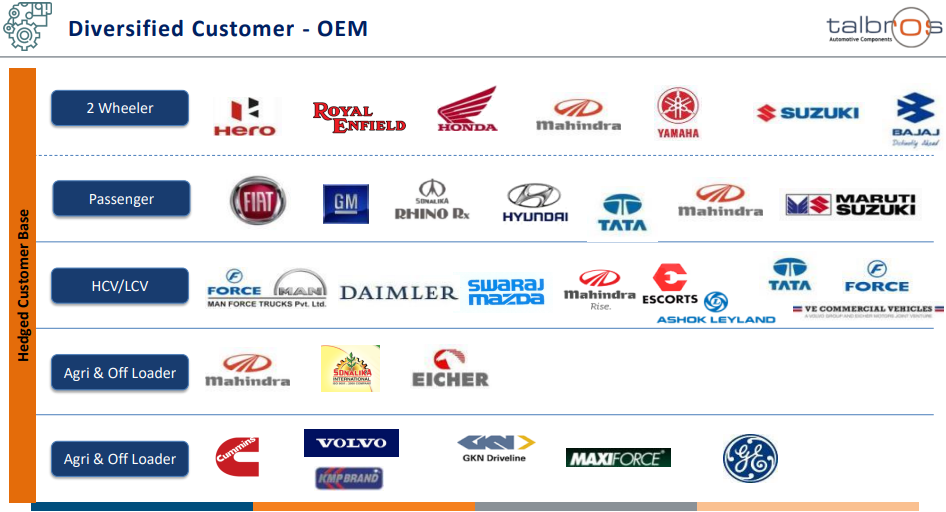
The company along with its joint venture has established a diverse customer base. The following image depicts the customer base of Talbros Automotive across different OEM segments:

Revenue Segment
The Company, along with its joint venture companies, offers a diverse product portfolio that includes Gaskets, Heat Shields, Forgings, Chassis Systems, Suspension Systems, Anti-vibration Components, and Hoses.
The following image shows you the revenue the company derives from each of its segments:

Industry Overview
Given the increased demand in the vehicle industry, more original equipment and auto component manufacturers have emerged. The auto component industry in India is a major driver of macroeconomic growth and employment, accounting for 2.3% of the country’s GDP.
When compared to the first half of 2021, the automotive component industry’s revenue increased 34.8% to ₹2.65 lakh crore during April-September 2022. Furthermore, auto component exports rose 8.6% in H123 to ₹79,033 crore, up from ₹68,746 crore in H1 2021-22.
According to the Automobile Component Manufacturers Association (ACMA), India’s auto component exports are estimated to reach US$ 30 billion by 2026. By 2026, the auto component sector is expected to generate $200 billion in revenue.
Talbros Automotive – Financials
We will now conduct a Fundamental Analysis of Talbros Automotive Components by using the reports given by the company
Revenue and Net Profit Growth
The profit and loss account of the company shows an increase in revenues which might have been driven by an increase in sales of the automobile industry.
During FY23, the company reported an increased revenue of ₹ 647.2 Crores from a revenue of ₹ 482.85 Crores reported in FY19.
During this timeframe, the CAGR growth of the company stands at 7.60% which can be considered low for the company
The table below shows the total revenues of Talbros Automotive Components for 5 financial years:
| Financial Year | Revenue ( in Crores) |
|---|---|
| 2019 | ₹ 482.85 |
| 2020 | ₹ 385.29 |
| 2021 | ₹ 444.2 |
| 2022 | ₹ 577.24 |
| 2023 | ₹ 647.2 |
| CAGR growth | 7.60% |
The profits of the company have also followed a similar trend reporting a net profit of ₹ 55.6 Crores in FY23 which is an increase from a net profit of ₹ 16.88 Crores reported in FY19. Unline the revenues, the net profits of the company have given a CAGR growth of 34.72% during the period.
The table below shows the net profit of Talbros Automotive Components for 5 financial years:
| Financial Year | Net Profit (in Crores) |
|---|---|
| 2019 | ₹ 16.88 |
| 2020 | ₹ 4.32 |
| 2021 | ₹ 39.13 |
| 2022 | ₹ 44.89 |
| 2023 | ₹ 55.6 |
| CAGR growth | 34.72% |
Let us analyse the margin front of the company and try to understand how the company was able to increase its revenues at a faster pace than its profits.
Margin Analysis
While the operating profit margins of the company had a marginal increase, there was a significant increase in the net profit margins over the last five years.
This indicates that the company had huge non-operating expenses which have been reduced over the last 5 years. Even though the company’s net profit margins have increased, they are still relatively low.
The table below shows the operating profit margins and net profit margins of Talbros Automotive Components for 5 financial years:
| Financial Year | Operating Profit Margin | Net Profit Margin |
|---|---|---|
| 2019 | 10.36% | 3.5 % |
| 2020 | 9.48% | 1.12 % |
| 2021 | 12.53% | 8.81 % |
| 2022 | 12.60% | 7.78 % |
| 2023 | 13.8 % | 8.50% |
Return Ratios: RoCE and RoE
Though the margins of the company were relatively low, the return ratios indicate a slightly positive outlook on the performance of the company.
The RoE and RoCE were reported at 16.5% and 26.6% respectively. Despite the low margins, these returns can be considered good for the company.
A high Return on Equity (RoE) suggests that the company has yielded significant profits on the capital invested by its shareholders. Similarly, a high Return on Capital Employed (RoCE) implies that the company is utilizing its resources efficiently.
The table below shows the ROE and ROCE of Talbros Automotive Components for 5 financial years:
| Financial Year | ROE (%) | ROCE (%) |
|---|---|---|
| 2019 | 8.92 % | 12.21 % |
| 2020 | 2.18 % | 6.17 % |
| 2021 | 17.57 % | 18.61 % |
| 2022 | 16.34 % | 18.38 % |
| 2023 | 16.50% | 16.60% |
Debt-to-equity ratio
The debt-to-equity ratio of the company indicates that the company has consistently decreased its borrowings year-on-year and has reported a debt-to-equity ratio of 0.24.
This means that the company has decreased its borrowing significantly and will have decreased the burden of repaying the interest and principal amount. This also means that the company will also be able to retain more profits.
The table below shows the Debt-to-equity ratio of Talbros Automotive Components for 5 financial years:
| Financial Year | Debt-to-equity |
|---|---|
| 2019 | 0.78 |
| 2020 | 0.78 |
| 2021 | 0.42 |
| 2022 | 0.29 |
| 2023 | 0.24 |
Future Plans of Talbros Automotive
So far we looked at previous fiscals’ data for our fundamental analysis of Talbros Automotive Components. Let us now see what plans the company has in store for the future.
- The company plans to allocate a CAPEX of ₹205 crores over the next 3-4 years in expanding capacities across its businesses.
- The company has received orders worth more than ₹1000 crores which are to be executed in the next 5 years
- It plans to double its revenues by FY27 and become a Rs. 2,200 crore company at a group level.
- It plans to increase its exports and derive 35% of the revenues through it. This will help the company to increase its margins by 15-16%.
Key Metrics
We are almost at the end of our Fundamental Analysis Of Talbros Automotive. Let’s take a quick glance at the stock’s important metrics.
| Particulars | Figures | Particulars | Figures |
|---|---|---|---|
| CMP | ₹1,053 | Market Cap (Cr.) | ₹ 1,291.66 |
| EPS | 49.49 | Stock P/E | 21.96 |
| RoCE (%) | 16.60% | RoE(%) | 16.50% |
| Promoters Holding | 58.42% | Price to Book Value | 3.42 |
| Net Profit Margin(%) | 8.50% | Operating Profit Margin(%) | 12.6 |
In Closing
We have reached the end out the fundamental analysis of Talbros Automotive Components. Through this article, we can conclude that with various factors like the company’s diversified product segments, its diverse customer base, its various joint ventures and the plans it has set forth for the future which include increasing exports that’ll help increase its margins, the stock has a good potential for growth in the future.
However, it is our responsibility as investors to monitor the company’s earnings to see if it is improving or maintaining its margins, as well as whether the company’s performance is better than that of its industry peers.
Written By Aaron Vas
By utilizing the stock screener, stock heatmap, portfolio backtesting, and stock compare tool on the Trade Brains portal, investors gain access to comprehensive tools that enable them to identify the best stocks also get updated with stock market news, and make well-informed investment decisions.


