

Synopsis: Gabriel India Ltd. has developed a rounding bottom pattern on its 1-week chart, indicating potential near-term bullish momentum.
This pattern suggests that bearish momentum is gradually fading while buying strength is steadily building, indicating a potential bullish trend. A rounding bottom pattern forms a smooth “U”-shaped curve, indicating a gradual shift from selling pressure to strengthening buying momentum over time.

Gabriel India Ltd. confirmed a bullish breakout from a rounding bottom pattern neckline on 15th July 2026. After the breakout, the stock retested the key support zone multiple times near Rs 1,322 and successfully sustained itself above it, signaling strong buying interest. The stock later closed at Rs 1,488.5 on Tuesday. Continued buying volume could support further upside momentum, while a move below the support zone may weaken the bullish outlook.
In a rounding bottom pattern, traders generally set targets near the next resistance levels or by projecting the depth of the pattern from the breakout point upwards while monitoring volume and momentum for confirmation of the bullish trend.

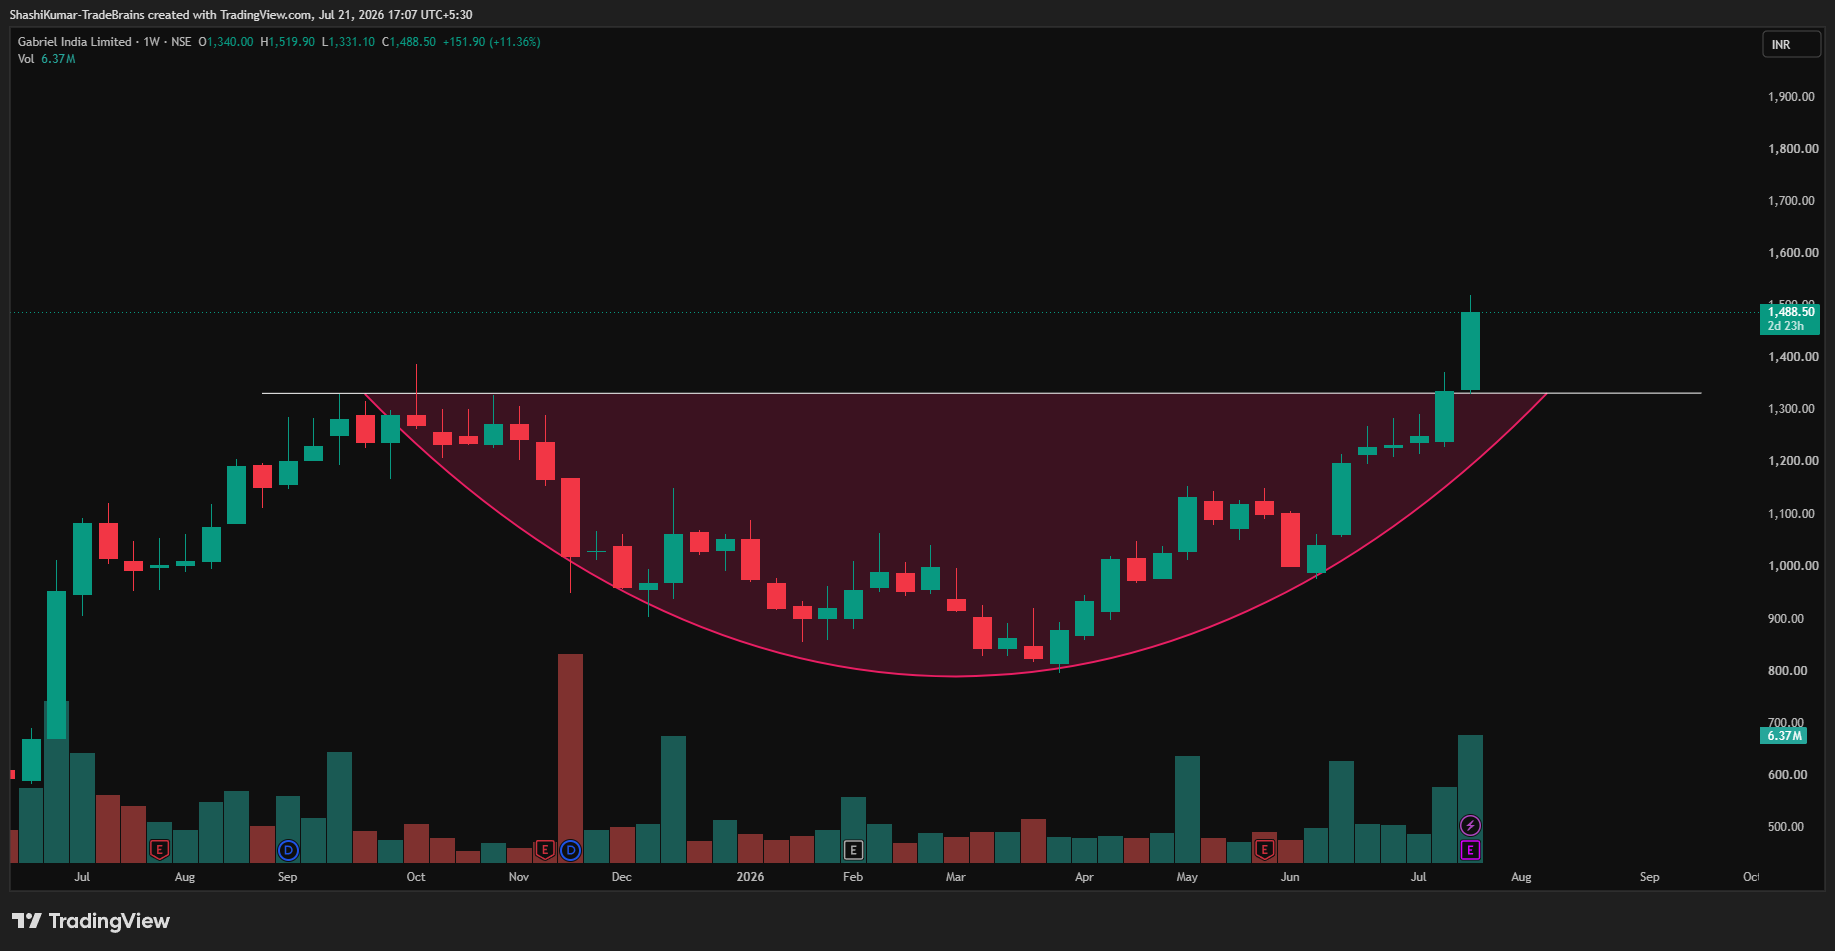
Gabriel India Ltd Chart: 1-week Timeframe
Indicator Confirmation
- RSI: The weekly RSI indicates bullish momentum, as it rose from 68.41 in the previous week’s session to 74.10, which is an overbought zone.
- MACD: On the weekly time frame, the blue MACD line was above the orange signal line, with the histogram turning green, indicating bullish momentum.
- Moving Averages: On the weekly time frame, the 5-day EMA was above the 9-day EMA, further confirming a bullish trend.
- Price Volume Trend: The Price Volume Indicator confirms the uptrend, accompanied by a sharp increase in buying volume in the weekly time frame.
Implications
A rounding bottom pattern in an uptrend signals a potential bullish continuation. Sustaining above the Rs 1,322 support level, backed by strong buying volumes, could strengthen the positive momentum and support further upside in the near term.
About the stock
Gabriel India is the flagship company of the ANAND Group. From being a single-product company in 1961. The company has established a significant presence across all automotive customer segments, including original equipment manufacturers (OEMs), aftermarket, and exports. Gabriel India’s robust design and engineering capabilities have helped customers and technological needs of the automotive industry by creating lighter, fuel-efficient, and more enduring vehicles that ensure passenger comfort and safety.

Gabriel India Ltd. has gained 21.60% in the past month. The stock has also surged 69.16% over the last six months and delivered an impressive 54.11% return on a YoY basis, reflecting sustained buying interest and long-term strength. For more such technical stock ideas, clickhereto view our research page.
Disclaimer: The views and investment tips expressed by investment experts/broking houses/rating agencies on tradebrains.in are their own, and not that of the website or its management. Investing in equities poses a risk of financial losses. Investors must therefore exercise due caution while investing or trading in stocks. Trade Brains Technologies Private Limited or the author are not liable for any losses caused as a result of the decision based on this article. Please consult your investment advisor before investing.