

How To Use Keltner Channels Indicator: To be able to analyse the price movements of securities, one should gain knowledge of technical analysis tools to be profitable and manage the risks involved.

One of the popular technical indicators to analyse the charts is the Keltner Channels Indicator. It is used to analyse the trends and price reversals of security by market participants to have a better view of price movements.
Keltner Channels Indicator is a volatility-based and trend-following technical indicator used to gain potential views on volatility, channel breakouts and trend directions.

Here, we shall understand How To Use Keltner Channels Indicator, the formula used and the strategies involved with examples of charts..
What is Keltner Channels Indicator?
Keltner Channels are volatility-based technical indicators introduced by Chester Keltner in the 1960s. The channel is comprised of three lines, the inner/middle line is an Exponential Moving Average(EMA) and the upper & lower bands are of Average True Range(ATR).

The price of security oscillates between the upper and lower bands which helps to identify price trends, volatility, reversals, overbought & oversold zones and support & resistance levels.
Keltner channel indicator bands contract and expand as the volatility of security decreases and increases respectively. It is also a trend-following indicator as the channels indicate the trend direction and are similar to the Bollinger Bands Indicator.
Formula to calculate Keltner Channels Indicator
Keltner channel upper band:- EMA + (multiplier x ATR)

Keltner channel middle line:- EMA
Keltner channel lower band:- EMA – (multiplier x ATR)
Here,
- EMA = Exponential Moving Average, its period is default set to 20.
- ATR= Average True Range, its period is default set to 10 or 20.
- Multiplier = set to 2, which means the upper band is (2 x ATR) above EMA and the lower band is (2 x multiplier) below the EMA.
Channels become wider with a higher multiplier value and narrower with a lesser multiplier value. Traders can adjust the periods and multiplier to any of the values based on their strategies.
How To Use Keltner Channels Indicator
Keltner Channels Indicator helps to build various strategies to trade in securities.
Here we shall discuss how to identify trend direction, support and resistance, volatility and overbought oversold zones of securities using the Keltner channels indicator.
Trend Direction
The direction of the channel indicates the direction of the trend.
When the channel of the indicator is in a downtrend, the existing trend in the market can be assumed to be Bearish.
The price breaks below the lower band, and the Bearish momentum becomes even more stronger.
When the channel of the indicator is in an uptrend, the existing trend in the market can be assumed to be Bullish.
The price breakout above the upper band, and the Bullihsh momentum becomes even more stronger.
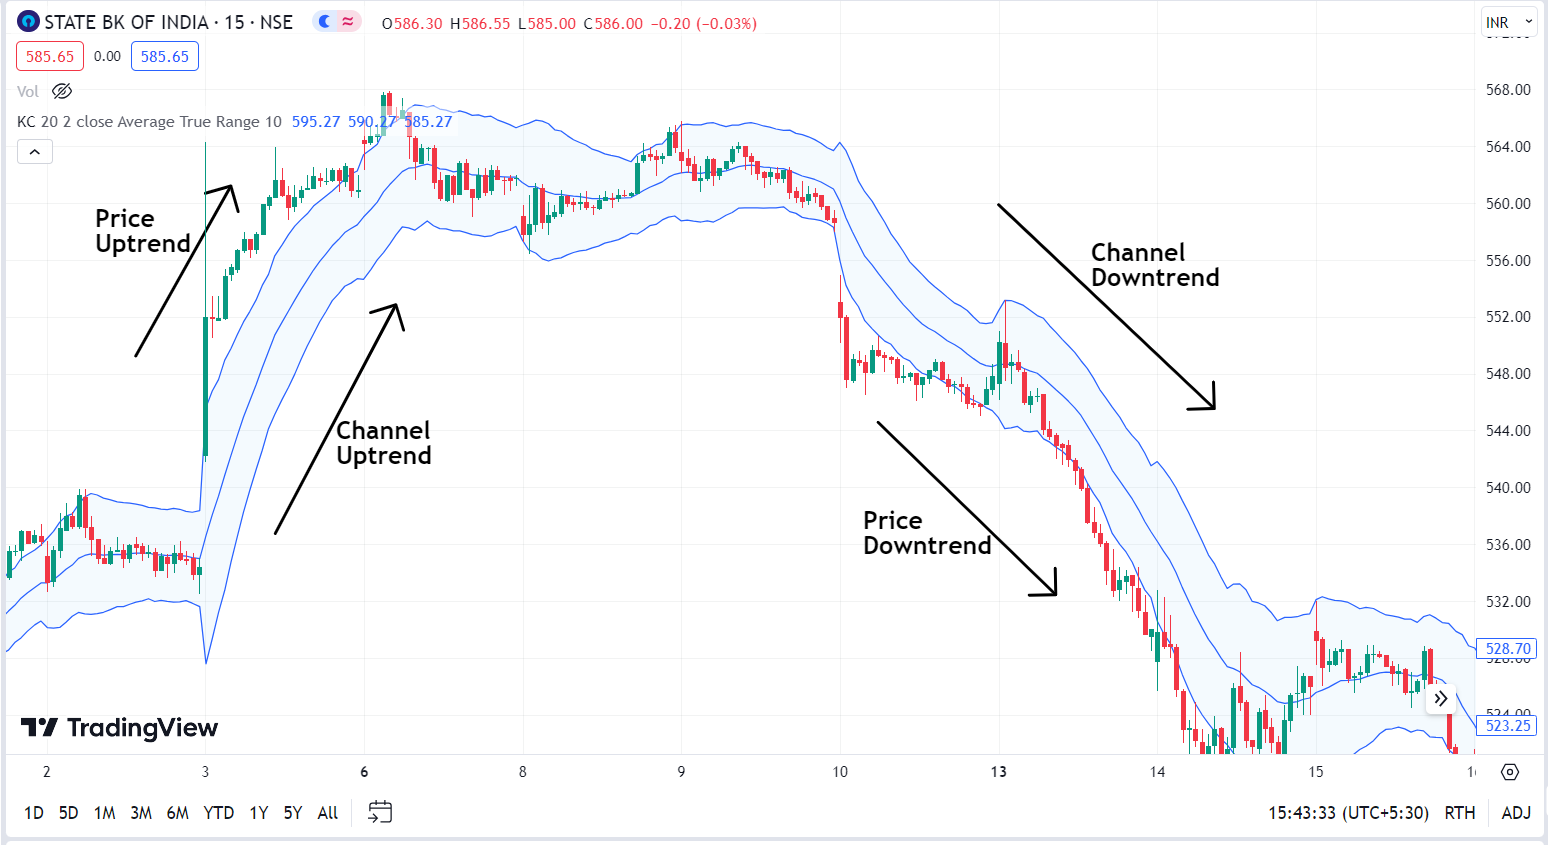
Chart of SBI Bank showing trend direction With Keltner channel indicator.
During rangebound markets, the channels remain sideways.
Support and resistance
Support and resistance levels are the key to identifying breakouts for trend directions. The Keltner channel indicator helps to identify support and resistance levels of security.
When the price oscillates between the upper and the lower bands, traders can use the upper band as resistance levels and the lower band as support levels.
When the price of security touches the resistance level. it can reverse down, and a short position can be initiated. And if one is holding longs then they can either exit them or put a stop loss for their trade.
And Vice versa if the price of Security touches the Support Levels.
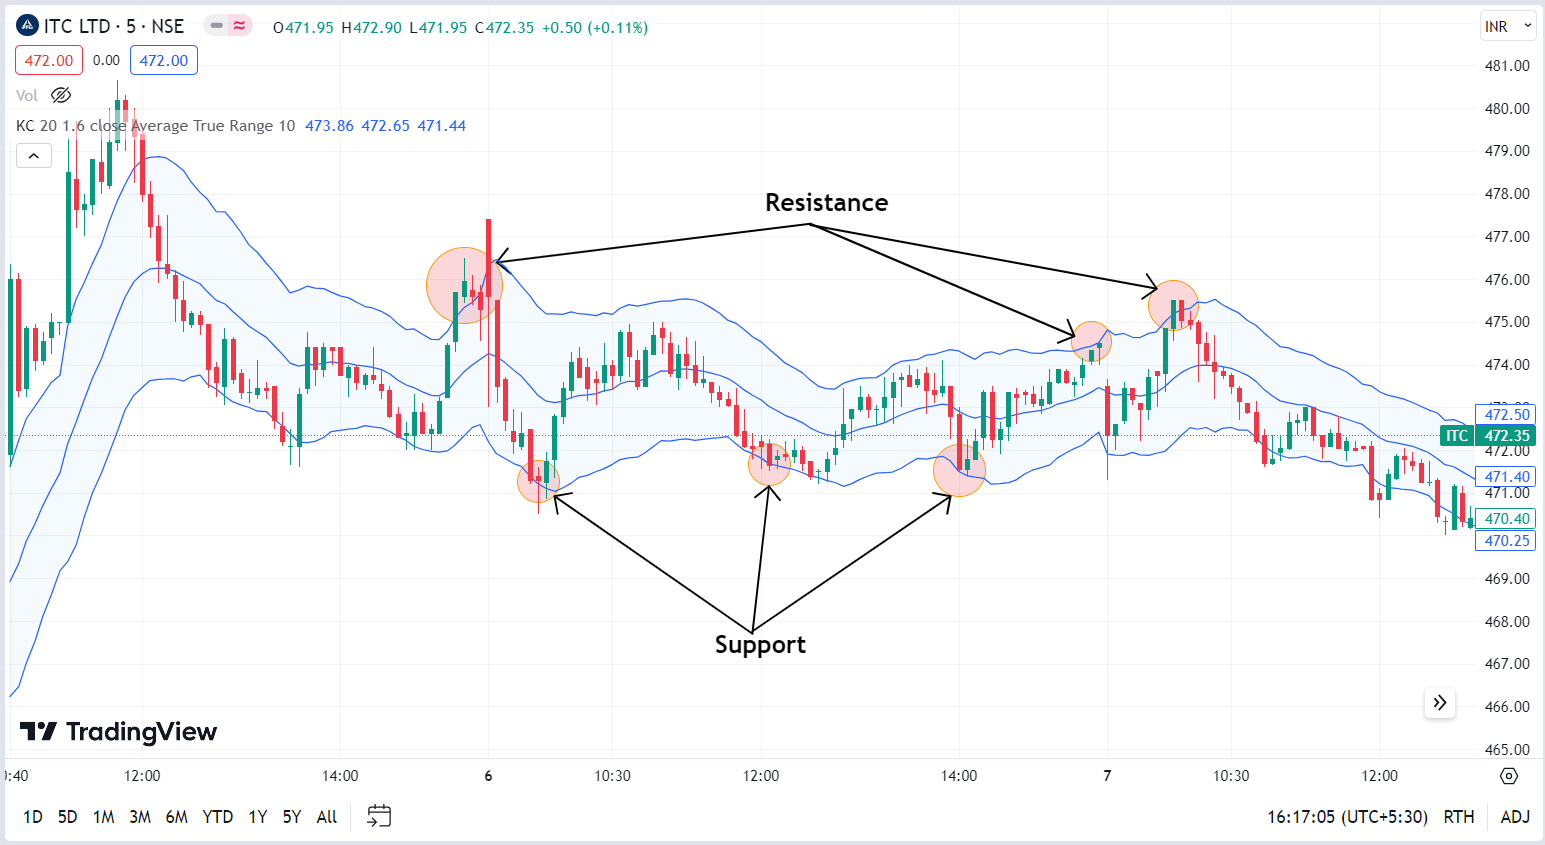
Chart of ITC LTD showing support and resistance levels with Keltner Channels Indicator
Overbought and Oversold zones
Keltner channels identify overbought and oversold levels to analyse the securities price movement.
When the price is trading above the upper band of the Keltner channel indicator then security is considered to be in an overbought zone.
The price reversal from the overbought zone can trigger an entry to a short position.
When the price is trading below the lower band of the Keltner channel indicator then security is considered to be in an oversold zone.
The price reversal from the oversold zone can trigger an entry to the long position.
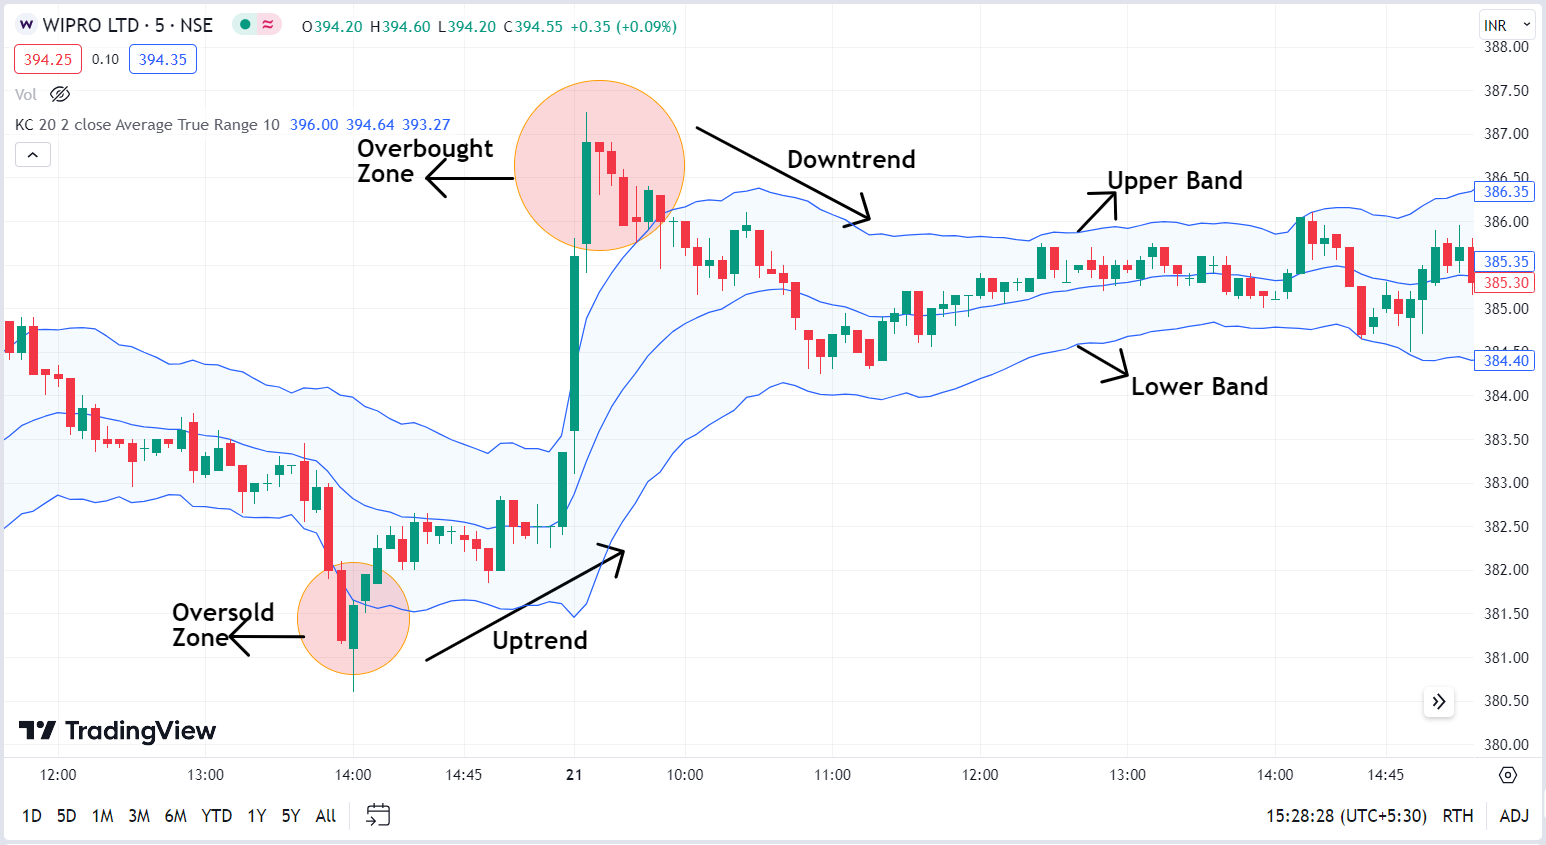
Chart of WIPRO LTD showing overbought and oversold zones with Keltner channels Indicator.
Volatility
As the indicator is based on Average True Range(ATR) it provides value to measure the volatility present in the security.
When the security is highly volatile, the bands of the Keltner channel indicator expand.
When the security is less volatile, the bands of the Keltner channel indicator contract.
Kelter channels assist traders to adopt market volatility and manage the strategies for open positions.
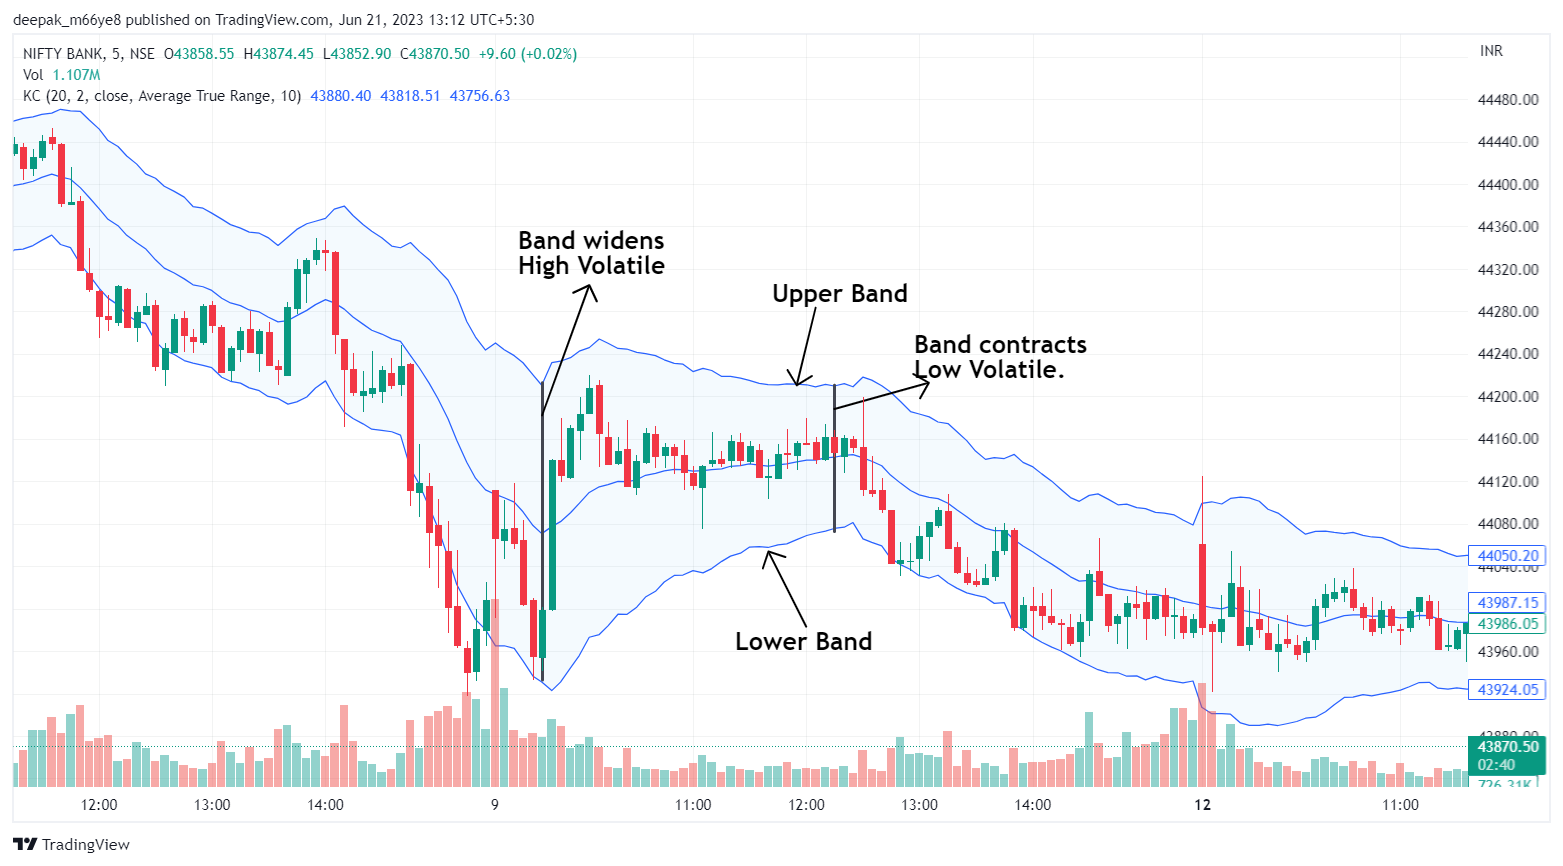
Volatility in Bank Nifty is indicated by the Keltner channel indicator.
Keltner Channels vs Bollinger Bands
Both indicators are pretty similar in interpreting strategies to identify entry or exit opportunities.
Keltner channels are based on Average True Range(ATR) to calculate the upper and lower bands. Conversely, Bollinger Bands use Standard deviation to calculate the upper and lower bands. Hence, Keltner channels are more smoother than Bollinger bands.
The middle line of the Bollinger bands is of simple moving average while Keltner channels are of exponential moving average. Hence, Keltner channels are more sensitive to the price of the security.
Limitations of Keltner Channels Indicator
- Keltner channels become too narrow or too widened due to the volatility present, which can lead to false signals.
- During range-bound markets, the Keltner channels become sideways which is difficult to trade.
- Keltner channels are lagging indicator as it depends on the previous price data.
- The failure to adjust proper parameters in the indicator can lead to false breakouts or reversals which may result in wrong entries.
In Closing
Keltner channels are the trend-following indicator which is an important technical analysis tool to analyse the volatility present in the markets.
As discussed above, the indicator’s various applications help traders identify trend directions, reversals, support and resistance levels.
To build confirmation on the views developed by the Keltner channels indicator it is advised to use other technical analysis tools like chart patterns, price actions and indicators along with the Keltner channels indicator.
Traders can adjust the time frames and indicator parameters based on their strategies built and are advised not to deviate too far from the default settings to avoid false signals.
One should gain knowledge of the Keltner channel technical indicator for a better view of price movements and to manage the risks involved.
Written By Deepak M
By utilizing the stock screener, stock heatmap, portfolio backtesting, and stock compare tool on the Trade Brains portal, investors gain access to comprehensive tools that enable them to identify the best stocks also get updated with stock market news, and make well-informed investment decisions.

