

Understanding what is Ichimoku Cloud: The importance of Technical Indicators can be understood from the simple fact that whenever any analysis is done in any form of media, the first thing we hear is, “This stock looks Technically bullish or this stock looks technically bearish and so on”.

In our discussion today, we will try to understand the technical indicator which is considered to be slightly more complicated than most of the other indicators. We are talking about the concept of Ichimoku Cloud. We will try to explain it in a simple manner. Keep Reading!
Who developed the Ichimoku Indicator?
The concept of the Ichimoku cloud was developed by Goichi Hosada, a Japanese journalist in the late 1906’s. While the concept might look a little complicated at the first glance, but if we talk to traders who have been using this indicator for some time, they vouch for it to be the simplest and easy to understand type of Technical Indicator

Ichimoku cloud indicator is a technical indicator that gives you information about various factors like-
- Momentum in the Market
- Direction Expectation from market
- Volatility
- Support and Resistance Levels
- And Potential Reversals in the maret
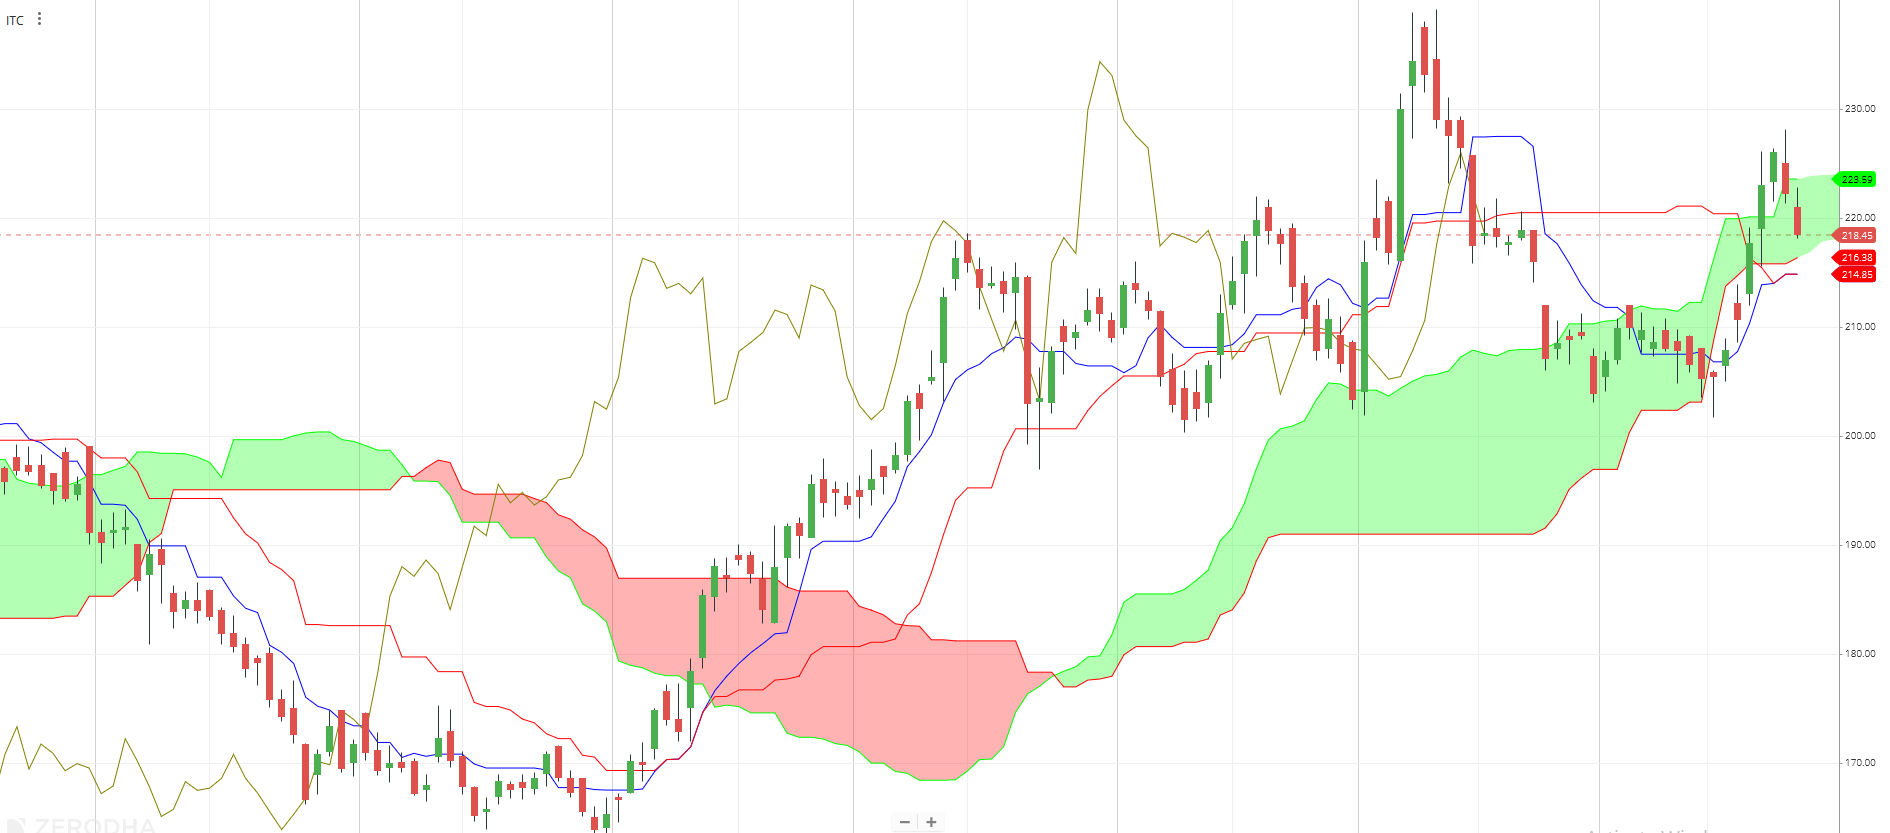
(Image 1: Ichimoku cloud on ITC, www.zerodha.com)

What does ICHIMOKU cloud do?
Here is the basic implementation of Ichimoku Cloud that you should know:
- Ichimoku Cloud provide us with all the information about the stocks (price) just by having a quick glance at the chart
- When the price is above the cloud, it is considered to be bullish, and bearish when the price is below the cloud, it is considered to be in downtrend
- When Leading Span A is rising and above Leading Span B, this helps in confirming the uptrend and space between the lines are typically coloured green. (Image 2)
- When Leading Span A is falling and below Leading Span B, this helps in confirming the downtrend. The space between the lines is typically coloured red. (Image 2)
- It is advised to use Ichimoku in conjunction with other indicators as it will always provide a better risk-adjusted return. It is ill advised to form a trade judgement just by looking at one indicator. Similar view from more than one indicator (about the movement in the price direction) always adds more conviction to the trade.
Components of ICHIMOKU cloud

(Image 2: Ichimoku Cloud on ICICI bank, www.zerodha.com)
The various components of the ICHIMOKU cloud mentioned in the image above have been explained below:

1. TENKAN SEN – This is a 9-day moving average line that shows the average value of highs and lows on the charts over the last 9 days. This is the first line of support (if the market is trading above it) or resistance (if the market is trading below it). Perhaps the most important signal given by this indicator.
The formula for calculating this line is: [(9 period high + 9 period low)/2].
2. KIJUN SEN – This is a 26-day moving average line that shows the average value of highs and lows on the charts over the last 26 days. Because the time frame under consideration here is of longer duration, the curve sometimes might look flatten. This is also an important line of support (if the market is trading above it) or resistance (if the market is trading below it).
The formula for calculating this line is: [(26 period high + 26 period low)/2]
3. CHIKOU SPAN – Chikou span is a lagging indicator and it plots the closing price 26 periods back. It helps us in understanding as to what have been the scenario if the prices were trading in historical terms
4. SENKOU SPAN A – It is a leading indicator plotted 26 periods ahead. It is calculated from the last 26 periods by taking the midpoint of Tenken and Kijun.
It is calculated as: [(Tenkan Sen + Kijun Sen)/2]
5. SENKOU SPAN B –This is a lagging indicator and it is calculated by using the 52 weeks highs and lows
It is calculated as: [(52 period high + 52 period low)/2]
6. KUMO (The cloud) – Kumo or the cloud is the region between SPAN A and SPAN B. If SPAN A is above SPAN B, then it is a Bullish Kumo, and if SPAN A is below SPAN B, then it is a Bearish Kumo.
Interpreting ICHIMOKU cloud
Ichimoku Cloud is a form of indicator in which the trend of the market can be understood by just having a simple glance at the chart.
The Indicator tells us a lot about the existing trend in the market. The trend can be assumed to be bullish if the price is trading above the cloud, and vice-versa if the price is trading below the cloud. And if the prices are trading between the clouds, then the trend can be assumed to be Trendless or Transitioning. So, it is best if we avoid trading in the trendless zone as the market might spend a lot of time there before making an actual move.
BULLISH or BEARISH Cloud
For a cloud pattern to be Bullish:
- Prices (of stock) should be above Tenkan Sen (9 days) and Tenkan should be above Kijun Sen (26 days)
- Both Tenkan and Kijun lines should be trending up along with prices
- The KUMO (cloud) should be bullish
- And the prices should be trading above the KUMO candle
For a cloud pattern to be Bearish:
- Prices should be below Tenkan (9 days) and Tenkan should be below Kijun (26day)
- Both Tenkan and Kijun lines should be trending downwards along with the decline in prices
- The KUMO (cloud) should be bearish
- And the prices should be trading below the KUMO candle

(Image 3: Ichimoku Cloud on TCS, zerodha)
The chart above (TCS) is a classical Ichimoku chart. When the market is trading below the cloud, there is bearish (selling) pressure in the market. And when the prices are trading above the cloud, we see bullish momentum in the market.
Conclusion
It would be wise to say that the Ichimoku cloud might look complicated at the initial glance, but with careful analysis and simple understanding, it can provide a lot of information which could be of relevance for the purpose of trading. Most importantly one can understand the current momentum in the market and avoid going against it.
That’s all for this post on understanding the Ichimoku cloud. Do comment below which indicator should we cover next. Have a great day. Happy trading!


