The market sentiment on Friday reflected a cautious yet resilient tone as both the Nifty 50 and the Sensex opened lower but managed to recover most of their intraday losses by the close. Despite the weak start, both indices stayed above their key moving averages, signalling that broader market strength remains intact even as short-term volatility persists. Traders adopted a wait-and-watch approach amid mixed global cues and continued foreign fund outflows, with momentum indicators hovering around neutral levels. This suggested that while the market lacked strong bullish conviction, selling pressure was also limited, indicating consolidation rather than panic.
Across sectors, the mood was mixed. The Nifty Metal and PSU Bank indices emerged as bright spots, supported by buying in select metal and public sector banking stocks, hinting at rotational interest among investors. On the other hand, the Infrastructure, Consumer Durables, and IT indices witnessed profit booking, reflecting concerns over global demand and corporate earnings. The Nifty FMCG index also softened, adding to the subdued tone. Global sentiment, weighed down by declines in major Asian indices and weak U.S. futures, reinforced a cautious outlook. Overall, the week ended with the Nifty 50 and Sensex both posting mild declines, reflecting consolidation amid uncertainty and a cautious global environment.
In this overview, we will analyse the key technical levels and trend directions for Nifty and BSE Sensex to monitor in the upcoming trading sessions. All the charts mentioned below are based on the 5-minute timeframe.
NIFTY 50 Chart & Price Action Analysis
(In this analysis, we have used 20/50/100/200 EMAs, where 20 EMA (Red), 50 EMA (Orange), 100 EMA (Light Blue), and 200 EMA (Dark Blue)).
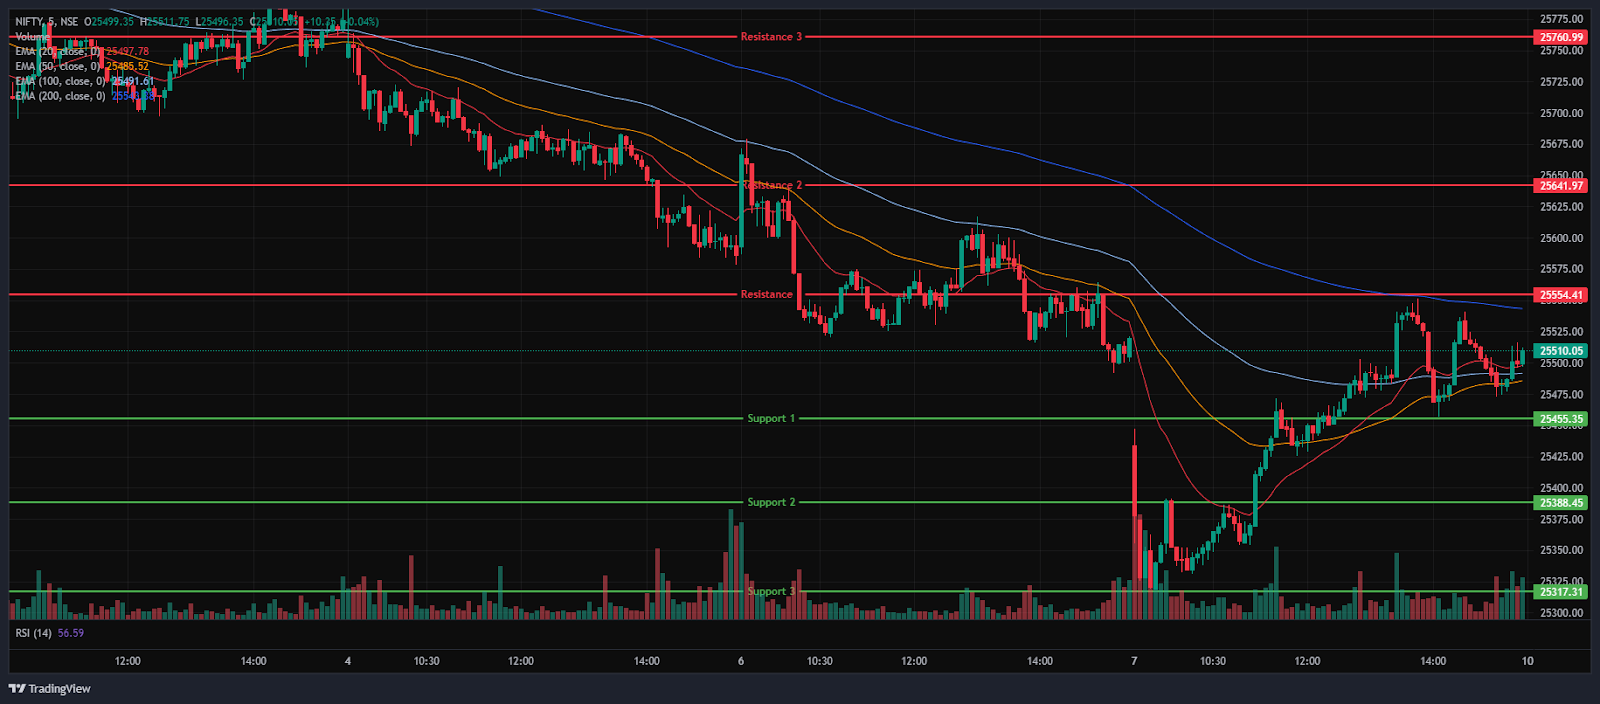
The Nifty 50 Index opened on a negative note at 25,433.80 on Friday, down by 75.9 points from Thursday’s closing of 25,509.70. The index opened on a bearish note and was dragged down to the 25,318.45 level. But later recovered from the day’s low and traded within the 25,300-25,500 range. It traded below the EMAs of 50/100/200 but above the 20-day EMA in the 15-minute chart. In the afternoon session, the index further moved upwards and hit an intraday high of 25,551.25 and settled near the 25,500 level. Overall, the Index traded within a 25,450-25,550 range throughout the afternoon session. During the afternoon session, the Nifty 50 closed below the 50/100/200 EMAs but above the 20-day EMA in the 15-minute time frame.
The Nifty’s immediate resistance levels are R1 (25,554), R2 (25,642), and R3 (25,761), while immediate support levels are S1 (25,455), S2 (25,388) and S3 (25,317).
The Nifty index had reached a day’s high at 25,551.25 and saw a day’s low at 25,318.45. Finally, it had closed at 25,492.30, in the red and below the 25,500 level, down 17.4 points, or 0.068%. The Nifty 50 closed above the EMAs of 50/100/200 but below the 20-day EMA in the daily time frame.
NIFTY 50 Momentum Indicators Analysis
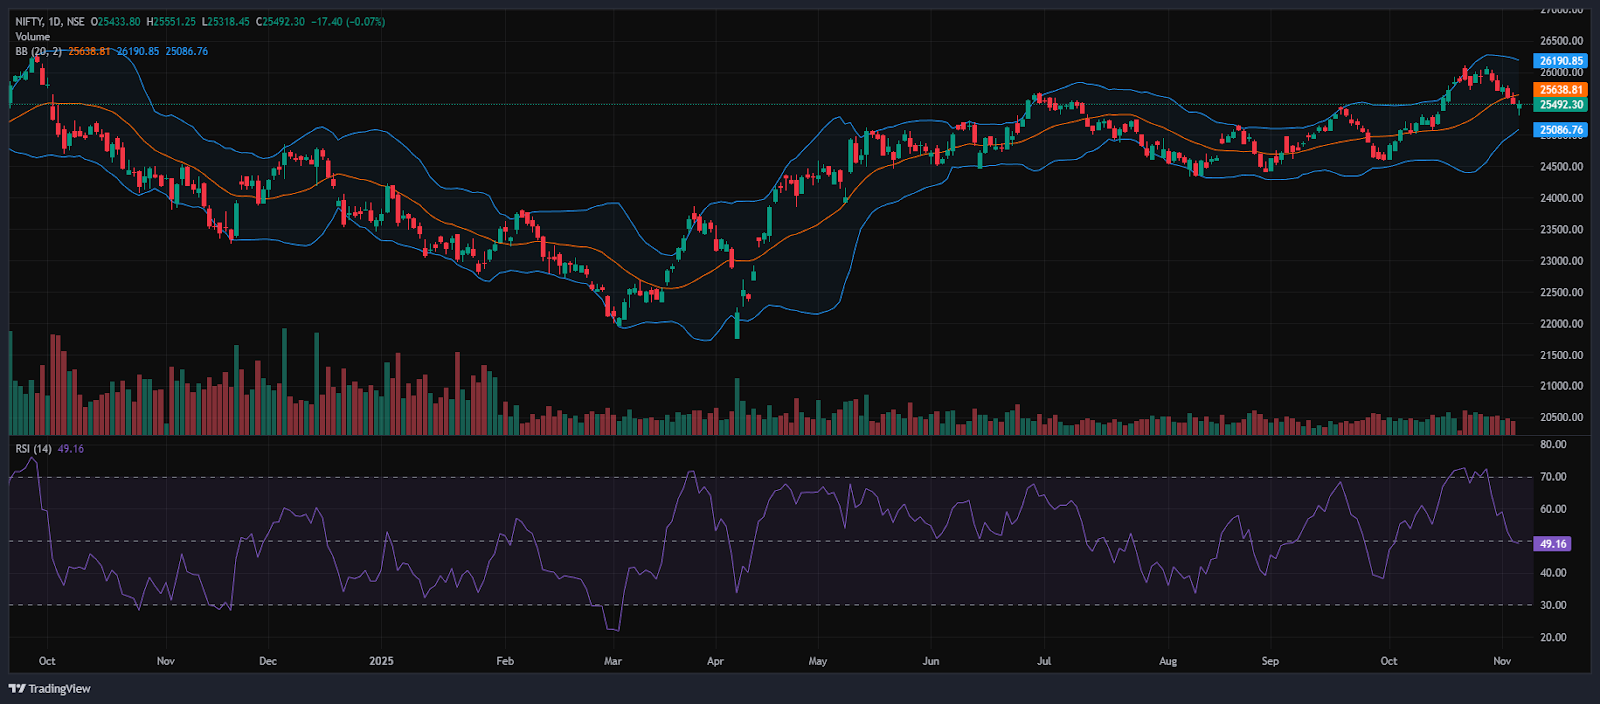
RSI (Daily): The Nifty 50’s RSI stood at 49.16, which is below the overbought zone of 70, near the support zone of 40-50.
Bollinger Bands (Daily): The index is trading in the lower band of the Bollinger Band range (Simple Moving Average). Its position in the lower range suggests a bearish sentiment, but in the daily time frame on Friday session, the Index formed a Hammer candle, which indicates a bullish reversal signal. The index took support near 25,318, and 25,551 acted as a resistance level. A sustained move above the middle band signals a bullish sentiment, while a drop back toward the lower band may reinforce bearish sentiment.
Volume Analysis: Friday’s trading session had an average volume of 305.61 Mn.
Derivatives Data: Options OI indicates strong Put writing at 25,400, followed by 25,300, establishing it as a firm support zone. On the upside, a significant Call OI buildup at 25,500 and 25,600 suggests a potential resistance supply. PCR (Put/Call Ratio) stands at 0.89 (<1), leaning towards bullish sentiment, but the long Buildup indicates a Strong Bullish outlook, thus indicating a bullish outlook for the next trading session.
Bank Nifty Chart & Price Action Analysis
(In this analysis, we have used 20/50/100/200 EMAs, where 20 EMA (Red), 50 EMA (Orange), 100 EMA (Light Blue), and 200 EMA (Dark Blue)).
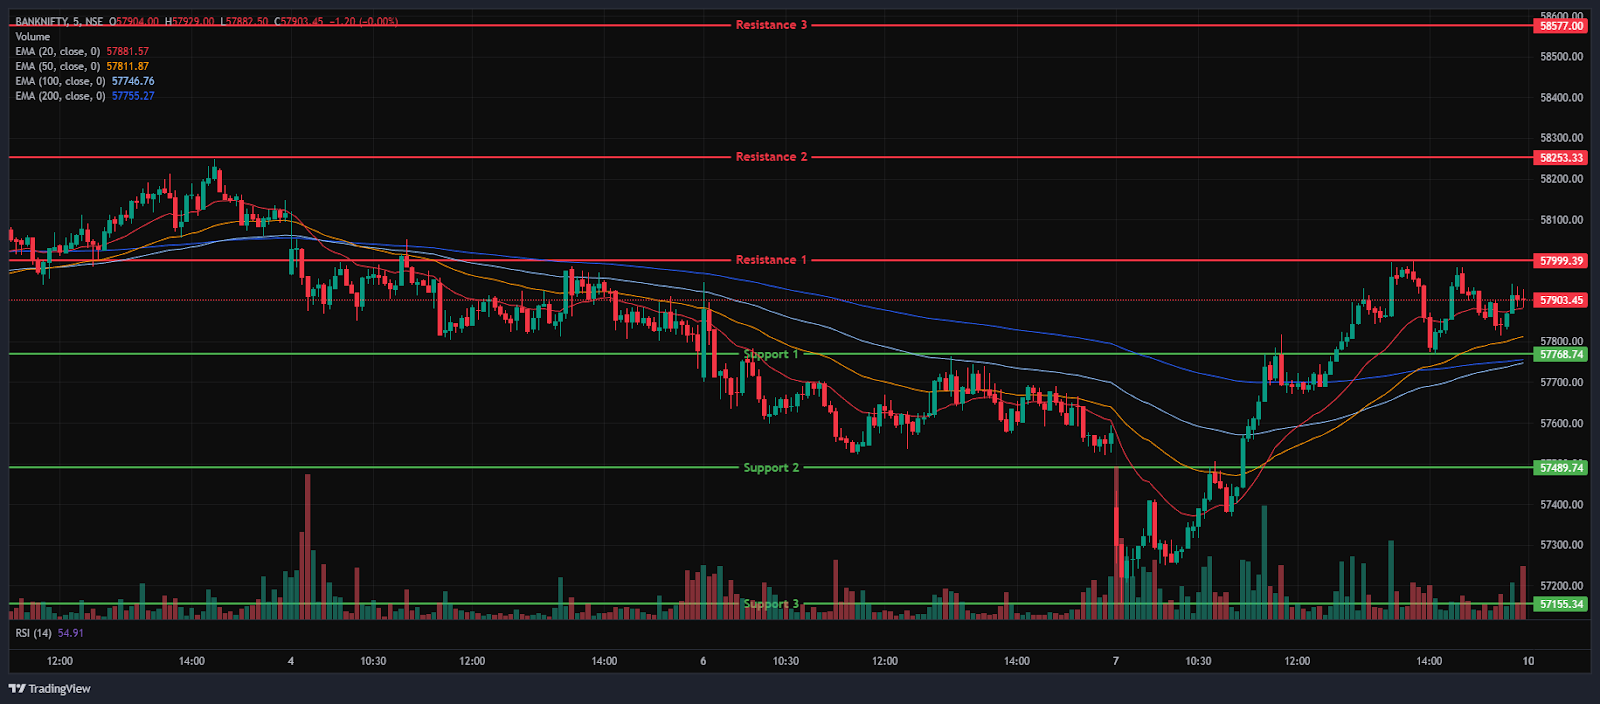
The Bank Nifty Index started the session on a negative note at 57,391.40 on Friday, down by 162.85 points from Thursday’s closing of 57,554.25. The index started on a Bearish note, and dragged down to the 57,150 level. But later, it moved upwards and was trading within the 57,150-57,850 range and was trading above the EMAs of 20/50/100 but remained below the 200-day EMA in the 15-minute time frame in the morning session. In the afternoon session, the Index hit an intraday high at 58,001.35 and settled above the 57,900 level. Further, the Index was trading in the range of 57,750-58,000, and ended with gains in green. During the afternoon session, Bank Nifty closed above all four EMAs of 20/50/100/200 in the 15-minute time frame.
The Bank Nifty’s immediate resistance levels are R1 (57,999), R2 (58,253) and R3 (58,577), while immediate support levels are S1 (57,769), S2 (57,490), and S3 (57,155).
The Bank Nifty index had peaked at 58,001.35 and made a day’s low at 57,157.85. Finally, it had closed in green at 57,876.80, rising above the 57,850 level, gaining 322.55 points or 0.56%. The Relative Strength Index (RSI) stood at 60.03, below the overbought zone of 70 in the daily time frame, and Bank Nifty closed above all four EMAs of 20/50/100/200 in the daily time frame.
BSE Sensex Chart & Price Action Analysis
(In this analysis, we have used 20/50/100/200 EMAs, where 20 EMA (Red), 50 EMA (Orange), 100 EMA (Light Blue), and 200 EMA (Dark Blue)).
The BSE Sensex Index opened on a negative note at 83,150.15 on Friday, down by 160.86 points from Thursday’s closing of 83,311.01. The index started its session on a bearish note, but later, it moved upwards and was trading within the 82,650-83,200 range. It traded below the EMAs of 50/100/200 but above the 20-day EMA in the 15-minute time frame in the morning session. In the afternoon session, the Index further climbed and touched 83,390.11, marking its day’s high and settled above 83,200. The Index was trading in the 83,000-83,400 range, following a bearish trend and closed below the EMAs of 50/100/200 but above the 20-day EMA in the 15-minute time frame.
The BSE Sensex immediate resistance levels are R1 (83,393), R2 (83,841) and R3 (84,289), while immediate support levels are S1 (83,065), S2 (82,665), and S3 (82,153).
The BSE Sensex index had peaked at 83,390.11 and made a day’s low at 82,670.95. Finally, it had closed at 83,216.28 in red, losing 94.73 points or 0.11%. The Relative Strength Index (RSI) stood at 49.46, below the overbought zone of 70 in the daily time frame, and the BSE Sensex closed above the EMAs of 50/100/200 but below the 20-day EMA in the daily time frame.
Market Recap on November 7th, 2025
On Friday, the Nifty 50 opened lower at 25,433.80, down -75.90 points from its previous close of 25,509.70. The index hit an intraday low of 25,318.45 and closed at 25,492.30, down -17.40 points, or -0.07%. The index went below the 20-day EMA and touched the 50-day EMA during the day but closed above key moving averages (50/100/200-day EMAs) on the daily chart. The BSE Sensex mirrored the Nifty’s trend, opening at 83,150.15, down -160.86 points from the previous close of 83,311.01. It followed a similar pattern, closing at 83,216.28, a fall of -94.73 points, or -0.11%. Both indices showed high momentum, with RSI values for Nifty 50 at 49.16 and Sensex at 49.46, below the overbought threshold of 70.
On Friday, indices show a mixed reaction. The Nifty Metal index was the major gainer, rising 1.41% or 144.90 points, and standing at 10,426.80. Stocks such as Hindustan Copper Ltd rose 3.26%, followed by Adani Enterprises Ltd and Jindal Steel Ltd, which gained up to 2.38% on Friday. The Nifty PSU bank index was also among the biggest gainers, rising 0.87% or 71.75 points, and standing at 8,352.15. Stocks such as Bank of Maharashtra Ltd jumped 3.83% on Friday. While other PSU bank stocks like Bank of India, Punjab & Sind Bank, and Indian Overseas Bank also gained up to 3.15%.
On the Sectoral Losers, the Nifty Infrastructure Index was the biggest loser, falling -1.00%, or -95.20 points, to 9,393.60. Infra stocks like Bharti Airtel Ltd, Suzlon Energy Ltd, Godrej Properties Ltd, and Interglobe Aviation Ltd saw declines of up to -4.47%. The Nifty Consumer Durables Index also fell on Friday, losing -274 points or -0.72%, ending at 37,617.25. Amber Enterprises Ltd fell the most, declining by -7.73% after posting a net loss in Q2 FY26, followed by PG Electroplast Ltd, Cera Sanitaryware Ltd, and V-Guard Industries Ltd, falling up to -3.96%. The Nifty IT Index followed the decline, losing -0.62% or -220 points, to close at 35,117.6. Tech stocks, including Tech Mahindra Ltd, Oracle Financial Services Software Ltd, LTIMindtree Ltd, and Wipro Ltd, fell up to 1.90%. The Nifty FMCG Index also fell on Friday’s trade, ending at 55,437.2, down -274.5 or -0.49%.
Asian markets had an overall bearish sentiment on Friday. Japan’s Nikkei 225 declined by 743.68 points or 1.48%, closing at 50,140. While China’s Shanghai Composite fell by -10.20 points, or -0.26%, to 3,997.56, similarly, Hong Kong’s Hang Seng Index also declined by -250.9 points, or -0.96%, to close at 26,235. Singapore’s Straits Times Index, however, increased by 7.25 points or 0.16%, finishing at 4,492.24, but South Korea’s KOSPI decreased by -72.69 points or -1.84%, closing at 3,953.76. At 4:49 p.m. IST, U.S. Dow Jones Futures were lower, down -0.14%, at 46,838.86, losing -73.44 points.
This week, the broad indices Nifty 50 and Sensex declined by -0.89% and -0.86% respectively. Ongoing foreign capital outflows and a cautious global outlook continued to weigh down the markets.
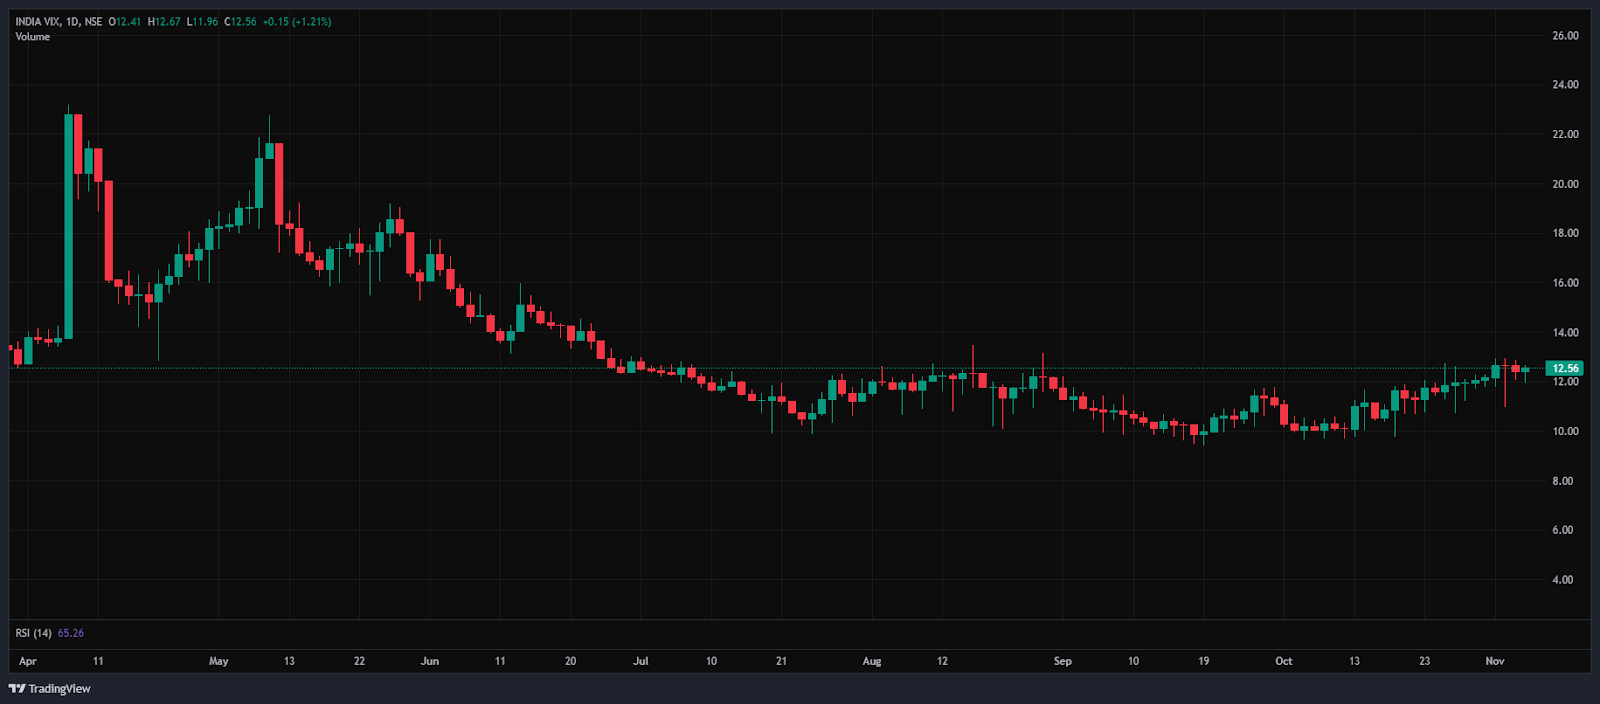
India VIX
The India VIX increased 0.15 points or 1.21%, from 12.41 to 12.56 during Friday’s session. An increase in the India VIX typically indicates higher price volatility in the stock market, suggesting a less stable market environment. However, a stable market environment and minimal volatility are anticipated when the India VIX is below 15.
Trade Setup Summary:
The Nifty 50 opened on a negative note at 25,434 on Friday and ended the session in the red below the 25,500 level at 25,492.30. A break below 25,455 could trigger further selling towards 25,388, while breaking the next resistance level of 25,554 could trigger bullishness towards the 25,642 level.
The Bank Nifty also started the session on a negative note at 57,391 but ended the session in the green at 57,877, above the 57,850 level. A break below 57,769 could trigger further selling towards 57,490, while breaking the next resistance level of 57,999 could trigger bullishness towards the 58,253 level.
The Sensex opened on a negative note at 83,150 and ended the session in the red at 83,216, below the 83,250 level. A break below 83,065 could trigger further selling towards 82,665, while breaking the next resistance level of 83,393 could trigger bullishness towards the 83,841 level.
Given the ongoing volatility and mixed sentiments, it’s advisable to avoid aggressive positions and wait for clear directional moves above resistance or below support. Traders should consider these key support and resistance levels when entering long or short positions following the price break from these critical levels. Additionally, traders can combine moving averages to identify more accurate entry and exit points.
