

RSI Trading Strategies: In the world of stock market trading, market participants consistently seek knowledge of the technical indicators to gain and make informed decisions about market positions. One such technical indicator tool is Relative Strength Index(RSI). It is the widely used indicator tool to access market trends, support, resistance levels, and entry-exit for long-term and short-term positions.

What is Relative Strength Index (RSI)?
The RSI, developed by J. Welles Wilder is a technical Indicator tool used in stock market analysis. It is a momentum oscillator which measures the speed and change of price movements. Mainly RSI is used to identify the over-bought and over-sold zones in the market. It can also indicate a trend reversal and buy/sell signals.
The formula to calculate RSI involves

1. Calculate the average gain and average loss for a period
Average gain= sum of gains/number of periods.

Average loss= sum of losses/number of periods.
2. Calculate the Relative Strength(RS)
RS = Average gain/average loss.

3. Calculate RSI.
RSI= 100-(100/(1+RS))
RSI Trading Strategies
RSI is typically calculated by considering the average of gains and losses over a certain period which is usually 14 days.
RSI oscillates between a range of 0 to 100 in which the range can be adjusted according to the strategies.
Overbought Zone
The RSI indicates the overbought zone.
Assume the RSI range is set from 30 to 70, when the oscillator moves above the line 70 then the zone is considered to be an overbought zone. When the indicator moves below the over-bought line a short position can be placed.
Oversold Zone
The relative strength index Indicates the oversold zone.
Considering the RSI range is set from 30 to 70, when the oscillator moves below the line 30 then the zone is considered to be oversold. When the indicator moves above the over-sold zone a long position can be placed.
A clear view of the overbought and oversold zone on the image for better understanding.

RSI Trading Strategies – Divergence
RSI divergence occurs when the price of the securities direction is opposite to the change in momentum of the RSI indicator.
Two types of RSI Divergence.
- Bullish Divergence
- Bearish Divergence
Bullish Divergence.
A bullish divergence is formed when the price of the security is making a lower low but the RSI indicator is diverging by higher lows. This indicates a rising bullish momentum and a long position can be placed as it moves above the oversold level as a confirmed trade.

Bearish Divergence.
A bearish divergence is formed when the price of the security records a higher high but the RSI indicator forms lower highs. Here the weaker momentum formed in the RSI gives the signal to take a short position or exit the long position. It is advised to take a confirmed trade once the RSI indicator moves below the overbought zone.

RSI Trading Strategies with Trend lines
The RSI indicator helps traders to identify potential breakouts or breakdowns.
Uptrend
During an uptrend, the RSI indicator helps traders to identify the actual trend of the market.
RSI indicator moving in the selected range forms the trend by making higher highs in accordance with the securities making higher highs. It is clear to consider these higher highs to form the uptrend. Hence it is considered to take a long position.
The position can be trailed considering the RSI trendline as the support until a breakout is formed.
Consider the below chart of the security for a better understanding of the uptrend with the RSI indicator.

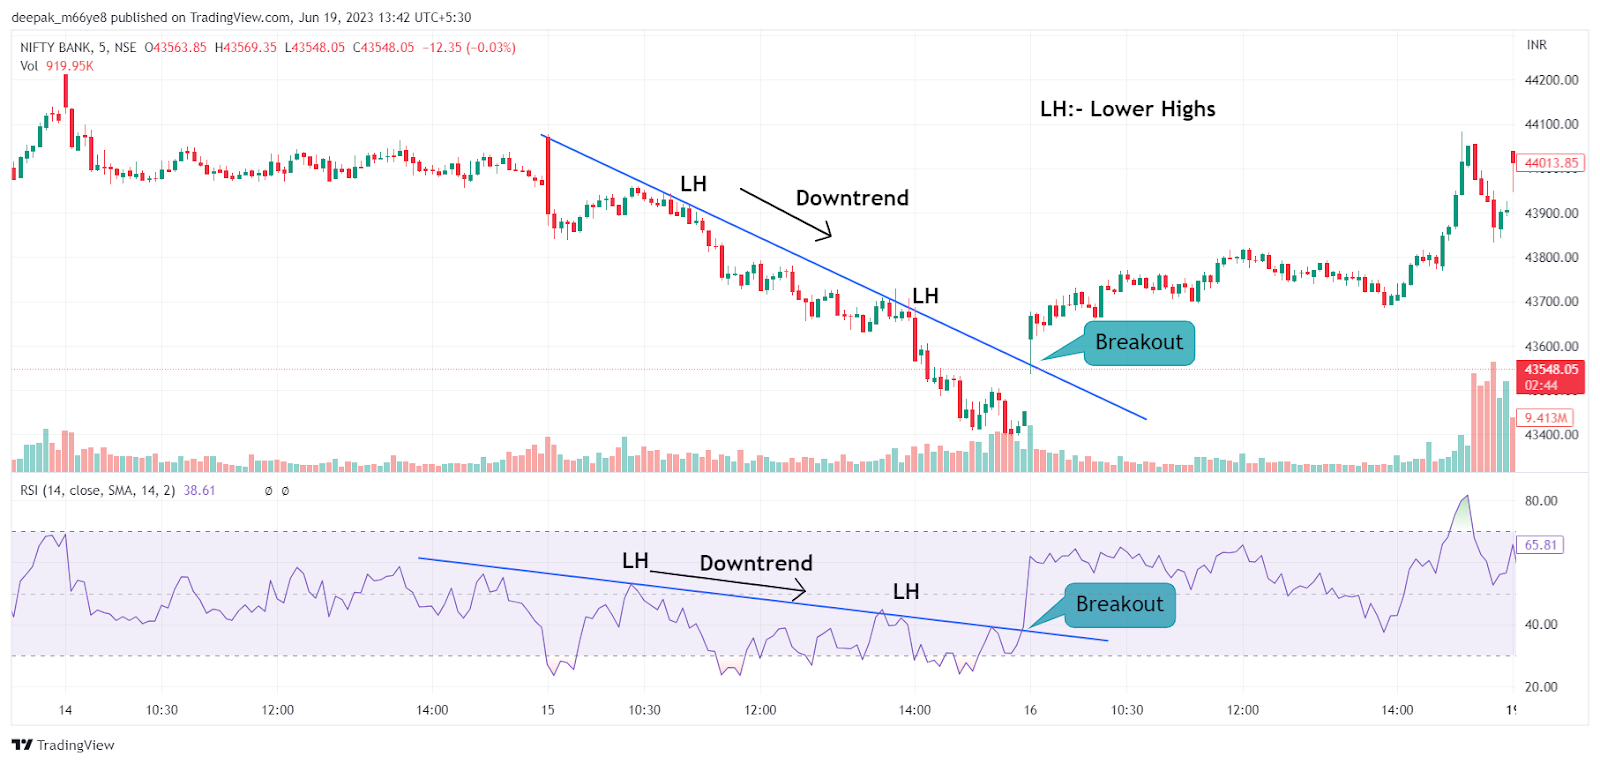
Downtrend
In a downtrend, the RSI indicator forms the trend line to help the trader actually decide the market downtrend.
RSI indicator moving in the selected range forms the trend line by making lower highs in line with the securities making lower highs.
Forming lower highs joined to identify as a downtrend, the short position will be trailed until the breakout of the trend line is formed with the RSI indicator.
The below chart of the security gives a clear view of the downtrend of the market with RSI.
RSI Trading Strategies – Support and Resistance
Support and Resistance are the key points for the trader to identify the breakouts for perfect trade signals.
RSI indicator is widely accepted by the market to identify the support and resistance zones of the securities in accordance with the indicator movement.
Support with RSI indicator
Here, the RSI indicator retests in a specific region for a certain time period forming a support zone. This support zone gives conviction to the uptrend of security.
In the image below the RSI indicator is pulled back continuously in the zone of 40 to 50 which is a support zone .where the security is in the uptrend.
The pullbacks in the support zone help to identify the entry in the uptrend market to place a low-risk position.

Resistance with RSI indicator
On the other side, the RSI indicator retests in a specific region for a certain time period forming a Resistance zone. This resistance zone help to identify the downtrend of security.
In the image below the RSI indicator is fluctuated continuously in the zone of 50 to 60 which acts as a resistance zone, where the security is in the downtrend.
The pullbacks in the resistance zone help to identify the entry in the downtrend market to place a low-risk position.

RSI and MACD
Like Relative Strength Index(RSI), Moving Averages Convergence Divergence(MACD) is also a momentum indicator whereas MACD is the relation between two EMAs but RSI measures the price change momentum of recent prices.
However, they measure different factors market participants use both indicators for clear decisions.
RSI Time Frame for Intraday.
The default settings of RSI are set to 14 lengths. It can be adjusted from 8 to 14 in length on 5min or 15 min time frames for intraday positions as per trader’s strategies.
In Closing
The Relative Strength Index (RSI) indicator is a beautifully designed tool for market participants, providing good knowledge on price movements, overbought, oversold conditions, support, resistance and trend reversals.
Understanding the RSI and incorporating it into trading strategies will definitely help traders to identify the trends with good entry-exit positions.
RSI is a lagging indicator that can result in missing the opportunities of trades. During strong trends, the RSI may remain in overbought or oversold for extended periods.
As a trader using the RSI indicator in coordination with other technical tools will be highly recommended in order to have clear trading strategies and overcome the false signals of RSI.
Written by Deepak M
By utilizing the stock screener, stock heatmap, portfolio backtesting, and stock compare tool on the Trade Brains portal, investors gain access to comprehensive tools that enable them to identify the best stocks also get updated with stock market news, and make well-informed investment decisions.


