Synopsis: Nuvama Wealth Management Ltd has formed an inverted head-and-shoulders pattern on the 30-minute chart, indicating a potential near-term bullish reversal.
The inverted head-and-shoulders pattern reflects fading selling pressure and growing buying interest, signalling a potential bullish reversal. The Inverted Head & Shoulders pattern features three troughs, the lowest in the middle (the head) and two higher ones on either side (the shoulders). A breakout above the neckline signals a potential bullish reversal.

On Thursday, Nuvama Wealth Management Ltd broke above the neckline of an inverted head-and-shoulders pattern on the 30-minute chart. A sustained move above the Rs 1,210 support level could trigger further gains, while a fall below this level may weaken the bullish outlook.
For an inverted head & shoulders pattern, targets are placed at nearby resistance or by projecting the head-to-neckline distance upward. Traders trail profits and monitor volume and momentum for confirmation.

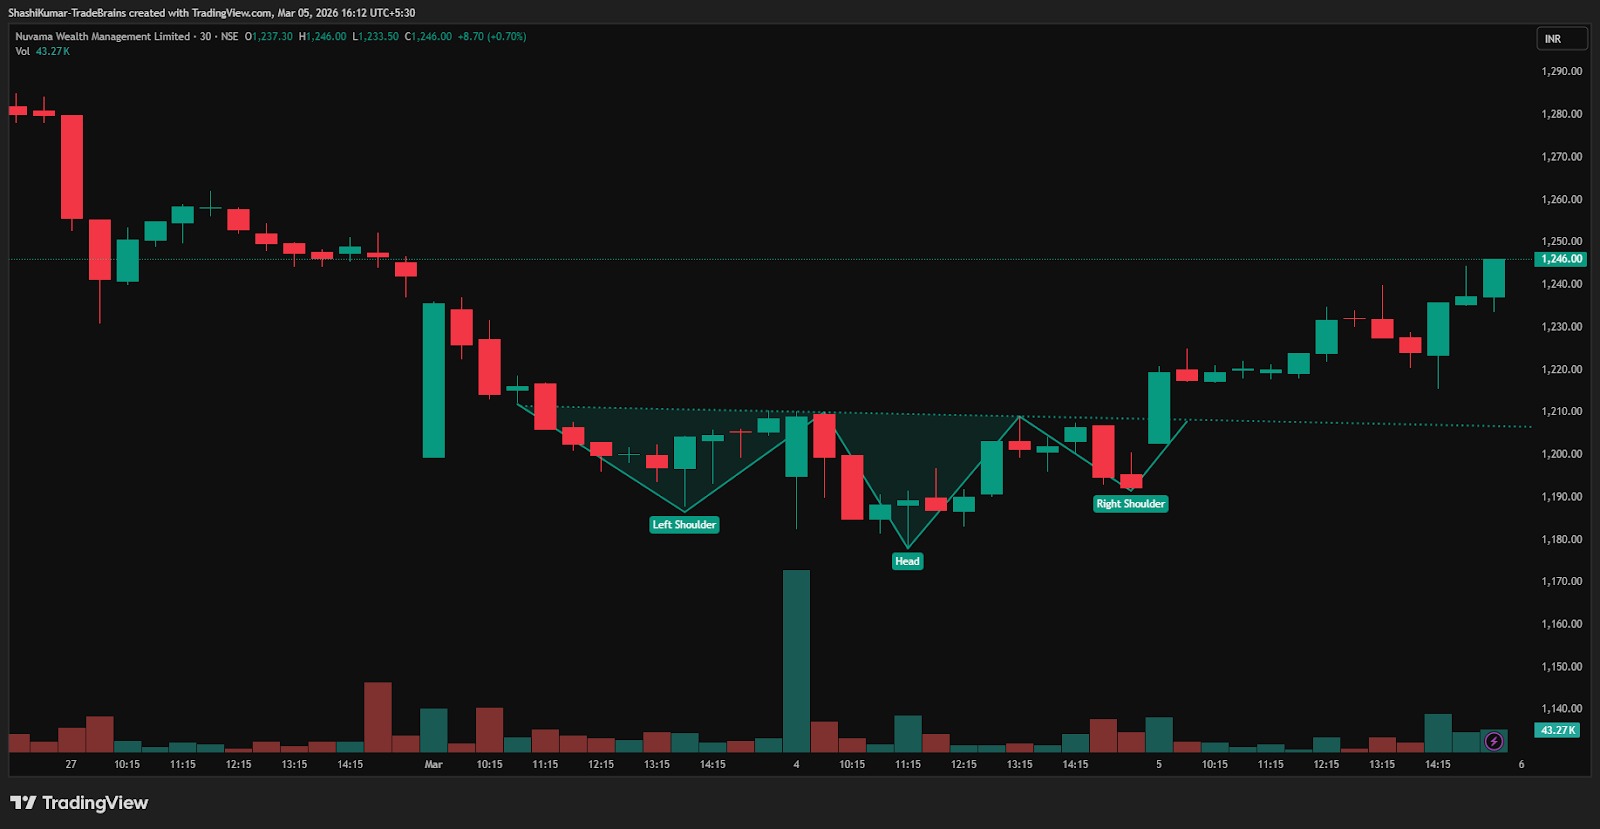
Nuvama Wealth Management Ltd Chart: 30-min Timeframe
Indicator Confirmation
- RSI: The daily RSI indicates bullish momentum, as it rose from 31.7 in the previous trading session to 40.1 on Thursday, confirming the bullish reversal.
- Price Volume Trend: The Price Volume Indicator confirms the uptrend, accompanied by a sharp increase in buying volume in the daily time frame.
Implications
The inverted head-and-shoulders pattern signals possible upside. Sustaining above the Rs 1,210 support level, supported by strong volumes, would strengthen near-term bullish momentum.
About the stock
Nuvama Wealth Management Limited is an Indian financial services firm operating an integrated, full-stack platform across the wealth lifecycle. It follows a “One Nuvama” multi-segment model encompassing wealth management, asset management, asset services, and capital markets. The company serves a diverse client base, including UHNI, HNI, and institutional investors, while leveraging technology and research to drive growth in India’s expanding wealth management ecosystem.

Over the past month, Nuvama Wealth Management Ltd has fallen 9.9%. In the last six months, the stock declined 4.52%, but it remains up 16.07% compared to a year ago.
Disclaimer: The views and investment tips expressed by investment experts/broking houses/rating agencies on tradebrains.in are their own, and not that of the website or its management. Investing in equities poses a risk of financial losses. Investors must therefore exercise due caution while investing or trading in stocks. Trade Brains Technologies Private Limited or the author are not liable for any losses caused as a result of the decision based on this article. Please consult your investment advisor before investing. For more such technical stock ideas, click here to view our research page.