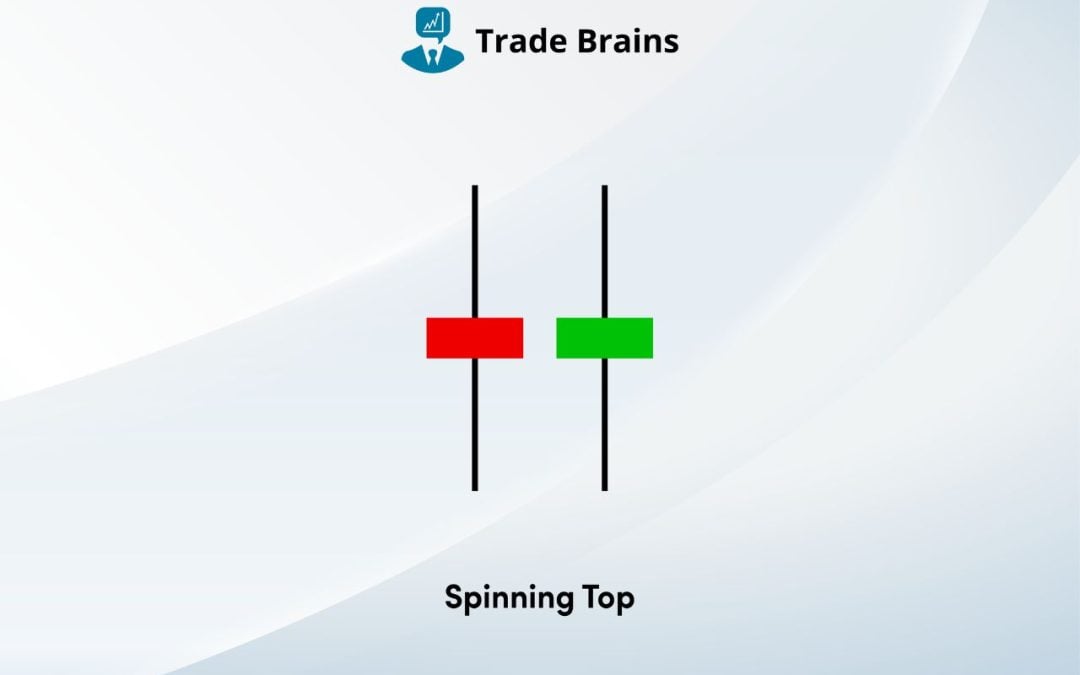
Understanding the significance of candlestick patterns for technical analysis is crucial since they provide valuable insights into the price movements of securities. We will explore the significance, psychology, and trading approaches associated with the spinning top...
Candlestick patterns are the key technical tool for traders to understand price movements. The patterns formed on candlestick charts over a given time frame offer potential views on trend reversals, continuations, or indecision present in the market. In this article,...
Understanding the significance of candlestick patterns for technical analysis is crucial since they provide valuable insights into the price movements of securities. We will explore the significance, development, and trading approaches associated with the bearish...
In the changing realm of trading, it is essential to gain expertise in efficient strategies to achieve success. A strategy that has become popular for its simplicity and potential profitability is the Bearish Three Line Strike candlestick pattern. This article aims to...
Three Outside Down Candlestick Pattern: Candlestick patterns are a fundamental tool in technical analysis, used by traders to predict future price movements based on historical data. Among the various candlestick patterns present, the “Three Outside Down”...
Upside Tasuki Gap Candlestick Pattern: Traders rely on technical analysis to predict the future movement of the price in the stock to earn profits. The technical analysis comprises multiple methods from candlestick patterns and chart patterns to indicators....
Search Topic or Keyword
Easiest Stock Screener Tool!
Best stock discovery tool with +130 filters, built for fundamental analysis. Profitability, Growth, Valuation, Liquidity, and many more filters. Search Stocks Industry-wise, Export Data For Offline Analysis, Customizable Filters.