Synopsis: Nifty 50 stocks like HDFC Bank, HDFC Life Insurance Co, TCS, Bajaj Finserv, SBI Life Insurance Co, Adani Enterprises, SBI, ITC, and Kotak Bank are trading in the RSI below 30 and the oversold zone. The Relative Strength Index (RSI) is a widely used momentum...
Synopsis: Top 10 companies, including Indian Energy Exchange, BPCL, REC, ITC, Gillette India, and others, are set to trade ex-dividend in the coming week, making it a key period for income-focused investors. A dividend is a share of a company’s profits paid to...
Synopsis: From TATA to Adani, India in calendar year 2025 saw a number of mergers and demergers, this list includes some companies which have witnessed a net profit growth upto 2065 percent. There are several types of corporate restructuring out of this two major...
Synopsis: SBI Mutual Fund is one of India’s leading asset management companies. In this article, let’s take a look at the top 10 stock holdings and changes in SBI Mutual Fund as of November, which include HDFC, Reliance, ICICI, Airtel, and others. SBI Mutual Fund was...
In 2025, several major Indian corporations undertook strategic demergers to streamline operations, unlock shareholder value, and focus on core business areas. These corporate restructurings allowed companies to create specialised entities, enabling greater operational...
Beta is a measure that shows how much a stock moves compared to the overall market. A beta of 1 means the stock usually follows the market trend. A beta below 1 indicates the stock is less volatile, while a beta above 1 means it is more volatile. Fundamentally strong...
Synopsis: Indian businesses are increasingly exposed to risks from rapidly evolving regulations in addition to market fluctuations. Stricter laws and global influences can impact even well-established companies. Regulations in India are changing quickly, and many...
Over the past 25 years, some Nifty 50 stocks have delivered massive returns, turning small investments into large wealth. This article looks at five top-performing companies that have grown up to 18,888 percent, showing the power of long-term investing in the stock...
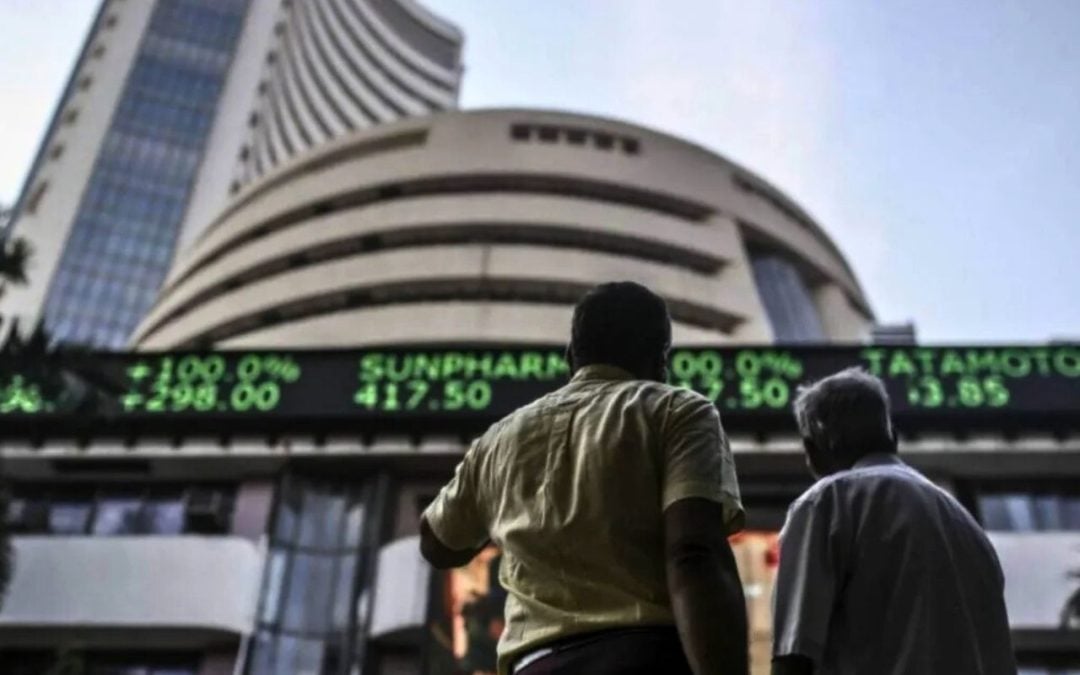
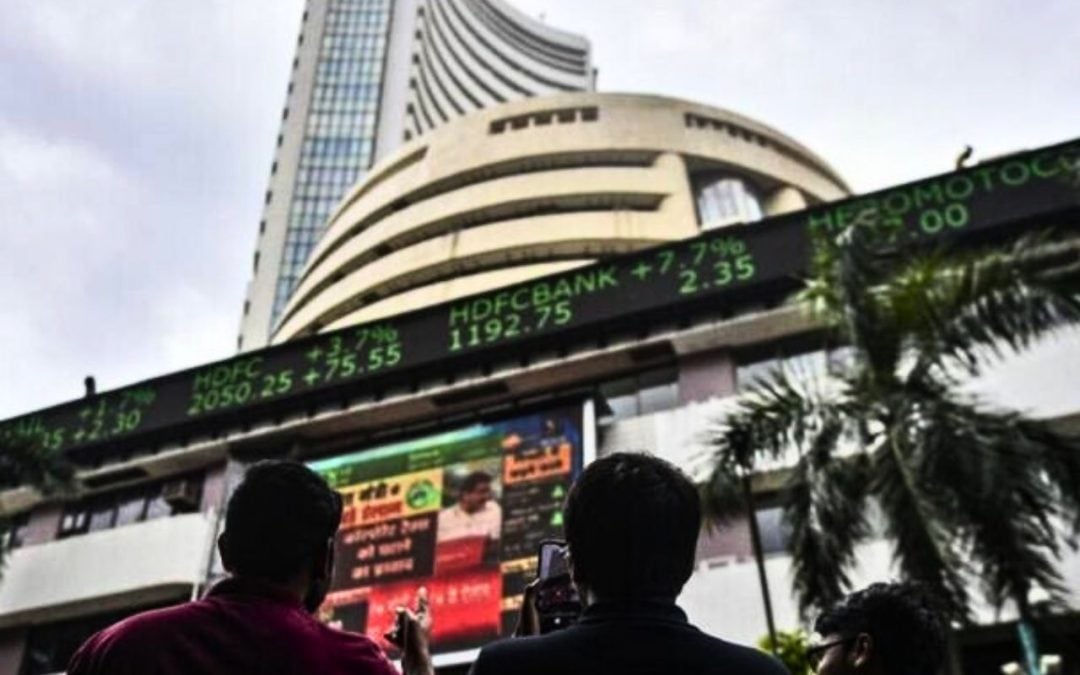
The Benchmark Indices traded negatively during Friday’s trading session, with the Sensex decreasing by 0.88 percent, closing at 81,463.09. Similarly, the Nifty 50 index has fallen by 0.9 percent, and closed in the red at 24,837. Over the previous five trading...