Ladder Bottom Candlestick Pattern: It is crucial to understand candlestick patterns for technical analysis because they provide insight into the price movements of securities. We will explore the significance, creation, and trading techniques associated with the...
Bearish Tri-Star Candlestick Pattern: In the world of technical analysis, candlestick patterns play a pivotal role in helping traders predict future price movements of securities. Each pattern contains significant information about the market’s direction. Among...
Down Gap Side-By-Side Pattern: Candlestick patterns are the key technical tool for traders to understand price movements. The patterns formed on candlestick charts over a given time frame offer potential views on trend reversals, continuations, or indecision present...
Up Gap Side-By-Side Pattern: In the world of the stock market, every movement in price is due to a reason and every movement gives an indication. There are few candlestick patterns which when formed give a certain indication of future movement. These candlestick...
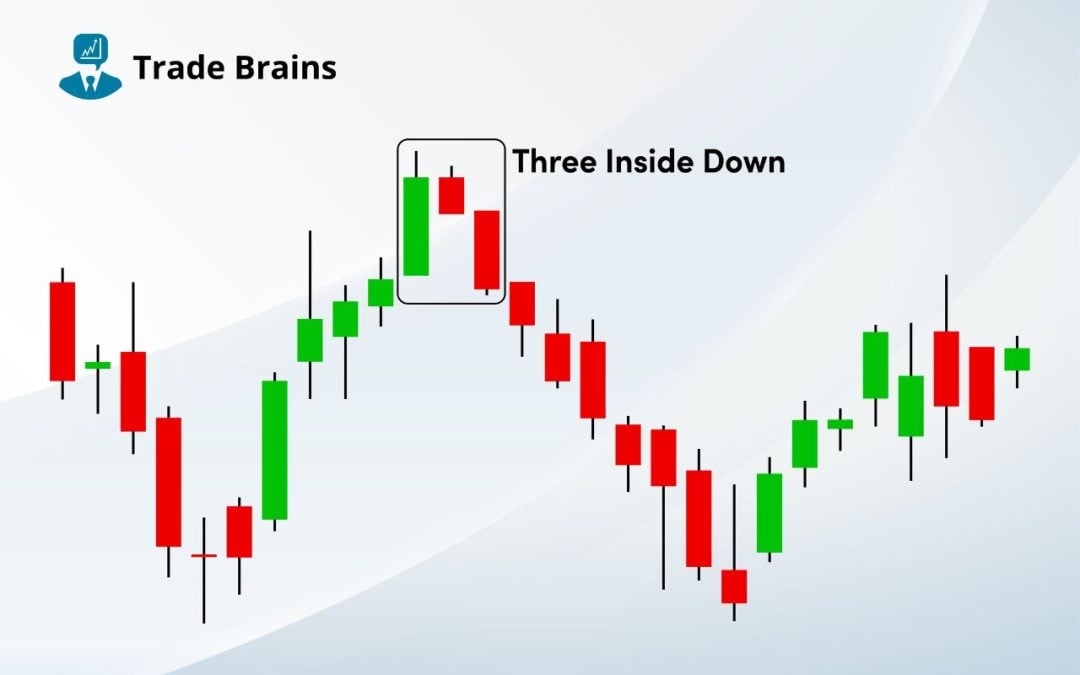
Three Inside Down Candlestick Pattern: In the world of technical analysis, candlestick patterns play a pivotal role in helping traders predict future price movements of securities. One such significant multiple candlestick pattern is the “Three Inside...
Bullish Tri-Star Candlestick Pattern: Technical analysts use chart and candlestick patterns to judge stock prices and forecast future trends. Each pattern contains significant information about the market’s direction. By examining and understanding these...
Three Outside Up Candlestick Pattern: In the world of technical analysis, candlestick patterns serve as invaluable tools for traders, offering insights into market sentiment and potential price movements. Among the myriad of patterns, the Three Outside Up stands out...
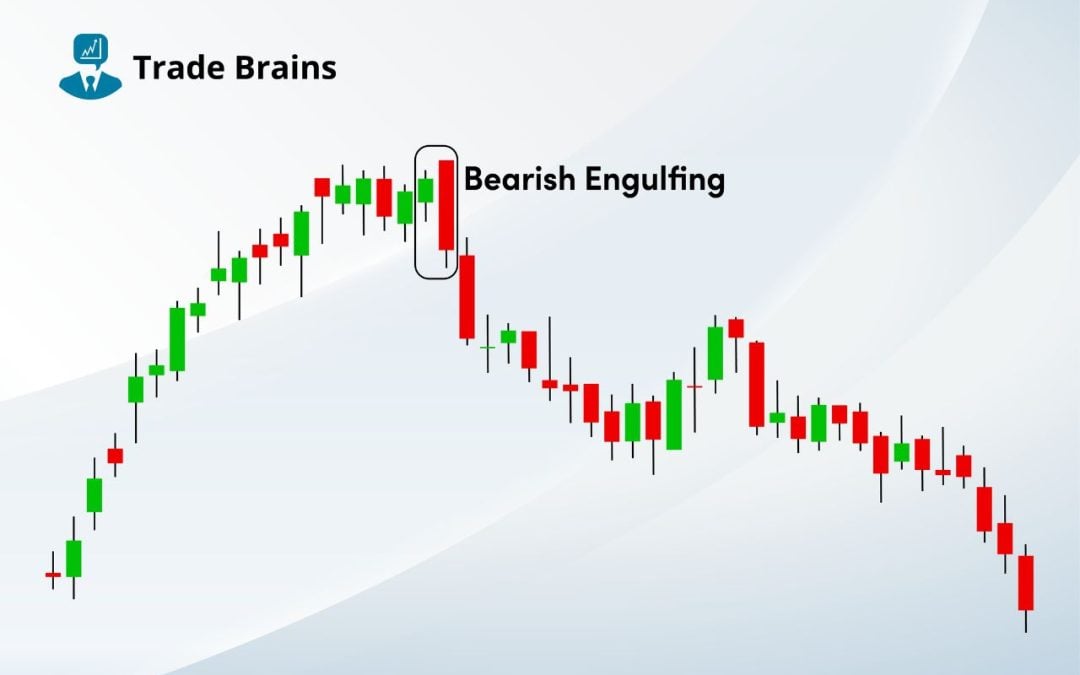
Bearish Engulfing Candlestick Pattern: Technical analysts rely heavily on chart and candlestick patterns to conduct comprehensive analyses of stock prices and accurately predict their future movements. Each pattern formed in the market has a clear and justified reason...
Bearish Harami Candlestick Pattern: Technical analysis is a method for forecasting future price movements using previous market data, with a primary focus on price and volume. Candlestick patterns stand out as visual representations of price activity over a set span....
Bearish Harami Cross Candlestick Pattern: Traders rely on technical analysis to analyze and predict the future movement of the price in the market. Candlestick patterns are a part of technical analysis preferred by traders to understand and predict the future price...
Best stock discovery tool with +130 filters, built for fundamental analysis. Profitability, Growth, Valuation, Liquidity, and many more filters. Search Stocks Industry-wise, Export Data For Offline Analysis, Customizable Filters.