

Tata Motors Stock Study & Analysis: Tata Motors stocks have given a return of over 390% from March 2020 to Feb 2021 (till date). In fact, currently, Tata motors stocks are being considered more popular than Tesla in terms of returns. Nevertheless, looking at just the share price is the dumbest strategy while evaluating a company.

In this post, we’ll look into the fundamentals of TATA Motors focusing on both qualitative and quantitative aspects. Here, we’ll perform the SWOT Analysis of Tata Motors, Michael Porter’s 5 Force Analysis of Tata Motors, followed by looking into Tata Motors’ key financials. Let’s get started.
Disclaimer: This article is only for informational purposes and should not be considered any kind of advisory/advice. Please perform your independent analysis before investing in stocks, or take the help of your investment advisor. The data is collected from Trade Brains Portal.
Tata Motors Stock Study – About & Business Model
Incorporated in the year 1945 as TATA Engineering and Locomotive Company (TELCO), TATA Motors used to manufacture locomotive steam engines and other engineering products. It joined hands with Daimler Benz AG in 1954 to manufacture commercial vehicles which ended in 1969.

Understanding the technological trend, the company eventually discontinued this segment and set its foot into the commercial vehicle segment independently in 1977 in Pune. Currently, the company is a market leader in the commercial vehicle segment in India with a share of over 37%. TATA Motors entered the Passenger Vehicle segment in 1991 with the launch of TATA Sierra, and in 1998 Auto Expo, the company wrote history by launching TATA Indica which became the number one car in the respective segment within the next two years.
In 2008, the company acquired the Jaguar Land Rover segment from Ford Motors to enter foreign markets completely. Currently, the company has manufacturing and R&D facilities in the leading economies of the world viz. China, the UK, the USA, South Korea, etc. The Product Range of the company includes:

- Passenger Cars
- Utility Vehicles
- Trucks
- Commercial Passenger Vehicles
- Luxury Cars
- Defense Vehicles
Tata Motors’ Industry Analysis
By selling 3.99 million units of the vehicle in 2019, India surpassed Germany to become the 4th largest auto market of the world, and it is expected that by 2021, India will become the third-largest auto market displacing Japan. In the last four years, domestic automobile production has witnessed a growth of CAGR 2.36% with 26.36 million vehicles being manufactured and a 1.29% CAGR sales growth.
Considering Auto Industry as a whole, two-wheelers dominate the industry by 80.8%, followed by passenger vehicles at 12.9%. Mid seized and small cars grab maximum sales in the PV category.
According to the Society of Indian Automobile Manufacturers, PV wholesales in India saw a 26.45% YoY growth in September 2020. Automobile Export has grown with a CAGR of 6.94% during FY16-20, with the export of 4.77 million.

EV sales in India witnessed a 20% growth in FY20 with sales of 1.56 lakh units. And the EV industry in India is expected to be of Rs 50,000 crore by 2025.
The Indian Automobile industry is favored by several factors like cheap skilled labor, great R&D centers, and low-cost steel production. By 2026, the industry is expected to reach 16.16 -18.18 trillion Rs.
Tata Motors’ Michael Porter’s 5 Force Analysis
1. Rivalry Amongst Competitors
- Auto Industry of any nation faces a stiff competition, that is why companies have to be price efficient and come up with new technologically advanced cars and features. The industry is very large and the exit cost is also very high as a lot of asset investment is being done, which intensifies the competition. Also, be it any range of car price, companies have to deeply focus on R&D.
2. A Threat by Substitutes
- With the increasing fuel prices and online booking of tickets, people find cabs and other modes of transport as a substitute to a personal vehicle. Moreover, they do not have to spend on maintenance too. Still, owning a personal four-wheeler is a sign of prestige and convenience for the most.
- In the commercial vehicle segment, road transport is still very much dominated (59%) as it can be connected to the mountains and to sea shores unlike trains, which makes substitutes for commercial vehicle highly unfavorable.
3. Barriers to Entry
- Auto Industry requires continuous innovation, proper raw materials, skilled labor and huge initial capital investment which makes it very difficult for new entrants to step their foot in this industry.
- Other barriers are government policies which have become very strict in the recent period especially focusing on environmental safety and high import taxation.
4. Bargaining Power of Suppliers
- In Auto Industry, the bargaining power of supplier depends on the size of the supplier as few small suppliers are totally dependent on few auto players, so they have to play according to the rules and regulations set by the vehicle companies, and switching from one supplier to another is very easy for big players.
5. Bargaining Power of Customers
- Customers are very price-sensitive and would switch to other brands that offer a better car at the cheapest price as there is no switching cost involved in this industry. So, customers enjoy a high bargaining power in the auto industry. However, companies try to increase customer loyalty by offering better quality and post service.
Tata Motors’ SWOT Analysis
1. Strengths
- TATA Motors has a well-diversified portfolio of vehicles which includes right from economical passenger vehicles to luxury cars and the penetration of TATA Motors into the commercial vehicle segment is also very impressive. It creates a brand royalty for the company.
2. Weaknesses
- The revenue of Tata Motors is heavily dependent on the JLR segment, which can hit the business and profitability if a slowdown occurs in this segment. In 2019 such situations occurred for the company when there was a massive decline in demand for JLR in Chinese and European markets and the rest was fueled by the pandemic in 2020.
3. Opportunities
- With the advent of Electric Vehicles in India and other nations, TATA motors can take the advantage of its innovative legacy to increase its market share in the EV segment. Its sister companies like TATA Power can create the entire EV environment by installing more charging stations.
- With the economy coming on track and industries coming out of recession, the purchasing power of people is expected to increase which TATA Motors can use to increase their revenues and market share in the PV segment.
4. Threats
- The government’s increasing concern for the environment has posed various threats for the company as various policies (BS-VI) have been implemented in the past to reduce pollution which has caused an overall slowdown in the industry.
- International issues like Brexit, Chinese Economy Slowdown, US import tariff, trade wars, and pandemic can severely affect the company in the future as it has also done in recent years.
- With the advent of foreign PV companies like MG, Kia in India, the market share of existing companies will shrink severely and TATA Motors will be the one among them.
Tata Motors’ Management Study
Mr. N Chandrasekaran, the same personality who joined TCS in 2008 and made it India’s biggest company in 2018, is the Chairman and Non-Executive Director of the company. In the annual report of FY20, he has assured the shareholders that he will make the company debt-free in the next three years and since then the price of the stock did not look back.
In Feb 2021, Tata Motors announced the appointment of new CEO. Tata Motors’ new chief executive and managing director Marc Llistosella will take over the company’s India business. Llistosella’s experience in India, as the head of Daimler India Commercial Vehicles Ltd, will help Tata Motors increase its selling volumes in the premium vehicles.
One study shows that TATA only acquires those companies which have management structure similar to that of its own. Management has shown their concern for minority shareholders and the foundation was led by the respected Ratan Tata.
Tata Motors’ Financial Analysis
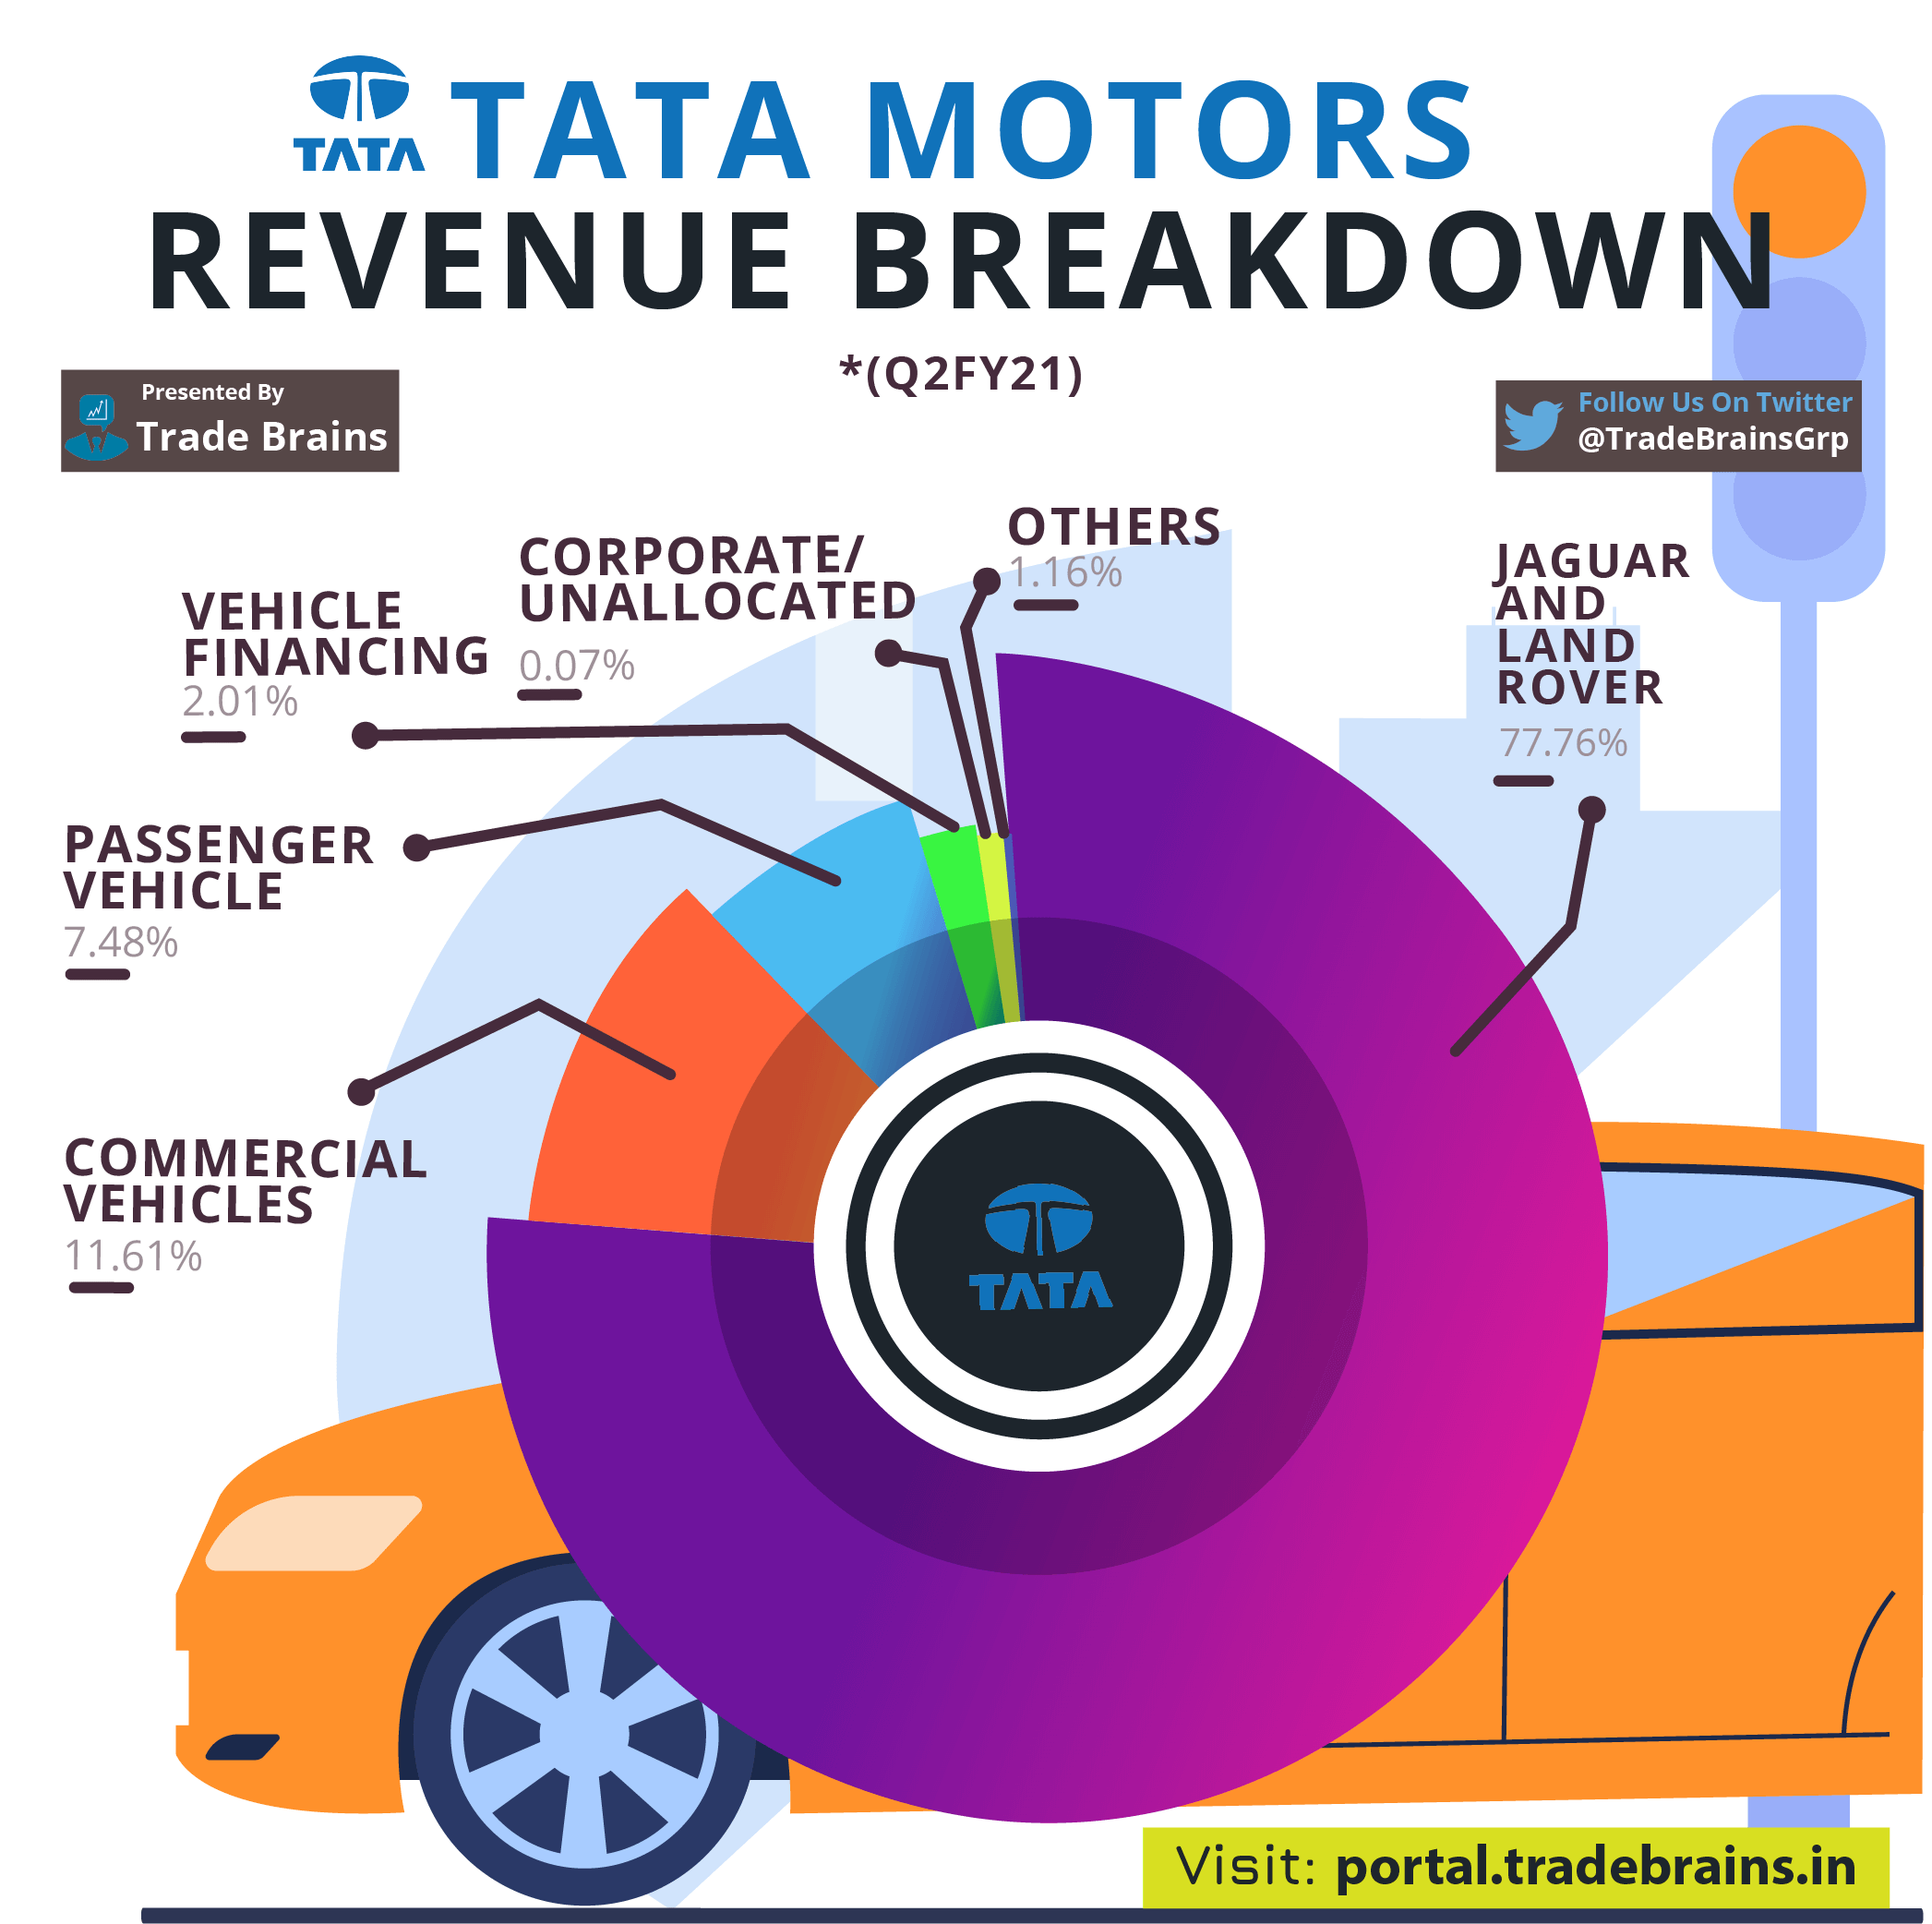
- JLR segment contributes 77.76% of the company’s revenues majorly coming from China, Europe, and the USA.
- 19.09% of the total revenue constitutes of TATA Motors Standalone business out of which 11.61% is from Commercial Vehicle segment and 7.48% is from Passenger Vehicle segment. Recently, with the launch of new passenger vehicles, TATA Motors has succeeded in increasing its market share in the PV segment.
- TATA Motors incurs around 2.01% of the total revenue from vehicle financing under the name TATA Motors Finance Limited (TMFL).
- As of 2019-20, TATA Motors dominate the CV market share by 44.41% share coming out as a leader, followed by M&M (24.68%), Ashok Leyland (18.37%), and Eicher Motors (6.13%). Tata Motors has been continuously increasing its market share in the CV and PV segment for the last few years mainly due to the launching of new vehicles.
- With the recent operational and leverage inefficiency, the NPM has dipped to -4.2 in FY20 making TATA Motors a loss-making company for two consecutive years. The fall is mainly due to the roller coaster commodity prices and disruption in sales.
- Total Borrowing of the company has increased by Rs 12,498.12 Cr. (Rs 70,817.50 Cr. in FY19 to Rs 83,315.62 Cr. in FY20)
- The net cash flow position for the company is in the negative region for the last few fiscal years. Although in FY19 it reported a net cash flow of Rs 8010.03 Cr., this was led by increasing huge long term and short-term debt (financing cash flow).
| PARTICULAR | 2016 | 2017 | 2018 | 2019 | 2020 |
|---|---|---|---|---|---|
| Cash From Investing Activities | -37504.43 | -38079.88 | -26201.61 | -19711.09 | -34170.22 |
| Cash From Operating Activities | 37899.54 | 30199.25 | 23857.42 | 18890.75 | 26632.94 |
| Cash From Financial Activities | -3795.12 | 6205.3 | 2011.71 | 8830.37 | 3389.61 |
| Net Cash Flow | -3400.01 | -1675.33 | -332.48 | 8010.03 | -4147.67 |
Tata Motors’ Financial Ratios Analysis
A. Profitability Ratios
- EBITDA Margin has continuously fallen from 13.21% in FY16 to 6.78% in FY20 reaching almost lowest in the industry, which is an alarming sign for the company.
- RoE for the company in FY 2016 was 16.42% but it slumped to -37.19% in FY 2019, mainly due to profitability getting severely hit because of disruptions in sales and increasing leverage. Although the current figure has shown improvement from the previous fiscal year, it is still at a fatal level of -17.94%.
- Trend in RoCE has been more or less same as that of RoE, from the level of 16.42% in FY16 to mere critical -37.19% in FY19. The current RoCE for FY 20 stands at -1.92%.

B. Leverage Ratios
- Current Ratio for the FY20 is 0.85% for the company. Although it has not shown any improvement, it has not deteriorated either since FY 2019. However, the current level is below the threshold level.
- With a debt of around Rs1.1 Lakh crore, Tata Motors is a debt laden company and debt to equity ratio has been rising continuously for a lot of quarters, and at present, it is at an alarming level of 1.91.

- Quick Ratio has always been a headache for the company. Being 0.72 in FY 16, it has fallen to 0.58 in the present fiscal year. Issues in the profitability and increasing leverage has dangerously affected the liquidity levels of the company.
- The Interest Coverage Ratio is at a dangerous level of -0.46, which shows the inefficiency of the company in fetching EBIT income and deterioration in solvency levels of the company.
C. Efficiency Ratios
- Currently, the asset turnover ratio for the company is 0.84, which is down from the previous year by 0.14 points.
- Inventory turnover Ratio has seen a continuous fall since FY16 (8.97) without a single rise in between, currently at 6.83. Evident from the rise in inventory days to 53.46.
- The number of receivable days has increased (17.19% in FY16 to 21.09% in FY20) and number of payable days has decreased (81.53% in FY16 to 94.20% in FY20), indicating that both the buyers’ and suppliers’ bargaining power has increased.
Tata Motors’s Shareholding Pattern
- For the last 5 quarters promoter’s holding in TATA Motors has been at the same level of 42.39%. Also, 3.95% of the promoters’ share are pledged, which has not changed for the same period.
- FIIs hold 15.61% of shares of the company as of December 2020 which is more or less same since June 2020 Quarter.
- DIIs own nearly 12.71% shares of the company which was around 15% a year back.
- From 24.245 in December 2019 to 29.27% in December 2020, public holding has surged.
| Particular | Dec-19 | Mar-20 | Jun-20 | Sep-20 | Dec-20 |
|---|---|---|---|---|---|
| Promoters | 42.39 | 42.39 | 42.39 | 42.39 | 42.39 |
| Shareholding Pledge | 3.95 | 3.95 | 3.95 | 3.95 | 3.95 |
| Public | 13.7 | 16.8 | 18.21 | 18.1 | 17.81 |
| FII | 18.32 | 16.84 | 15.62 | 15.84 | 15.61 |
| Total DII | 15.05 | 13.58 | 13.39 | 13.22 | 12.73 |
| Others | 10.54 | 10.39 | 10.39 | 10.45 | 11.46 |
Closing Thoughts
In this post, we tried to perform a quick Tata Motors Stock Study. Although there are still many other prospects to look into, however, this guide would have given you a basic idea of Tata Motors Stocks. Do let us know what you think of Tata Motors stocks as an investment opportunity in the automobile industry by commenting below.
That’s all for today’s article. We hope it was useful for you. We’ll be back tomorrow with another interesting market news and analysis. Till then, Take care and Happy investing!


