

![]()
![]()
On Tuesday, Indian equity markets reflected a cautiously optimistic sentiment, with benchmark indices continuing their upward momentum. The Nifty 50 and Sensex both opened higher and maintained positive territory throughout the session, buoyed by gains in technology and pharmaceutical stocks.

The broader market mood was supported by the Nifty closing above key moving averages, which typically indicates sustained bullish strength. Market participants seemed encouraged by the bounce-back in IT stocks, especially after a prolonged downtrend, signalling renewed investor interest in the sector following corporate developments like potential buybacks.

Despite the gains, the mood was not uniformly bullish. Some pockets of the market, particularly the oil & gas and realty sectors, faced selling pressure. This mixed sentiment suggests that while overall market confidence is improving, investors remain selective and cautious, preferring sectors with strong fundamentals or near-term catalysts. Global cues added a layer of indecisiveness, with Asian markets showing no clear direction and US futures trading marginally higher. The RSI levels for major indices stayed in neutral territory, implying there’s room for further movement before the market enters overbought conditions.
In this overview, we will analyse the key technical levels and trend directions for Nifty and BSE Sensex to monitor in the upcoming trading sessions. All the charts mentioned below are based on the 5-minute timeframe.
Nifty 50
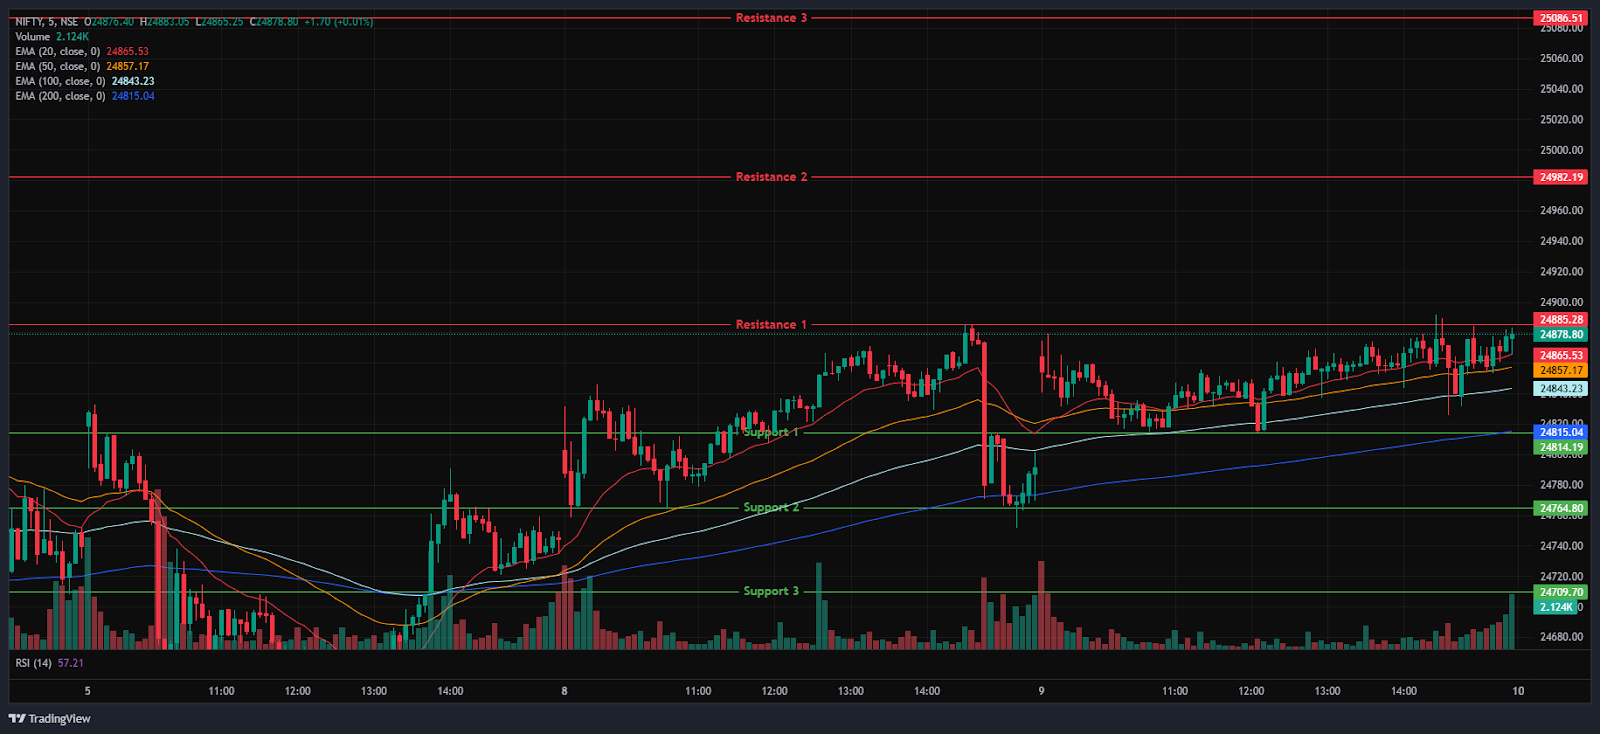
(In this analysis, we have used 20/50/100/200 EMAs, where 20 EMA (Red), 50 EMA (Orange), 100 EMA (Light Blue), and 200 EMA (Dark Blue)).
To view other technical reports, click here
The Nifty 50 Index opened on a positive note at 24,864.10 on Tuesday, up by 90.95 points from Monday’s closing of 24,773.15. In the morning session, the index started on a gap up and sustained at the 24,850 mark and traded below its opening level at 24,853. In the morning session, the Index traded in a range between 24,800 and 24,900 and was traded above all four EMAs of 20/50/100/200 in the 15-minute time frame. Later, in the afternoon session, the index further continued its momentum and surged to the 24,892 making its day high and held above the 24,860 level, trading in green.
Overall, the index ended in a positive state on the Tuesday session. During the afternoon session, the Nifty 50 was traded above all four EMAs of 20/50/100/200 in the 15-minute time frame. Nifty’s immediate resistance levels are R1 (24,886), R2 (24,982), and R3 (25,086), while immediate support levels are S1 (24,814), S2 (24,765), and S3 (24,701).
The Nifty index had reached a day’s high at 24,891.80 and saw a day’s low at 24,814.00. Finally, it had closed at 24,868.60, in green above the 24,850 level, gaining 95.45 points, or 0.39%. The Nifty 50 closed above all four EMAs of 20/50/100/200 EMAs in the daily time frame.
Momentum Indicators
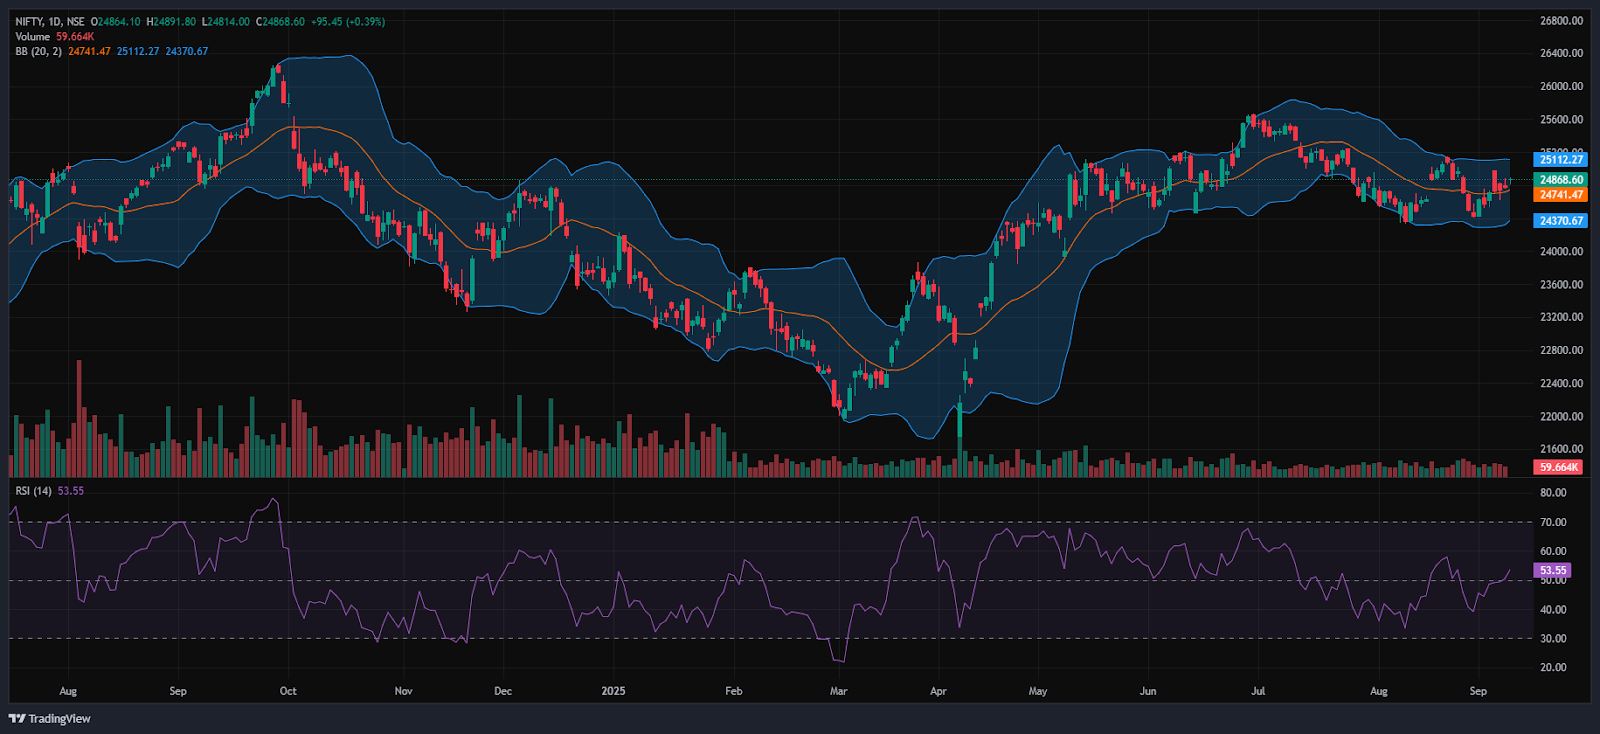
RSI (Daily): The Nifty 50’s RSI stood at 53.56, which is well below the overbought zone of 70, indicating a bullish sentiment.
Bollinger Bands (Daily): The index is still trading in the upper half of its Bollinger Band range above the middle band (Simple Moving Average). Its position in the upper range, along with solid resistance around the 24,900 level, and the Index formed an indecisive sentiment in Tuesday’s session. A sustained move above the middle band signals a bullish sentiment, while a drop back toward the lower band may reinforce bearish sentiment.
Volume Analysis: Tuesday’s trading session average volumes stood at 226.92 Mn.
Derivatives Data: Options OI indicates strong Put writing at 24,850, following 24,800, establishing it as a firm support zone. On the upside, a significant Call OI buildup at 24,900 and 25,000 suggests a potential resistance supply. PCR (Put/Call Ratio) stands at 1.1718 (>1), leaning towards bearish sentiment and the long buildup signals a potential upward move, with an overall mixed outlook for the next trading session.
Bank Nifty
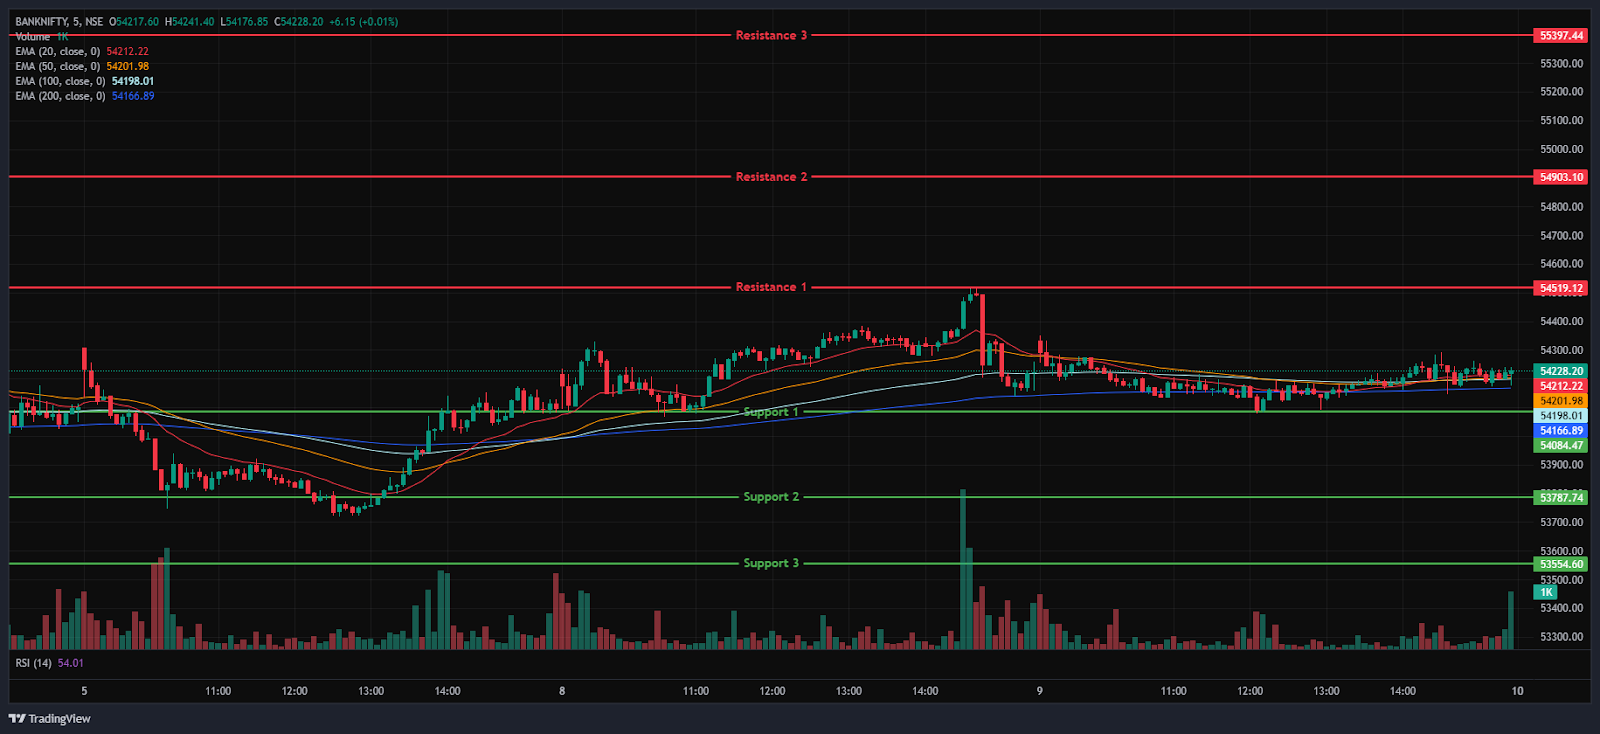
(In this analysis, we have used 20/50/100/200 EMAs, where 20 EMA (Red), 50 EMA (Orange), 100 EMA (Light Blue), and 200 EMA (Dark Blue)).
The Bank Nifty Index started the session on a positive note at 54,330.55 on Tuesday, up by 143.65 points from Monday’s closing of 54,186.90. The index began on a bullish note, surging to the 54,350 making its day high. But later the index did not sustain the 54,350 mark and was dragged down to 54,079. The Index traded below its opening level at 54,147 in the morning session. The index was traded below the EMAs of 20/50/200 but remained above the 100 EMA in the 15-minute time frame and was trading between the 54,100 and 54,350 levels in the morning session.
The Bank Nifty index rebounded and traded above the 54,200 level during the afternoon session and traded in the green. During the afternoon session, Bank Nifty closed above the EMAs of 20/50/100 but remained below the 200 EMAs in the 15-minute time frame. Bank Nifty immediate resistance levels are R1 (54,519), R2 (54,903), and R3 (55,397), while immediate support levels are S1 (54,084), S2 (53,788), and S3 (53,555).
The Bank Nifty index had peaked at 54,350.65 and made a day’s low at 54,079.45. Finally, it had closed in green at 54,216.10, breaking above the 54,200 level, gaining 29.20 points or 0.054%. The Relative Strength Index (RSI) stood at 39.68 and was near the oversold zone in the daily time frame, and Bank Nifty closed below the EMAs of 20/50/100 but remained above the 200 EMA in the daily time frame.
Sensex
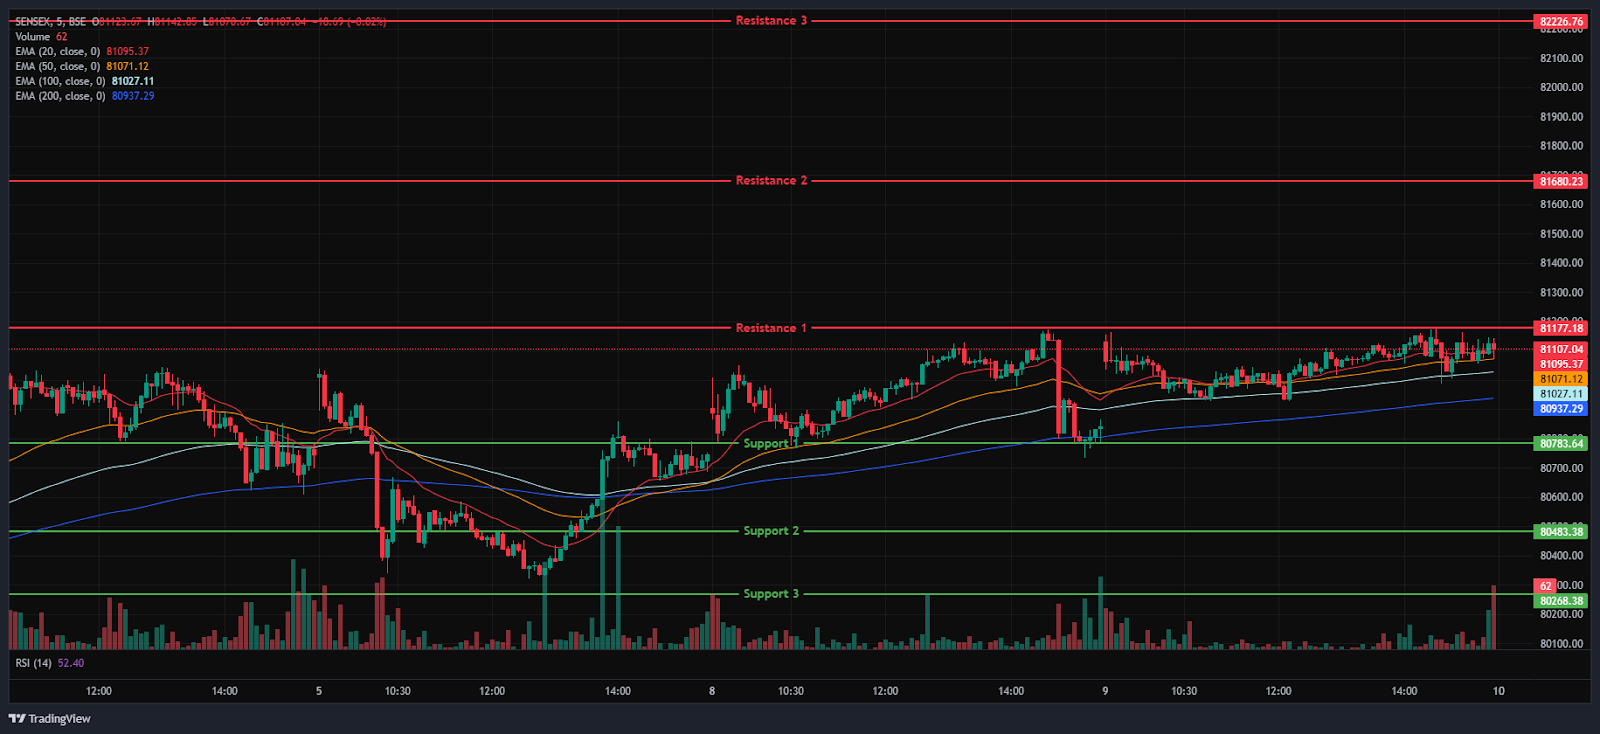
(In this analysis, we have used 20/50/100/200 EMAs, where 20 EMA (Red), 50 EMA (Orange), 100 EMA (Light Blue), and 200 EMA (Dark Blue)).
To view other technical reports, click here
The BSE Sensex Index opened on a positive note at 81,129.69 on Tuesday, up by 342.39 points from Monday’s closing of 80,787.30. The Index was bullish in the morning session; the Index surged to the 81,160 mark and was trading below its opening level in the morning session at 81,039. The Index was traded above all four EMAs of 20/50/100/200 in the 15-minute time frame and was trading between 80,950 and 81,160 in the morning session. In the afternoon session, the Sensex Index further gained its momentum and surged to 81,181.
However, the Index managed to stay above the 81,100 level during the afternoon session, maintaining its overall positive trend, and was trading above all four EMAs of 20/50/100/200 in the 15-minute time frame. BSE Sensex immediate resistance levels are R1 (81,177), R2 (81,680), and R3 (82,227), while immediate support levels are S1 (80,784), S2 (80,483), and S3 (80,268).
The BSE Sensex index had peaked at 81,181.37 and made a day’s low at 80,927.97. Finally, it had closed at 81,101.32 in green, gaining 314.02 points or 0.39%. The Relative Strength Index (RSI) stood at 51.56 (below the overbought zone of 70) in the daily time frame, and the BSE Sensex closed above the EMAs of 20/100/200 but remained below the 50 EMA in the daily time frame.
India VIX
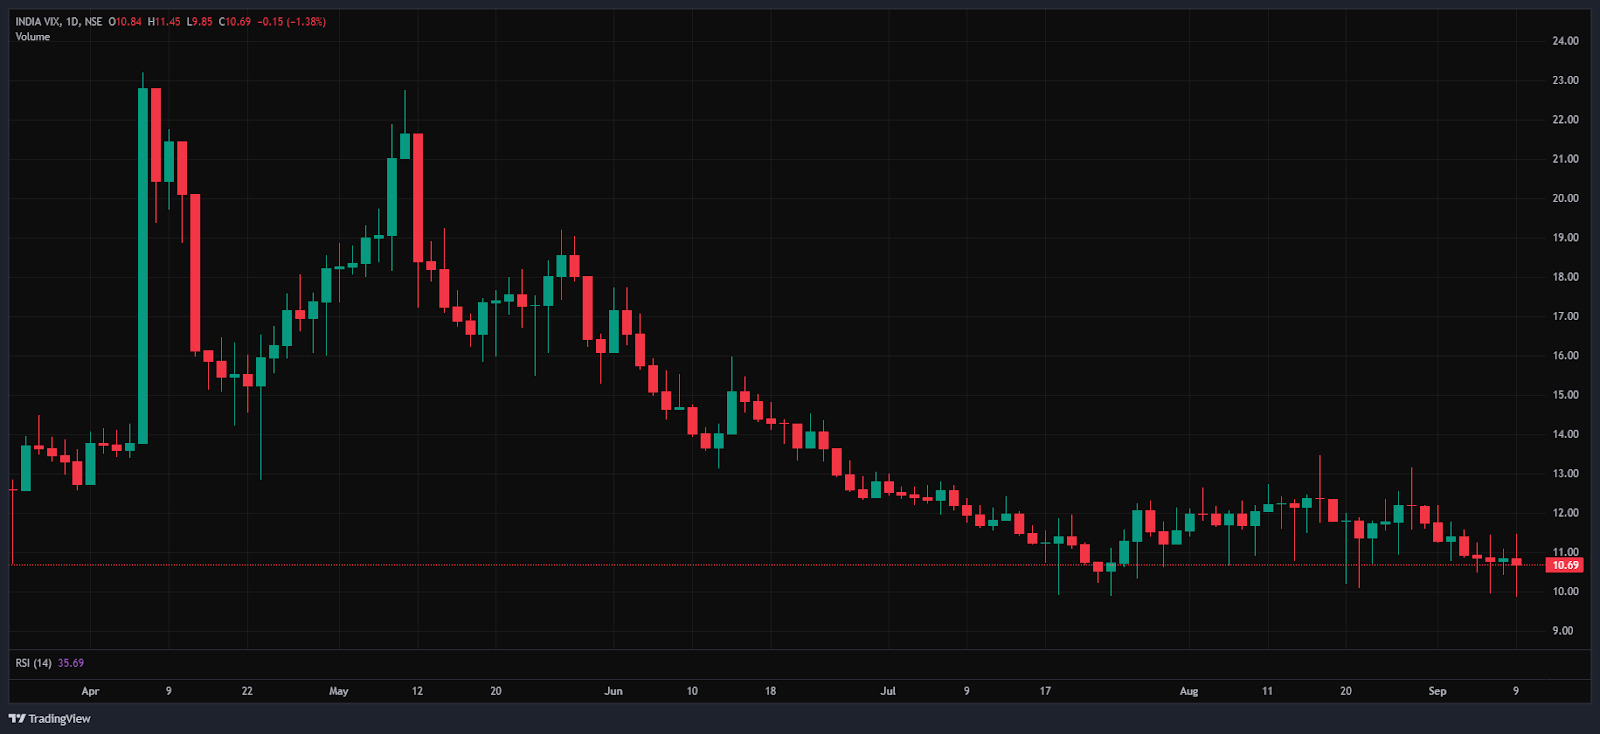
The India VIX decreased by 0.15 points or 1.41%, from 10.84 to 10.68 during Tuesday’s session. A decrease in the India VIX typically indicates lower price volatility in the stock market, suggesting a more stable market environment.
Market Recap on the 9th of September 2025
On Tuesday, the Nifty 50 opened on a positive note above the 24,850 range at 24,864, rising 90.95 points from its previous close of 24,773.15. It hit an intraday high of 24,891.8 and closed the day at 24,868.6, gaining 95.45 points, or 0.39%. It finished above all four of the 20/50/100/200-day EMAs in the daily time frame. The BSE Sensex followed a similar trajectory, opening at 81,129.69, increasing 342.39 points from its previous close of 80,787.30.
The index ended the day at 81,101.32, gaining 314.02 points or 0.39%. In terms of momentum, the Nifty 50’s Relative Strength Index (RSI) stood at 53.55, while the Sensex RSI was at 51.56, both remaining below the overbought threshold of 70. The Bank Nifty Index also followed the slightly positive trend and ended in green, rising 29.20 points, or 0.05%, to close at 54,216.
Among the major gainers, the Nifty IT Index was the top gainer, closing at 35,255.9, up by 945.45 points, or 2.76%, breaking the five-day losing streak. Shares of Infosys Ltd led the gains with a 5% increase as the board considered the buyback of shares. Other tech stocks, including Wipro Ltd, Tech Mahindra Ltd, Persistent Systems Ltd, and Mphasis Ltd, gained up to 2.7%.
The Nifty Pharma Index followed the gains, closing at 22,052.65, up by 187.45 points, or 0.86%. Dr Reddy’s Laboratories Ltd was the biggest gainer, increasing by 3.3%, followed by Glenmark Pharmaceuticals Ltd, which also gained 3.1%, and Zydus Lifesciences Ltd, up 2.6%. The Nifty Healthcare Index also remains one of the top gainers, closing at 14,541.15, up by 111.15 points, or 0.77%.
The Nifty Oil & Gas index fell the most during Tuesday’s trading session among the main losers. The index closed at 10,927.95, down -32.5 points, or -0.30%. The top loser, Indraprastha Gas Ltd, fell -1.9%. Other oil & gas stocks, such as Aegis Logistics Ltd, Hindustan Petroleum Corporation Ltd, and Bharat Petroleum Corporation Ltd, also fell up to -1.0%. At 873.95, the Nifty Realty Index also ended the day lower, down -2.60 points, or -0.30%. Anant Raj Ltd, DLF Ltd, Lodha Developers Ltd, and Godrej Properties Ltd are among the biggest losers, with their shares falling up to -1.8%.
On Tuesday, Asian markets displayed a mixed trend. Hong Kong’s Hang Seng Index ended the day higher at 25,923, jumping 289.09 points, or 1.12%. Whereas, the Shanghai Composite Index closed in the red at 3,807.29, losing -19.55 points, or -0.51%. The KOSPI Index for South Korea, however, ended the day in green at 3,260.05, up 40.46 points, or 1.24%. At 43,520.00, Japan’s Nikkei 225 Index ended the day lower, down 123.81 points, or -0.28%. At 4:12 p.m. IST, the US Dow Jones Futures were up 17.96 points, or 0.04%, at 45,534.9.
Trade Setup Summary
The Nifty 50 opened on a positive note at 24,864.1 on Tuesday and ended the day in the green above the 24,850 level at 24,868.60. A break below 24,814 could trigger further selling towards 24,765, while breaking the next resistance level of 24,886 could trigger bullishness towards the 24,982 level.
Bank Nifty started the session on a positive note at 54,330.55 and ended the session in the green at 54,216.10, above the 54,200 level. A break below 54,084 could trigger further selling towards 53,788, while breaking the next resistance level of 54,519 could trigger bullishness towards the 54,903 level.
Sensex also opened on a positive note at 81,129.69 and ended in the green at 81,101.32, above the 81,100 level. A break below 80,784 could trigger further selling towards 80,483, while breaking the next resistance level of 81,177 could lead towards the 81,680 level.
Given the ongoing volatility and mixed sentiments, it’s advisable to avoid aggressive positions and wait for clear directional moves above resistance or below support. Traders should consider these key support and resistance levels when entering long or short positions following the price break from these critical levels. Additionally, traders can combine moving averages to identify more accurate entry and exit points.
Disclaimer

The views and investment tips expressed by investment experts/broking houses/rating agencies on tradebrains.in are their own, and not that of the website or its management. Investing in equities poses a risk of financial losses. Investors must therefore exercise due caution while investing or trading in stocks. Trade Brains Technologies Private Limited or the author are not liable for any losses caused as a result of the decision based on this article. Please consult your investment advisor before investing.
About: Trade Brains Portal is a stock analysis platform. Its trade name is Dailyraven Technologies Private Limited, and its SEBI-registered research analyst registration number is INH000015729.
Investments in securities are subject to market risks. Read all the related documents carefully before investing.
Registration granted by SEBI and certification from NISM in no way guarantee performance of the intermediary or provide any assurance of returns to investors.

