
On Thursday, the market opened positively but faced consistent selling pressure, closing on a negative note. Both the Nifty 50 and Sensex reversed early gains and ended lower, despite holding above key technical support levels. Sector-wise, realty and metal stocks saw buying interest, while healthcare and pharma stocks witnessed notable declines. Asian markets showed mixed reactions, with some supported by gains in tech and semiconductors, while others fell due to currency pressures and trade concerns. U.S. market sentiment was cautious ahead of extended trade negotiations, though tech stocks continued to rally.
In this overview, we will analyse the key technical levels and trend directions for Nifty and BSE Sensex to monitor in the upcoming trading sessions. All the charts mentioned below are based on the 5-minute timeframe.
Nifty 50
(In this analysis, we have used 20/50/100/200 EMAs, where 20 EMA (Red), 50 EMA (Orange), 100 EMA (Light Blue), and 200 EMA (Dark Blue)).
To view other technical reports, click here
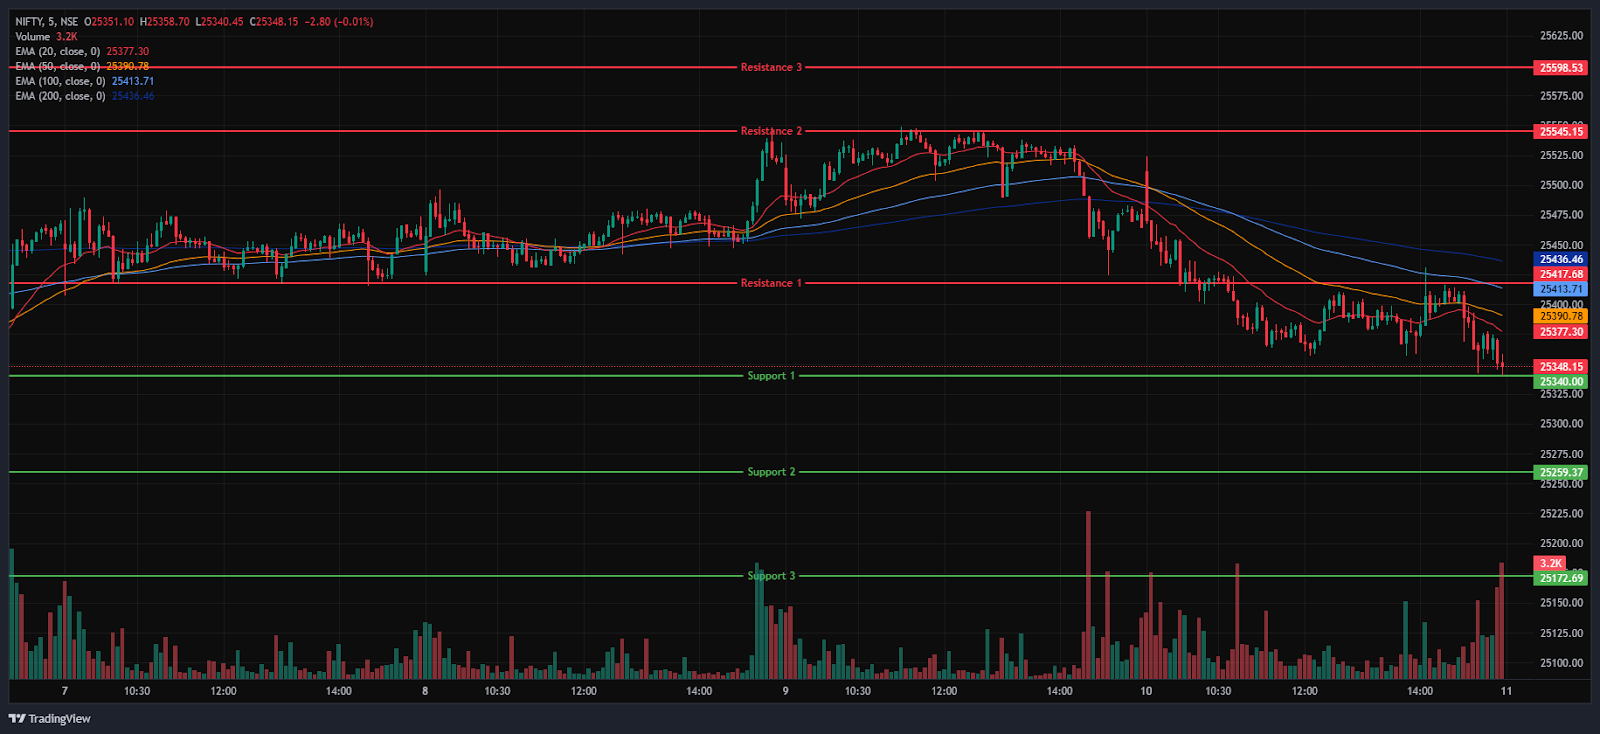
The Nifty 50 Index opened in green at 25,511.65 on Thursday, up 35.55 points from Wednesday’s closing of 25,476.10. The Nifty Index was volatile in the morning session and was trading in the range of 25,350 and 25,500. It was consolidating around the opening level of 25,390 and was below all four 20/50/100/200 EMAs in the 15-minute time frame in the morning session. In the afternoon session, the Nifty Index was volatile and dragged down, losing its momentum, and rebounded from its day’s low of 25,340.45 and closed in red at 25,355.25. During the afternoon session, it closed below all four EMAs (20/50/100/200 EMAs) in the 15-minute time frame in the afternoon session.
Nifty’s immediate resistance levels are R1 (25,417.68), R2 (25,545.15), and R3 (25,598.53) while immediate support levels are S1 (25,340), S2 (25,259.37), and S3 (25,172.69). The Nifty index had reached a day’s high at 25,524.05, closed in red below the 25,400 level, and saw a day’s low at 25,340.45. It had closed below the opening level at 25,355.25, losing -120.85 points or -0.47%. The Relative Strength Index (RSI) stood at 55.82 (below the overbought zone of 70) in the daily time frame, and Nifty 50 closed above the four 20/50/100/200 EMAs in the daily time frame.
Bank Nifty
(In this analysis, we have used 20/50/100/200 EMAs, where 20 EMA (Red), 50 EMA (Orange), 100 EMA (Light Blue), and 200 EMA (Dark Blue)).
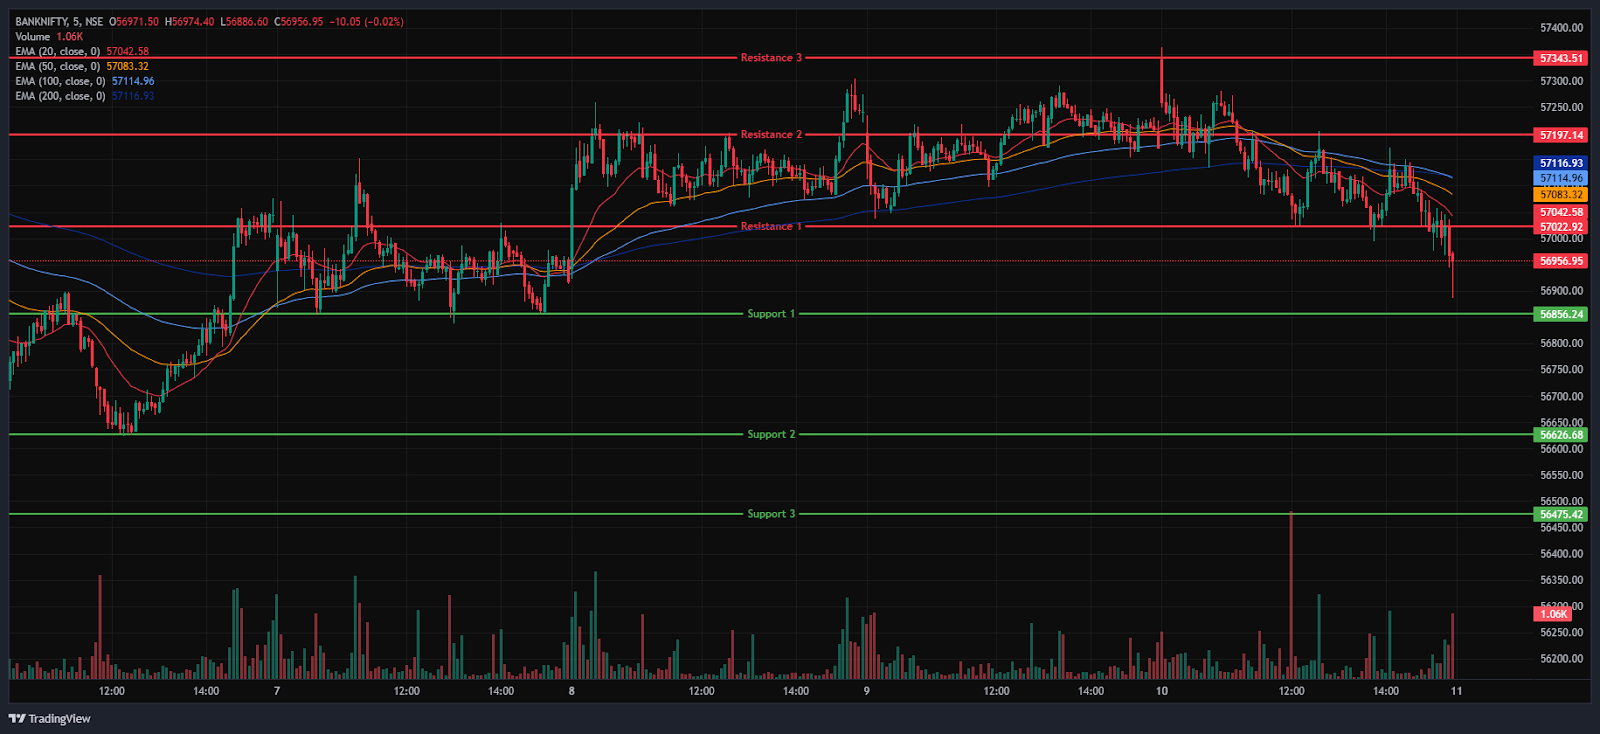
The Bank Nifty Index also followed a similar trend as the Nifty 50, opening at 57,339.75 on Thursday, up by 126.2 points from Wednesday’s closing of 57,213.55. It was trading between the range of 57,100 and 57,300 levels in the morning session and broke the 57,300 level above and rallied up and made its day’s high of 57,363.70 and was below the 20, 50, and 100 EMAs and remained above the 200 EMAs in the 15-minute time frame. In the afternoon session, the Bank Nifty dragged down below the 56,900 level and made its day’s low of 56,886.60 and closed at 56,956. During the afternoon session, it closed below all four EMAs of 20/50/100/200 in a 15-minute time frame in the afternoon session.
Bank Nifty immediate resistance levels are R1 (57,022.92), R2 (57,197.14), and R3 (57,343.51), while immediate support levels are S1 (56,856.24), S2 (56,626.68), and S3 (56,475.42). The Bank Nifty index had peaked at 57,363.70 and made a day’s low at 56,886.60. It closed in red at 56,956, losing -257.55 points or -0.45%. The Relative Strength Index (RSI) stood at 56.32 (below the overbought zone of 70) in the daily time frame, and Bank Nifty was above the four 20/50/100/200 EMAs in the daily time frame.
Sensex
(In this analysis, we have used 20/50/100/200 EMAs, where 20 EMA (Red), 50 EMA (Orange), 100 EMA (Light Blue), and 200 EMA (Dark Blue)).
To view other technical reports, click here
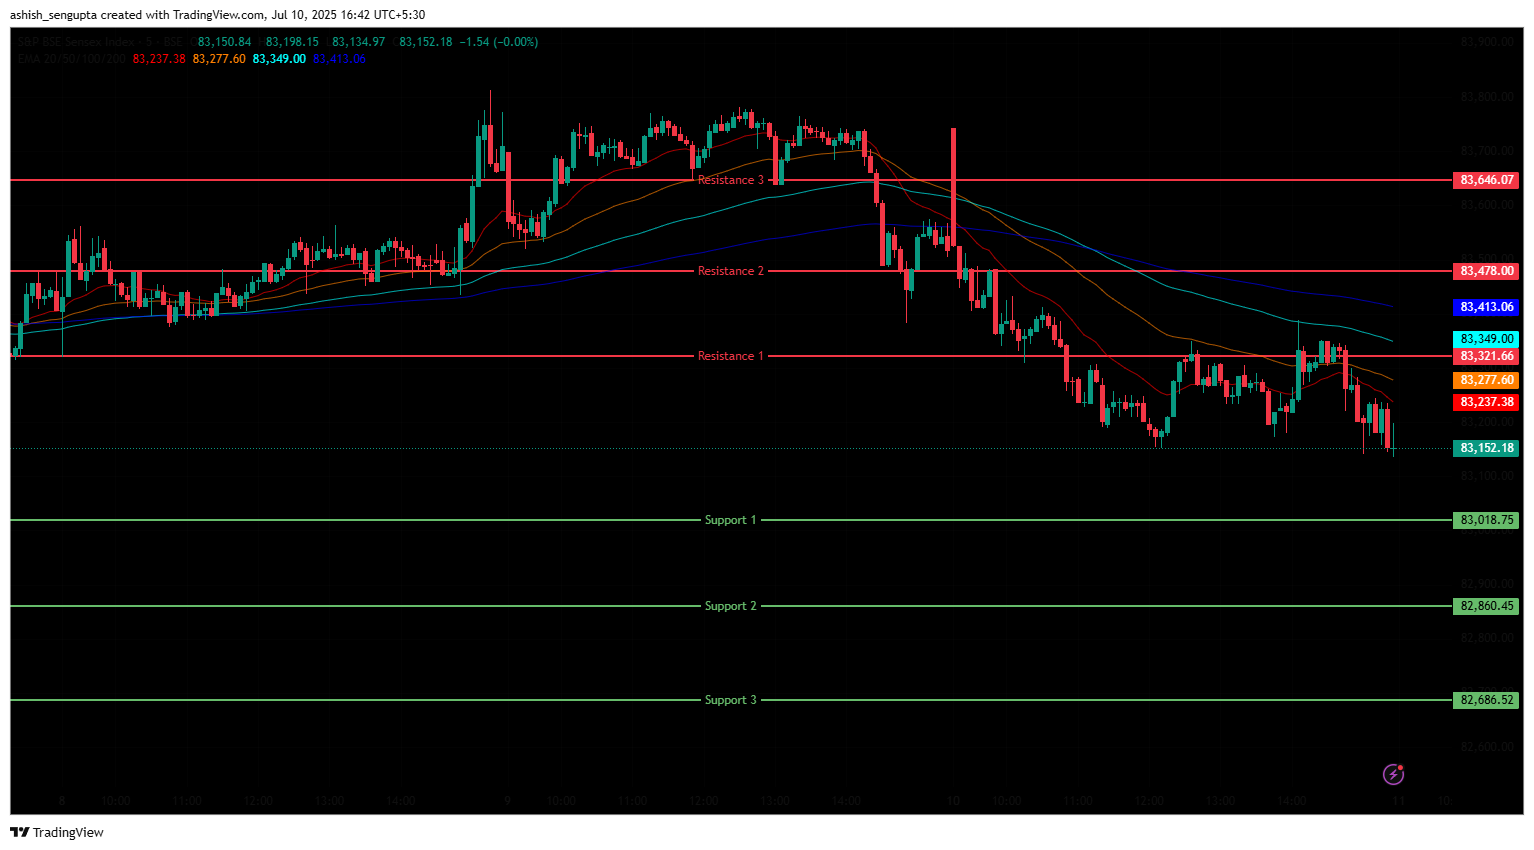
The BSE Sensex Index followed the same trend, opening on a positive note at 83,658.20 on Thursday, up by 122.12 points from Wednesday’s closing of 83,536.08. The Index was volatile in the morning session and was trading in the range of 83,250 and 83,750. It was consolidating near the opening level of 83,270.21 and was trading below all four 20/50/100/200 EMAs in the 15-minute time frame in the morning session. In the afternoon session, the Sensex Index was volatile and dragged down, losing its momentum and breaking the 83,200 mark, bouncing back from its day’s low of 83,134.97 and closing in red at 83,190.28. During the afternoon session, it traded below all four EMAs of 20/50/100/200 in the 15-minute time frame in the afternoon session.
BSE Sensex immediate resistance levels are R1 (83,321.66), R2 (83,478), and R3 (83,646.07), while immediate support levels are S1 (83,018.75), S2 (82,860.45), and S3 (82,686.52). The BSE Sensex index had peaked at 83,742.28 and finally, it closed at 83,190.28, down by -345.80 points or -0.41%. The Relative Strength Index (RSI) stood at 55.73 (slightly above the overbought zone of 70) in the daily time frame, and the BSE Sensex was above all four 20/50/100/200 EMAs in the daily time frame.
India VIX
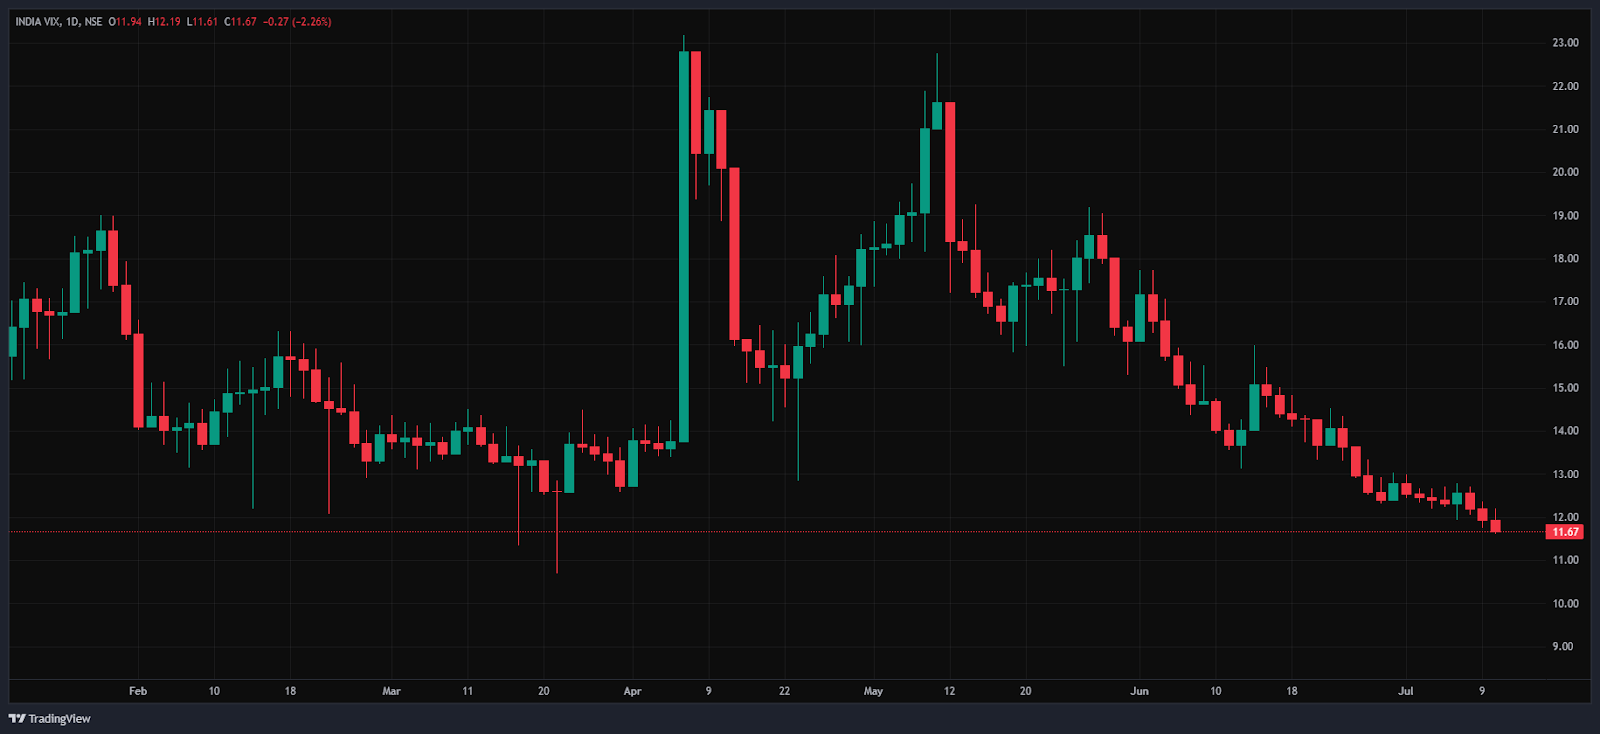
The India VIX decreased from 11.94 to 11.67 on Thursday, down by -0.27 points or -2.24%. The wide decrease in the VIX index shows reduced expected volatility.
Market Recap 10th July 2025
On Thursday, the Nifty 50 opened on a positive note but ended on a negative note. The Nifty opened at 25,511 and stayed in negative territory throughout the session, ending with a loss of 120.85 points, or 0.47%, at 25,355.25. The Relative Strength Index (RSI) stood at 55.82, comfortably below the overbought mark of 70. The index also closed above all its key moving averages of 20-, 50-, 100-, and 200-day EMAs on the daily chart. A similar trajectory was seen in the BSE Sensex, which opened at 83,658.2 and hit an intraday high of 83,742.28. It closed the day at 83,190.28, losing 345.8 points, or 0.41%, with an RSI of 55.73, and remained above all key EMAs. Today, the benchmark indices witnessed selling pressure at higher levels and the Nifty weekly expiry today was one more reason.
On the sectoral part, the Nifty Realty Index closed on a positive note, rising 7.85 points, or 0.81%, to close at 975.6. The rally was supported by gains in Anant Raj, up 2.3%; Prestige Estates, 2.1%; and Raymond Realty, 1.3%. The Nifty Metal Index also saw gains, rising 20.8 points, or 0.22%, to end at 9,405, led by Jindal Stainless, SAIL, and NMDC, gaining near 1%. On the flip side, the Nifty Health Index was one of the biggest laggards, slipping 107.2 points, or 0.74%, to settle at 14,427. Declines in Cipla, Torrent Pharma, Divis, and Apollo Hospital, each falling more than 1% weighed on the index. The Nifty Pharma Index also closed lower by 150.15 points, or 0.68%, at 22,058.
Asian markets mostly gain after a big tech rally on Wall Street. South Korea’s Kospi surged 1.58%, or 49.49 points, to 3,183.23 after the Bank of Korea kept interest rates unchanged and as semiconductor shares rose following Nvidia’s overnight rally. Japan’s Nikkei 225 fell sharply by 174.92 points, or 0.44%, to 39,646.36 as exporters’ shares fell due to a stronger yen hurting export profits and stalled Japan-U.S. tariff talks are dampening market sentiment, while the Shanghai Composite Index gained 16.63 points, or 0.48%, closing at 3,509.68. As of 4:33 p.m., Dow Jones Futures were trading 32.91 points lower, down 0.07%, at 44,426. US tech stocks rallied as Wall Street assessed President Trump’s renewed tariff threats aimed at securing trade deals, with negotiations extended to August 1. Meanwhile, the U.S. Brent crude oil price stood at $67.42.
Trade Setup Summary
The Nifty 50 opened in green on Thursday but was volatile in the morning session, but rebounded from its day’s low later in the afternoon session, and closed on a negative note at 25,355.25, peaking at 25,524.05. A break below 25,340 could trigger further selling towards 25,259.37, while a break above 25,417.68 could trigger bullishness towards 25,545.15.
Bank Nifty opened on a similar trend, opening in green and ending at 56,956, below the 57,000 mark. A break below 56,856.24 could trigger further selling towards 56,626.68, while a break above 57,022.92 could trigger bullishness towards 57,197.14.
Sensex opened on a similar trend, opening on a positive note, and ended below the 83,200 level at 83,190.28. A break below 83,018.75 could trigger further selling towards 82,860.45, while breaking the next resistance level of 83,321.66 could lead towards the 83,478 level.
Given the ongoing volatility and mixed sentiments, it’s advisable to avoid aggressive positions and wait for clear directional moves above resistance or below support. Traders should consider these key support and resistance levels when entering long or short positions following the price break from these critical levels. Additionally, traders can combine moving averages to identify more accurate entry and exit points.
Disclaimer

The views and investment tips expressed by investment experts/broking houses/rating agencies on tradebrains.in are their own, and not that of the website or its management. Investing in equities poses a risk of financial losses. Investors must therefore exercise due caution while investing or trading in stocks. Trade Brains Technologies Private Limited or the author are not liable for any losses caused as a result of the decision based on this article. Please consult your investment advisor before investing.
About: Trade Brains Portal is a stock analysis platform. Its trade name is Dailyraven Technologies Private Limited, and its SEBI-registered research analyst registration number is INH000015729.
Investments in securities are subject to market risks. Read all the related documents carefully before investing.
Registration granted by SEBI and certification from NISM in no way guarantee performance of the intermediary or provide any assurance of returns to investors.
