The market sentiment on Monday reflected a broadly positive and bullish tone, supported by strong buying interest across major indices. Both the Nifty 50 and the Sensex managed to sustain gains through the session, recovering from minor intraday dips and closing above key moving averages, a signal of underlying strength in the ongoing uptrend.
Investor confidence appeared steady as the indices held above crucial technical support zones, and momentum indicators such as RSI remained in the neutral range, suggesting that there is still room for further upside before reaching overbought conditions. The overall setup pointed to a continuation of short-term bullish momentum driven by renewed optimism and selective sectoral strength.
Sectorally, the IT and Defence spaces led the rally, driven by renewed buying interest in large-cap technology firms and defence manufacturers, indicating market preference for growth and export-oriented themes. On the other hand, the Media and Realty indices experienced mild profit booking after recent gains, which did little to dampen the broader market sentiment. The upbeat tone across major Asian markets further boosted domestic investor morale, reflecting global risk-on sentiment and encouraging inflows into equities. Overall, the market mood remained constructive, with traders showing confidence in sustained near-term upside amid supportive global cues and firm domestic momentum.
In this overview, we will analyse the key technical levels and trend directions for Nifty and BSE Sensex to monitor in the upcoming trading sessions. All the charts mentioned below are based on the 5-minute timeframe.
NIFTY 50 Chart & Price Action Analysis
(In this analysis, we have used 20/50/100/200 EMAs, where 20 EMA (Red), 50 EMA (Orange), 100 EMA (Light Blue), and 200 EMA (Dark Blue)).
To view other technical reports, click here
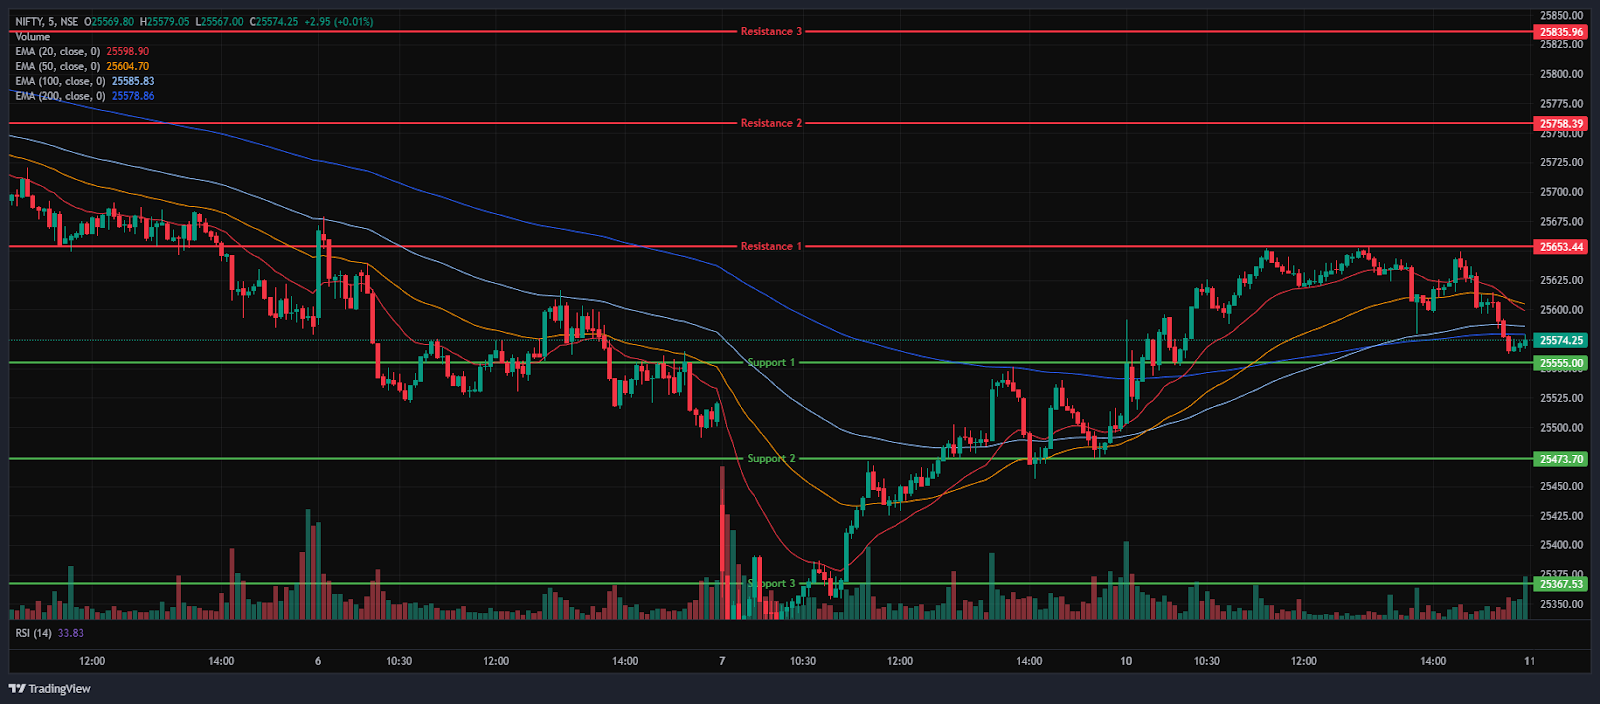
The Nifty 50 Index opened on a positive note at 25,503.50 on Monday, up by 11.2 points from Friday’s closing of 25,492.30. The index opened on a bullish note, surged and sustained above the 25,650 level. In the morning session, the Index traded within the 25,500-25,650 range. It traded above the EMAs of 20/50/100 but below the 200-day EMA in the 15-minute chart.
In the afternoon session, the index made its intraday high of 25,653.45 and later lost its momentum and settled above the 25,550 level. Overall, the Index traded within a 25,550-25,650 range throughout the afternoon session. During the afternoon session, the Nifty 50 closed below all four EMAs of 20/50/100/200 in the 15-minute time frame.
The Nifty’s immediate resistance levels are R1 (25,653), R2 (25,758), and R3 (25,836), while immediate support levels are S1 (25,555), S2 (25,474) and S3 (25,367). The Nifty index had reached a day’s high at 25,653.45 and saw a day’s low at 25,503.50. Finally, it had closed at 25,574.35, in the green and above the 25,550 level, up 82.05 points, or 0.32%. The Nifty 50 closed above the EMAs of 50/100/200 but below the 20-day EMA in the daily time frame.
NIFTY 50 Momentum Indicators Analysis
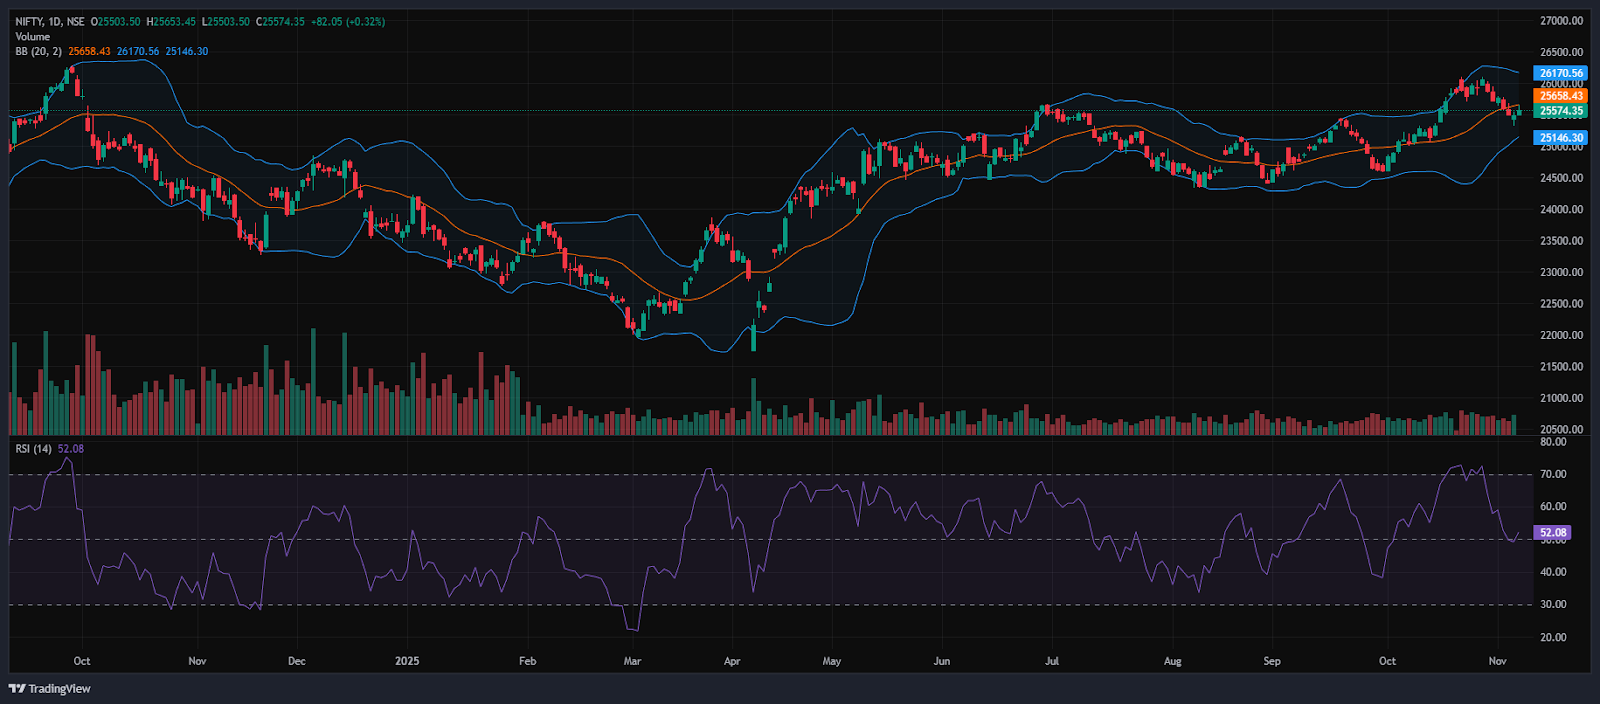
RSI (Daily): The Nifty 50’s RSI stood at 52.08, which is below the overbought zone of 70, indicating bullish sentiment.
Bollinger Bands (Daily): The index is trading in the lower band of the Bollinger Band range (Simple Moving Average). Its position in the lower range suggests a bearish sentiment, but in the daily time frame on Monday session, the Index ended in a bullish note. The index took support near 25,653, and 25,503 acted as a resistance level. A sustained move above the middle band signals a bullish sentiment, while a drop back toward the lower band may reinforce bearish sentiment.
Volume Analysis: Monday’s trading session had an average volume of 243.59 Mn.
Derivatives Data: Options OI indicates strong Put writing at 25,500, followed by 25,400, establishing it as a firm support zone. On the upside, a significant Call OI buildup at 25,600 and 25,700 suggests a potential resistance supply. PCR (Put/Call Ratio) stands at 0.95 (<1), leaning towards bullish sentiment, but the long Buildup indicates a Strong Bullish outlook, thus indicating a bullish outlook for the next trading session.
Bank Nifty Chart & Price Action Analysis
(In this analysis, we have used 20/50/100/200 EMAs, where 20 EMA (Red), 50 EMA (Orange), 100 EMA (Light Blue), and 200 EMA (Dark Blue)).
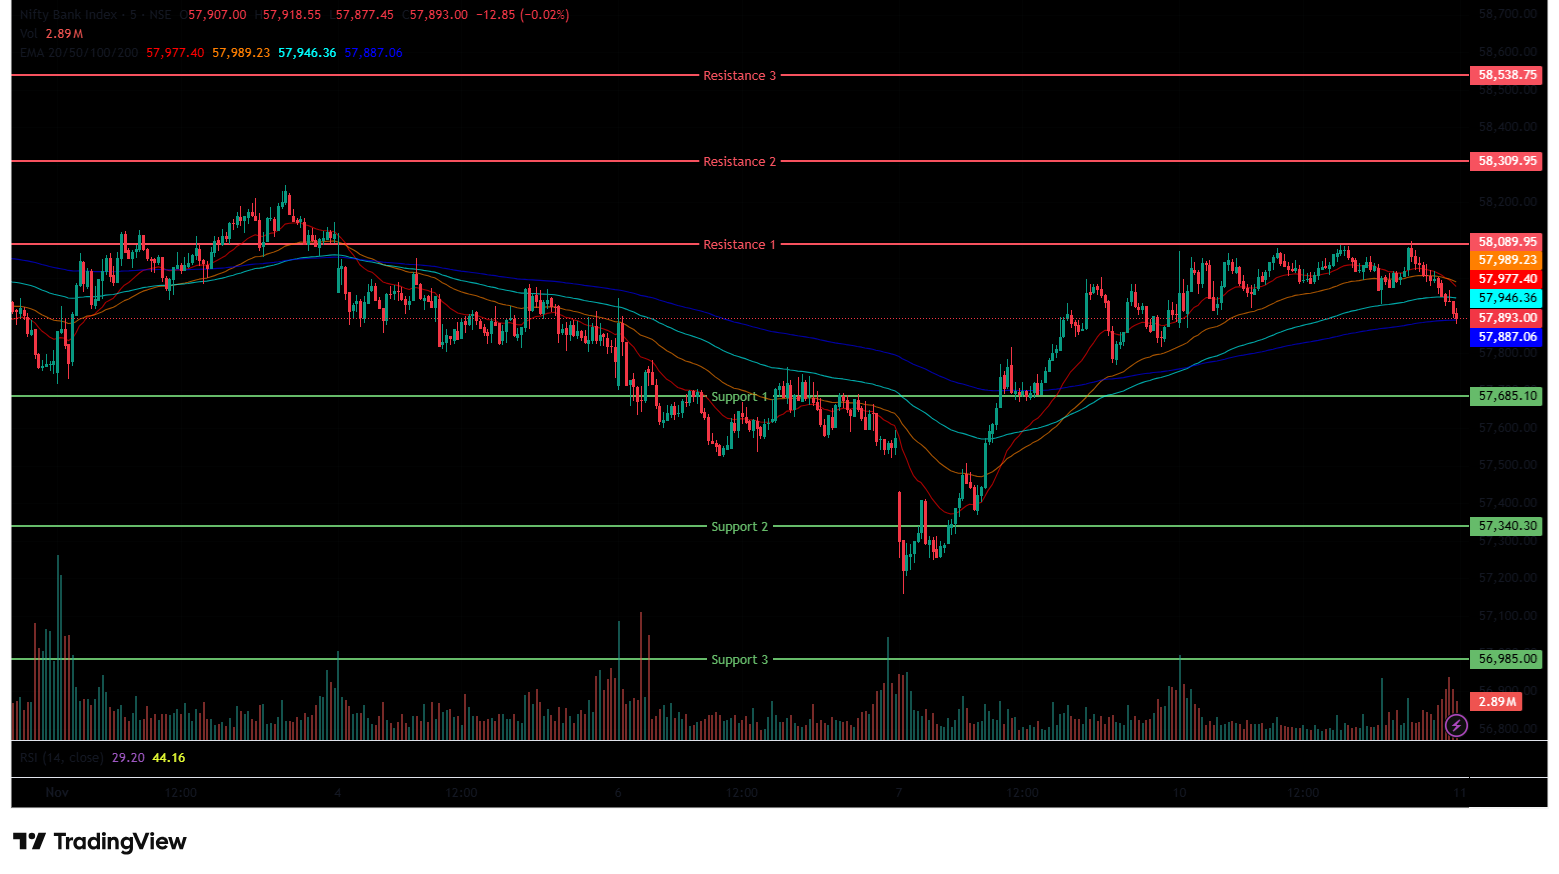
The Bank Nifty Index started the session on a negative note at 57,846.20 on Monday, down by 30.6 points from Friday’s closing of 57,876.80. The index started on a Bearish note, but later, it moved upwards and was trading within the 57,800-58,100 range and was trading above all four EMAs of 20/50/100/200 in the 15-minute time frame in the morning session.
In the afternoon session, the Index hit an intraday high at 58,097.20 and settled near the 57,900 level. Further, the Index was trading in the range of 57,850-58,100, and ended with gains in green. During the afternoon session, Bank Nifty closed below the EMAs of 20/50/200 but above the 100-day EMA in the 15-minute time frame.
The Bank Nifty’s immediate resistance levels are R1 (58,090), R2 (58,310) and R3 (58,539), while immediate support levels are S1 (57,685), S2 (57,340), and S3 (56,985). The Bank Nifty index had peaked at 58,097.20 and made a day’s low at 57,846.20. Finally, it had closed in green at 57,937.55, rising above the 57,900 level, gaining 60.75 points or 0.10%. The Relative Strength Index (RSI) stood at 60.71, below the overbought zone of 70 in the daily time frame, and Bank Nifty closed above all four EMAs of 20/50/100/200 in the daily time frame.
BSE Sensex Chart & Price Action Analysis
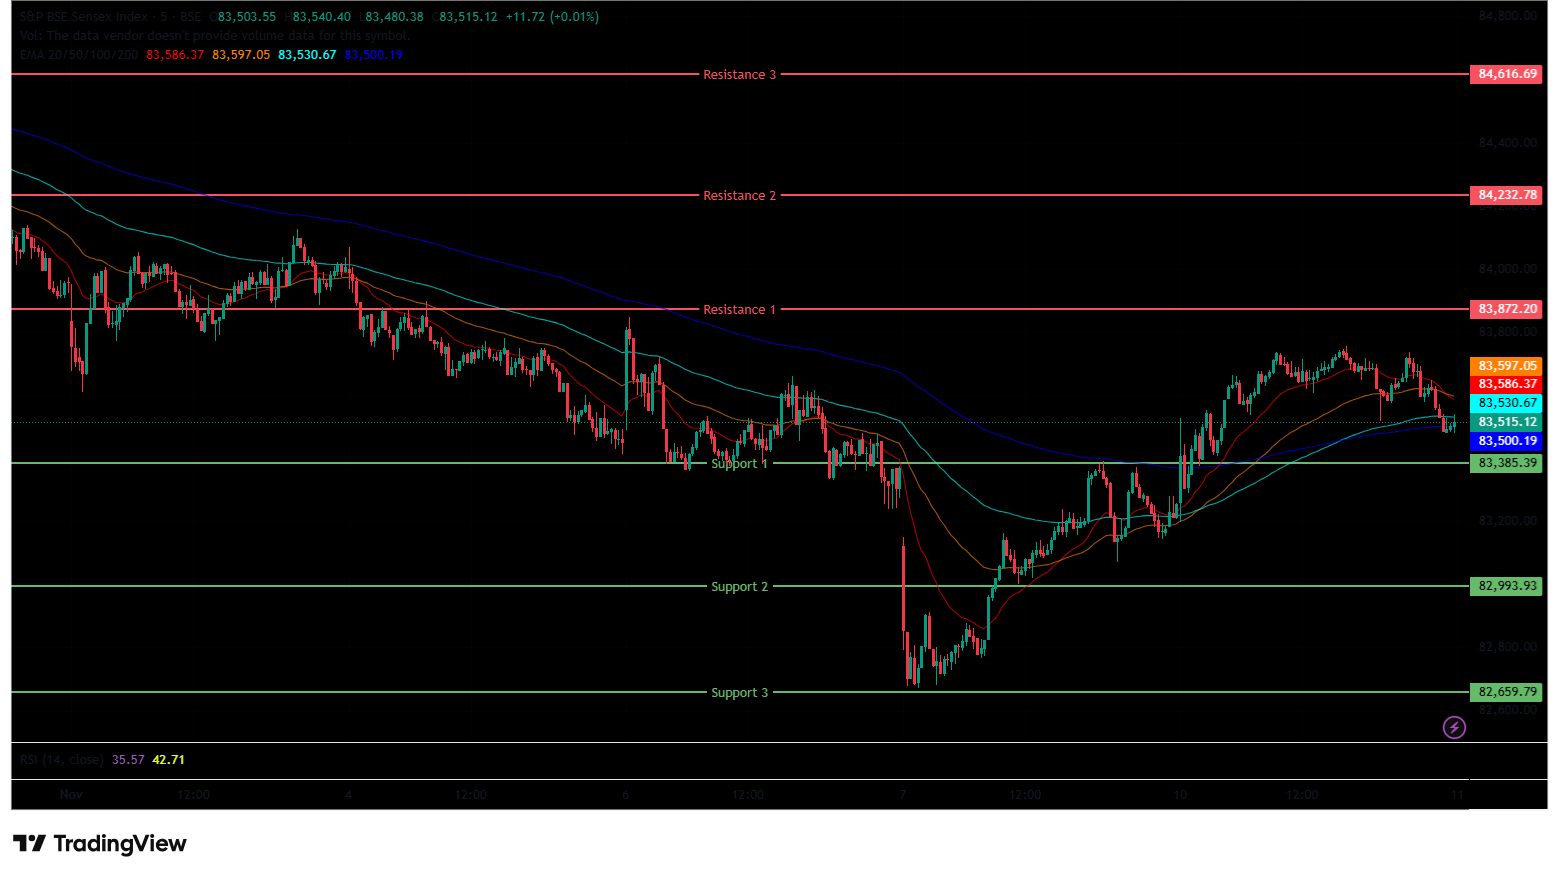
(In this analysis, we have used 20/50/100/200 EMAs, where 20 EMA (Red), 50 EMA (Orange), 100 EMA (Light Blue), and 200 EMA (Dark Blue)).
To view other technical reports, click here
The BSE Sensex Index opened on a negative note at 83,198.20 on Monday, down by 18.08 points from Friday’s closing of 83,216.28. The index started its session on a bearish note, but later, it moved upwards and was trading within the 83,150-83,750 range. It traded above the EMAs of 20/50/100 but below the 200-day EMA in the 15-minute time frame in the morning session.
In the afternoon session, the Index further climbed and touched 83,754.49, marking its day’s high and settled above 83,500. The Index was trading in the 83,450-83,800 range, following a bullish trend and closed below the EMAs of 20/100/200 but above the 50-day EMA in the 15-minute time frame.
The BSE Sensex immediate resistance levels are R1 (83,872), R2 (84,233) and R3 (84,617), while immediate support levels are S1 (83,385), S2 (82,994), and S3 (82,660).The BSE Sensex index had peaked at 83,754.49 and made a day’s low at 83,197.67. Finally, it had closed at 83,535.35 in green, gaining 319.07 points or 0.38%. The Relative Strength Index (RSI) stood at 52.96, below the overbought zone of 70 in the daily time frame, and the BSE Sensex closed above all four EMAs of 20/50/100/200 in the daily time frame.
Market Recap on November 10th, 2025
On Monday, the Nifty 50 opened slightly higher at 25,503.5, up 11.2 points from its previous close of 25,492.3. The index hit an intraday high of 25,653.45 and closed at 25,574.35, up 82.05 points, or 0.32%. The index went only below the 20-day EMA during the day but closed above key moving averages (50/100/200-day EMAs) on the daily chart.
The BSE Sensex opened on a negative trend, opening at 83,198.20, down -18.08 points from the previous close of 83,216.28. It followed a similar pattern to Nifty, closing at 83,535.35, up 319.07 points, or 0.38%. Both indices showed high momentum, with RSI values for Nifty 50 at 52.08 and Sensex at 52.96, below the overbought threshold of 70.
On Monday, indices show a bullish reaction. The Nifty IT index was the major gainer, rising 1.6% or 570.6 points, and standing at 35,688.25. Stocks such as Infosys Ltd rose 2.5%, followed by HCL Technologies Ltd and Mphasis Ltd, which gained up to 1.5% on Monday. The Nifty India Defence index was also among the biggest gainers, rising 1.5% or 115.35 points, and standing at 8,073.7. Stocks such as Dynamatic Technologies Ltd jumped 6.3% on Monday. While other defence stocks like Bharat Dynamics Ltd, Garden Reach Shipbuilders, and Hindustan Aeronautics Ltd also gained up to 4.6%.
On the Sectoral Losers, the Nifty Media Index was the biggest loser, falling -1.04%, or -15.50 points, to 1,474.15. Media stocks like Nazara Technologies Ltd, Prime Focus Ltd, Tips Music Ltd, and PVR Inox Ltd saw declines of up to -2.51%. The Nifty Realty Index also fell on Monday’s trade, ending at 944.15, down -2.25 or -0.24%.
Asian markets had an overall bullish sentiment on Monday. Japan’s Nikkei 225 increased by 635.39 points or 1.26%, closing at 50,911.76. While China’s Shanghai Composite rose by 21.04 points, or 0.53%, to 4,018.60, similarly, Hong Kong’s Hang Seng Index also jumped by 407.23 points, or 1.55%, to close at 26,649.06. South Korea’s KOSPI rose sharply by 119.48 points or 3.02%, closing at 4,073.24. At 4:46 p.m. IST, U.S. Dow Jones Futures were up, increasing 0.46%, at 47,201.09, losing 213.99 points.
India VIX
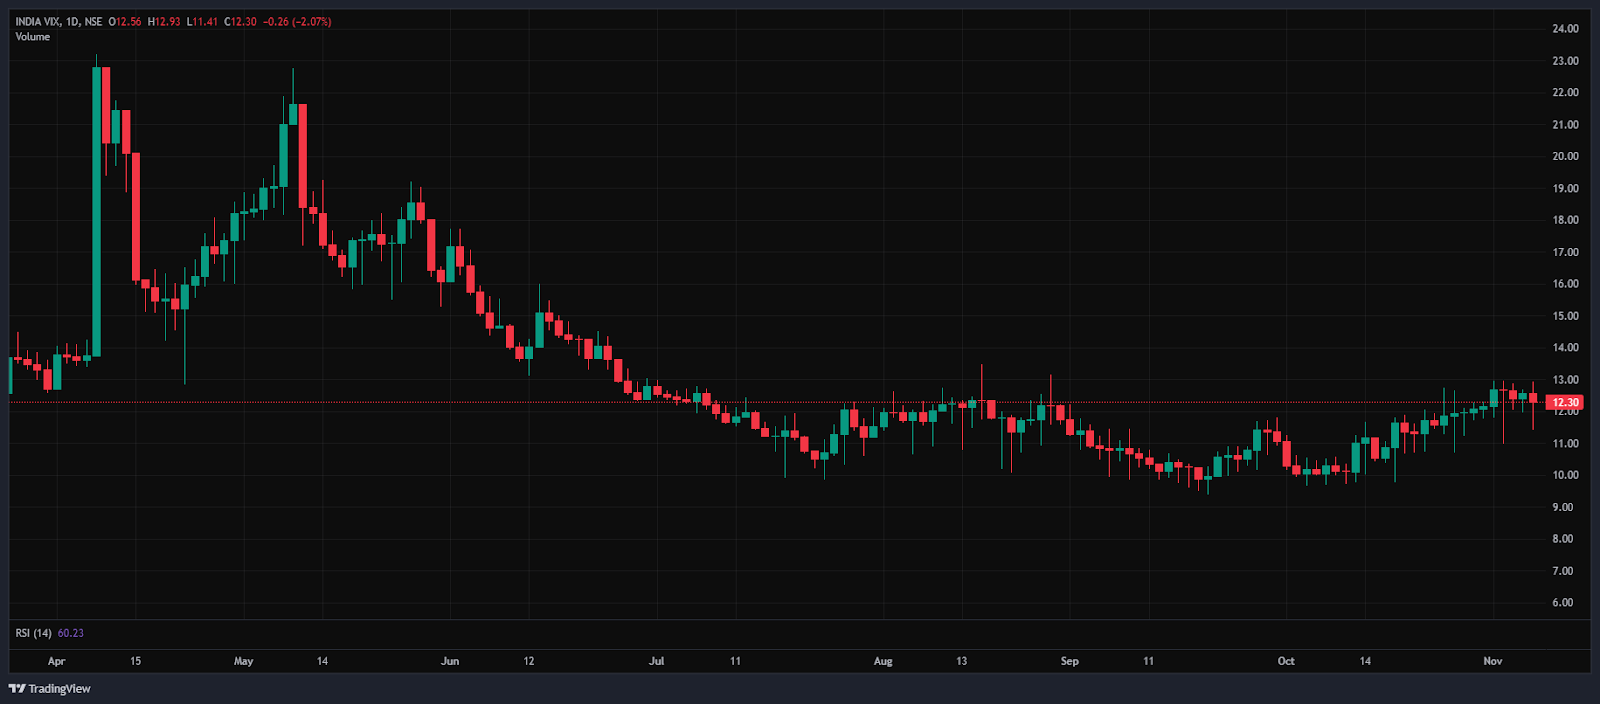
The India VIX decreased 0.25 points or 2.01%, from 12.56 to 12.30 during Monday’s session. A decrease in the India VIX typically indicates lower price volatility in the stock market, suggesting a more stable market environment. However, a stable market environment and minimal volatility are anticipated when the India VIX is below 15.
Trade Setup Summary
The Nifty 50 opened on a positive note at 25,503.50 on Monday and ended the session in the green above the 25,550 level at 25,574.35. A break below 25,555 could trigger further selling towards 25,474, while breaking the next resistance level of 25,653 could trigger bullishness towards the 25,758 level.
The Bank Nifty also started the session on a negative note at 57,846.20 but ended the session in the green at 57,937.55, above the 57,900 level. A break below 57,685 could trigger further selling towards 57,340, while breaking the next resistance level of 58,090 could trigger bullishness towards the 58,310 level.
The Sensex opened on a negative note at 83,198.20 but ended the session in the green at 83,535.35, above the 83,500 level. A break below 83,385 could trigger further selling towards 82,994, while breaking the next resistance level of 83,872 could trigger bullishness towards the 84,233 level.
Given the ongoing volatility and mixed sentiments, it’s advisable to avoid aggressive positions and wait for clear directional moves above resistance or below support. Traders should consider these key support and resistance levels when entering long or short positions following the price break from these critical levels. Additionally, traders can combine moving averages to identify more accurate entry and exit points.
Disclaimer

The views and investment tips expressed by investment experts/broking houses/rating agencies on tradebrains.in are their own, and not that of the website or its management. Investing in equities poses a risk of financial losses. Investors must therefore exercise due caution while investing or trading in stocks. Trade Brains Technologies Private Limited or the author are not liable for any losses caused as a result of the decision based on this article. Please consult your investment advisor before investing.
About: Trade Brains Portal is a stock analysis platform. Its trade name is Dailyraven Technologies Private Limited, and its SEBI-registered research analyst registration number is INH000015729.
Investments in securities are subject to market risks. Read all the related documents carefully before investing.
Registration granted by SEBI and certification from NISM in no way guarantee performance of the intermediary or provide any assurance of returns to investors.
