The Indian equity markets witnessed a strong positive sentiment on Wednesday, with benchmark indices extending their upward momentum. Both the Nifty 50 and Sensex opened on a higher note and sustained their gains throughout the session, closing well above key technical support levels. The overall tone reflected renewed investor confidence, supported by strength in frontline stocks and broad-based participation across major sectors. Technical indicators remained favourable, showing continued bullish momentum while staying below overbought levels, suggesting room for further upside.
Sector-wise performance showed a clear tilt toward growth-oriented segments, led by robust buying in information technology and automobile stocks, which outperformed the broader market. The strength in IT counters indicated optimism over global demand recovery, while the auto sector benefited from steady consumer sentiment and festive demand expectations. Meanwhile, mild profit booking in realty and defence stocks hinted at selective rotation within the market rather than a loss of confidence. Overall, the trading session reflected a healthy and optimistic market mood, supported by positive global cues and resilient domestic fundamentals.
In this overview, we will analyse the key technical levels and trend directions for Nifty and BSE Sensex to monitor in the upcoming trading sessions. All the charts mentioned below are based on the 15-minute timeframe.
NIFTY 50 Chart & Price Action Analysis
To view other technical reports, click here
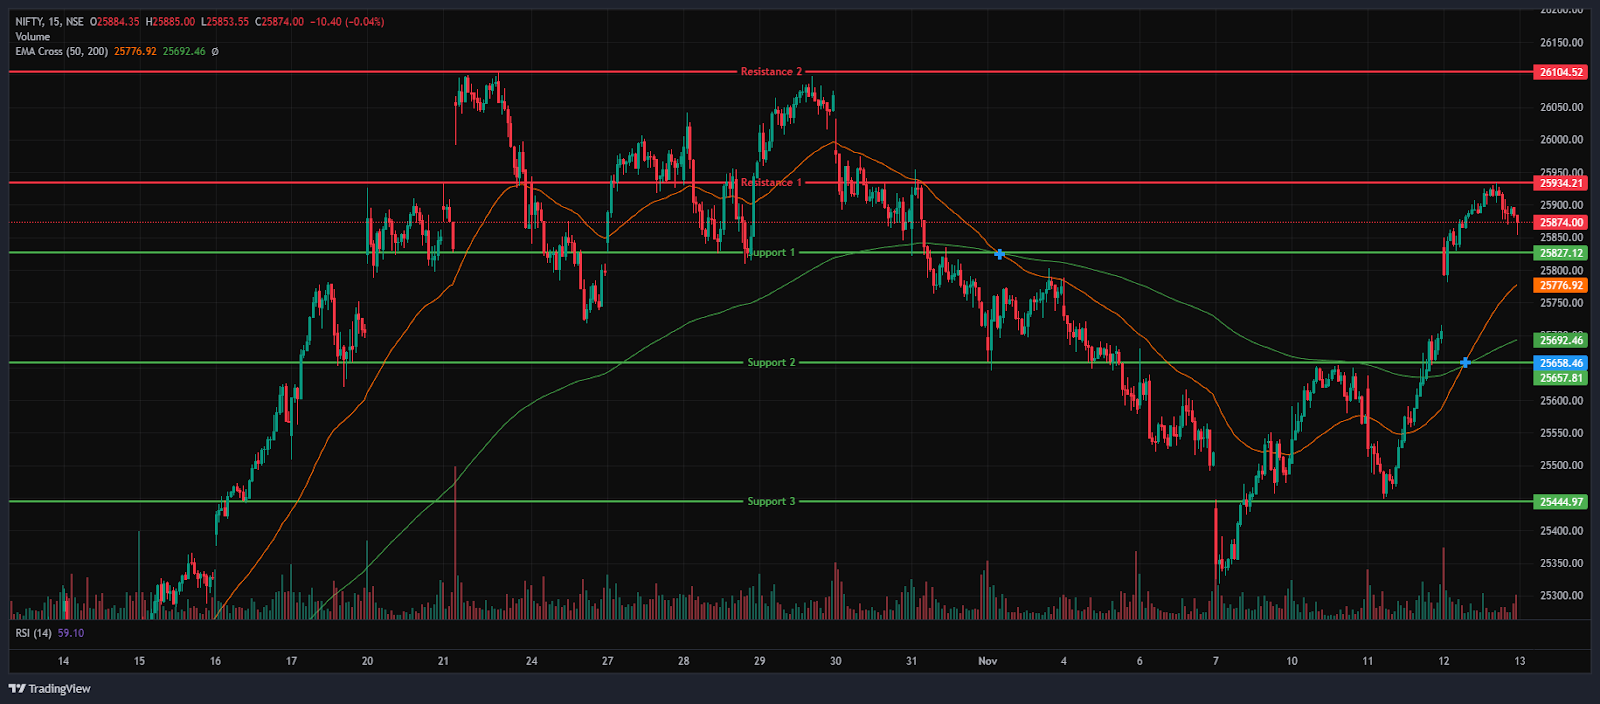
The Nifty 50 Index opened on a positive note at 25,834.30 on Wednesday, up by 139.8 points from Tuesday’s closing of 25,694.5. The index opened on a bullish note on Wednesday and reached the day’s high at 25,934.5, hovering below the key level of 26,000. The index continued its upward trend in the morning session and was trading within the range of 25,800 and 25,900; however, in the afternoon session, it declined from its day’s high and traded within the range of 25,850 and 25,900.
The Nifty index had reached a day’s high at 25,934.55 and saw a day’s low at 25,781.15. Finally, it had closed at 25,875.80, in the green and above the 25,850 level, up 180.85 points, or 0.70%.
Trade Setup:
| Nifty 50 | |
| Resistance 2 | 26,104.52 |
| Resistance 1 | 25,934.21 |
| Closing Price | 25,875.80 |
| Support 1 | 25,827.12 |
| Support 2 | 25,657.81 |
| Support 3 | 25,444.97 |
NIFTY 50 Momentum Indicators Analysis
RSI (Daily): The Nifty 50’s RSI stood at 61.27, which is below the overbought zone of 70, indicating bullish sentiment and room to grow higher.
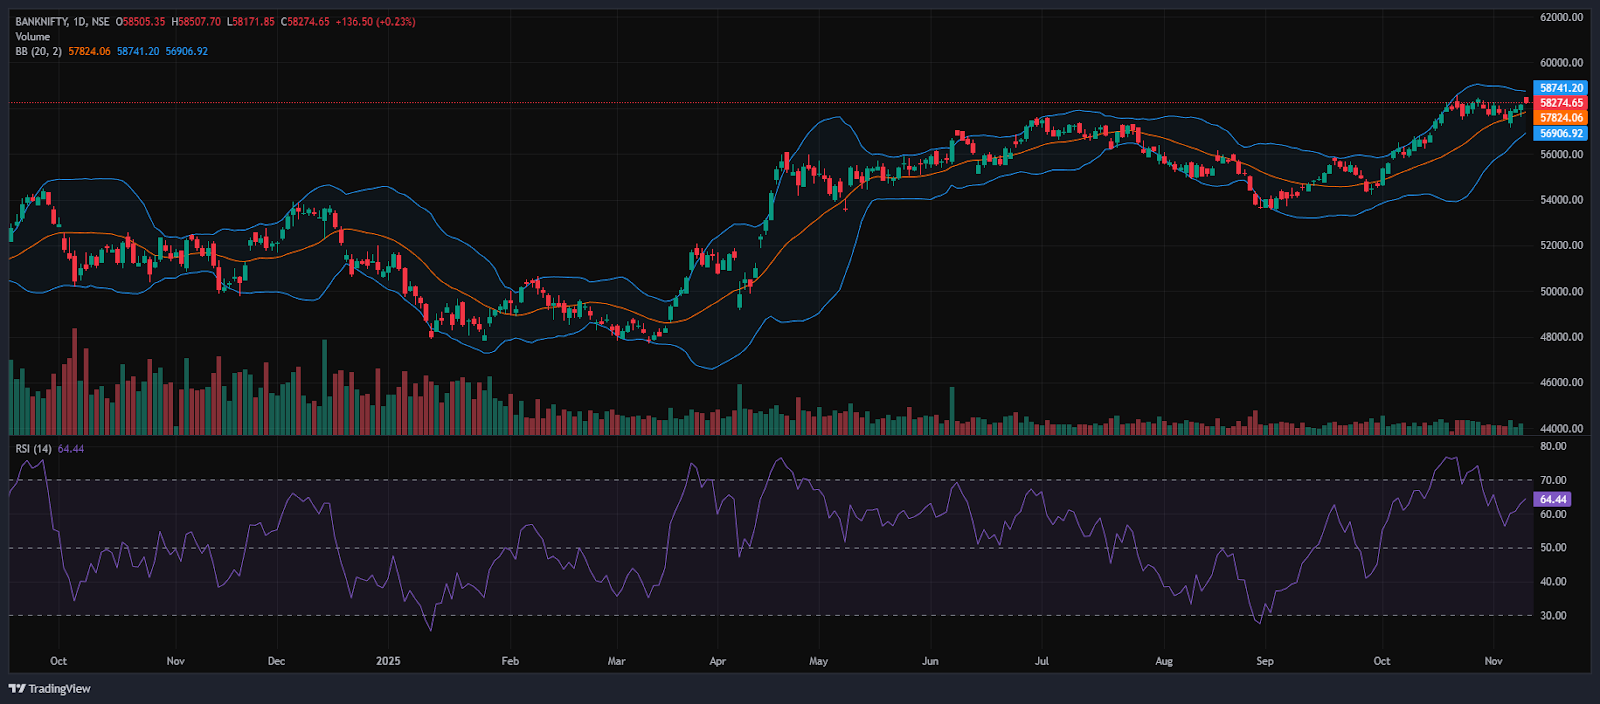
Bollinger Bands (Daily): The index is trading in the upper band of the Bollinger Band range (Simple Moving Average). Its position in the upper range suggests a bullish sentiment, and starting the session on a gap-up on Wednesday, the Index ended on a bullish note. The index took support near 25,781, and 25,935 acted as a resistance level. A sustained move above the middle band signals a bullish sentiment, while a drop back toward the lower band may reinforce bearish sentiment.
Volume Analysis: Wednesday’s trading session had an average volume of 312.59 Mn.
Derivatives Data: Options OI indicates strong Put writing at 25,800, followed by 25,700, establishing a strong support zone. On the upside, a significant Call OI buildup at 25,900 and 26,000 suggests a potential resistance supply. PCR (Put/Call Ratio) stands at 1.31 (>1), leaning towards bearish sentiment and the long unwinding indicates that long buyers are exiting their positions, which signals Strong Bearish outlook, thus indicating a bearish outlook for the next trading session.
Bank Nifty Chart & Price Action Analysis
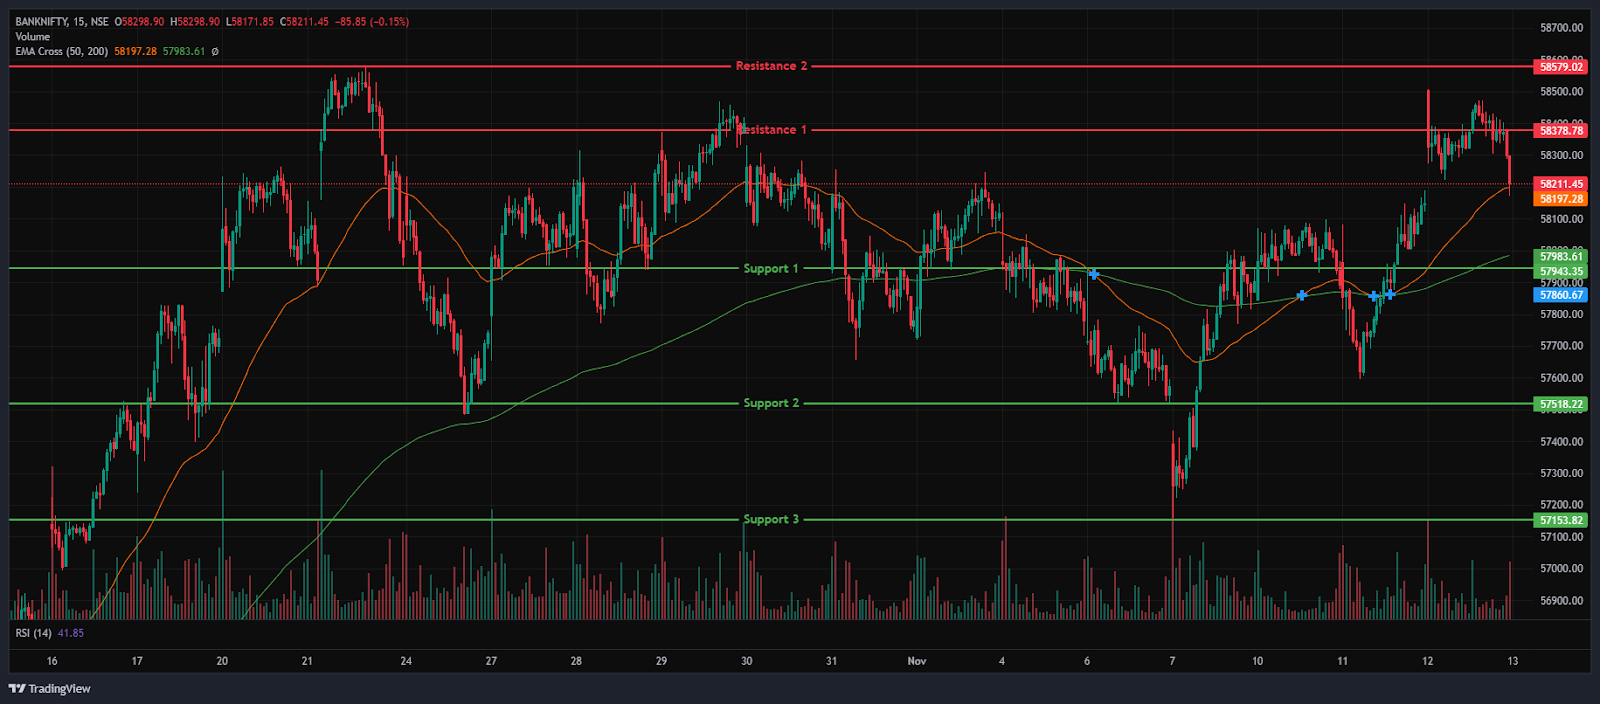
The Bank Nifty Index opened on a positive note at 58,505.35 on Wednesday, up by 367.2 points from Tuesday’s closing of 58,138.15. The index opened on a bullish note on Wednesday; however, in the morning session, it continued to trade in a range-bound manner, trading between 58,300 and 58,400 levels. In the afternoon session, the index continued to fall further and traded between the range of 58,200 and 58,400.
The Bank Nifty index had peaked at 58,507.70 and made a day’s low at 58,171.85. Finally, it had closed in green at 58,274.65, rising above the 58,250 level, gaining 136.50 points or 0.23%. The Relative Strength Index (RSI) stood at 64.4, below the overbought zone of 70 in the daily time frame.
Trade Setup:
| Bank Nifty | |
| Resistance 2 | 58,579.02 |
| Resistance 1 | 58,378.78 |
| Closing Price | 58,274.65 |
| Support 1 | 57,943.35 |
| Support 2 | 57,518.22 |
| Support 3 | 57,153.82 |
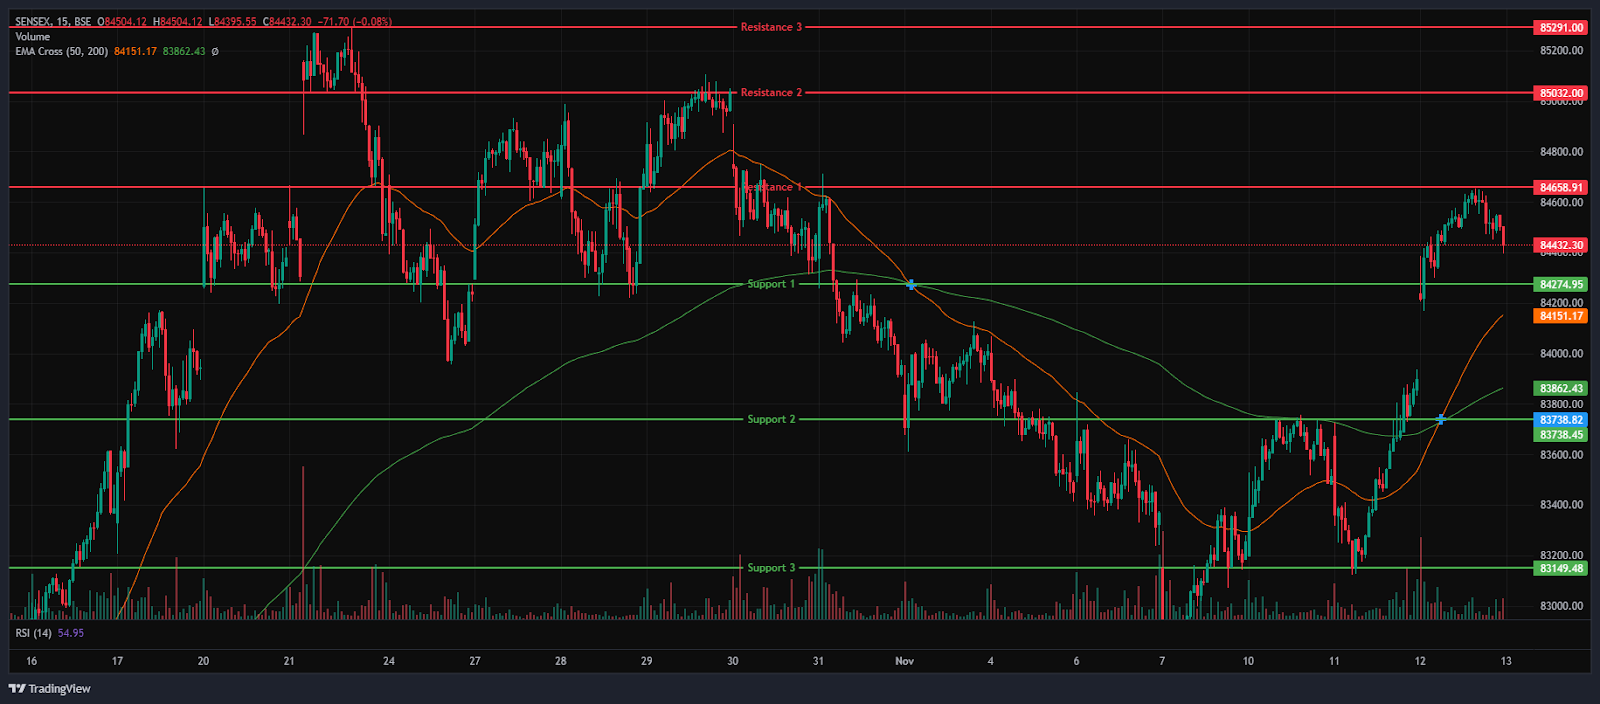
BSE Sensex Chart & Price Action Analysis
To view other technical reports, click here
The BSE Sensex Index opened on a positive note at 84,238.86 on Wednesday, up by 367.54 points from Tuesday’s closing of 83,871.32. The Sensex index also opened on a bullish note, mirroring Nifty 50 on Wednesday, and continued its uptrend in the morning session, peaking at 84,652.01. It traded between the range of 84,250 and 84,600 during the morning session. However, in the afternoon session, the index fell from its day’s high and traded between the range of 84,400 and 84,600.
The BSE Sensex index had peaked at 84,652.01 and made a day’s low at 83,166.75. Finally, it had closed at 84,466.51 in green, gaining 595.19 points or 0.71%. The Relative Strength Index (RSI) stood at 61.70, below the overbought zone of 70 in the daily time frame.
Trade Setup:
| Sensex | |
| Resistance 3 | 85,291.00 |
| Resistance 2 | 85,032.00 |
| Resistance 1 | 84,658.91 |
| Closing Price | 84,466.51 |
| Support 1 | 84,274.95 |
| Support 2 | 83,738.45 |
| Support 3 | 83,149.48 |
Market Recap on November 12th, 2025
On Wednesday, the Nifty 50 opened higher at 25,834.30, up 139.35 points from its previous close of 25,694.95. The index hit an intraday high of 25,934.55 and closed at 25,875.80, up 180.85 points, or 0.70%. The index closed above all key moving averages (20/50/100/200-day EMAs) on the daily chart. The BSE Sensex followed the same trajectory, opening on a positive trend at 84,238.86, up 367.54 points from the previous close of 83,871.32. It closed at 84,466.51, up 595.19 points, or 0.71%. Both indices showed high momentum, with RSI values for Nifty 50 at 61.27 and Sensex at 61.70, below the overbought threshold of 70.
On Wednesday, most indices show a bullish reaction. The Nifty IT index was the major gainer, rising 2.04% or 738.50 points, and standing at 36,855.40. Stocks such as Tech Mahindra Ltd rose 3.42%, followed by LTIMindtree Ltd and Tata Consultancy Services, which gained up to 3.20% on Wednesday. The Nifty Auto index was also among the biggest gainers, rising 1.24% or 336.90 points, and standing at 27,485.15. Stocks such as Hero MotoCorp Ltd jumped 2.15% on Wednesday. While other auto stocks like Uno Minda Ltd, Ashok Leyland, and Sona BLW Precision also gained up to 1.66%.
On the Sectoral Losers, the Nifty Realty Index was the biggest loser, falling -0.5%, or -4.65 points, to 937.95. Realty stocks like Prestige Estates Projects, Oberoi Realty, and Brigade Enterprises Ltd saw declines of up to -3.3%. The Nifty Defence Index also fell on Wednesday’s trade, ending at 8,248.65, down -23.05 or -0.3%.
Asian markets had a mixed sentiment on Wednesday. Japan’s Nikkei 225 gained by -220.38 points or 0.43%, closing at 51,063.31. China’s Shanghai Composite decreased by -2.61 points, or -0.07%, to 4,000.14, while Hong Kong’s Hang Seng Index rose by 226.32 points, or 0.85%, to close at 26,922.73. On the other hand, South Korea’s KOSPI continues to rise by 44 points or 1.07%, closing at 4,150.39.
India VIX
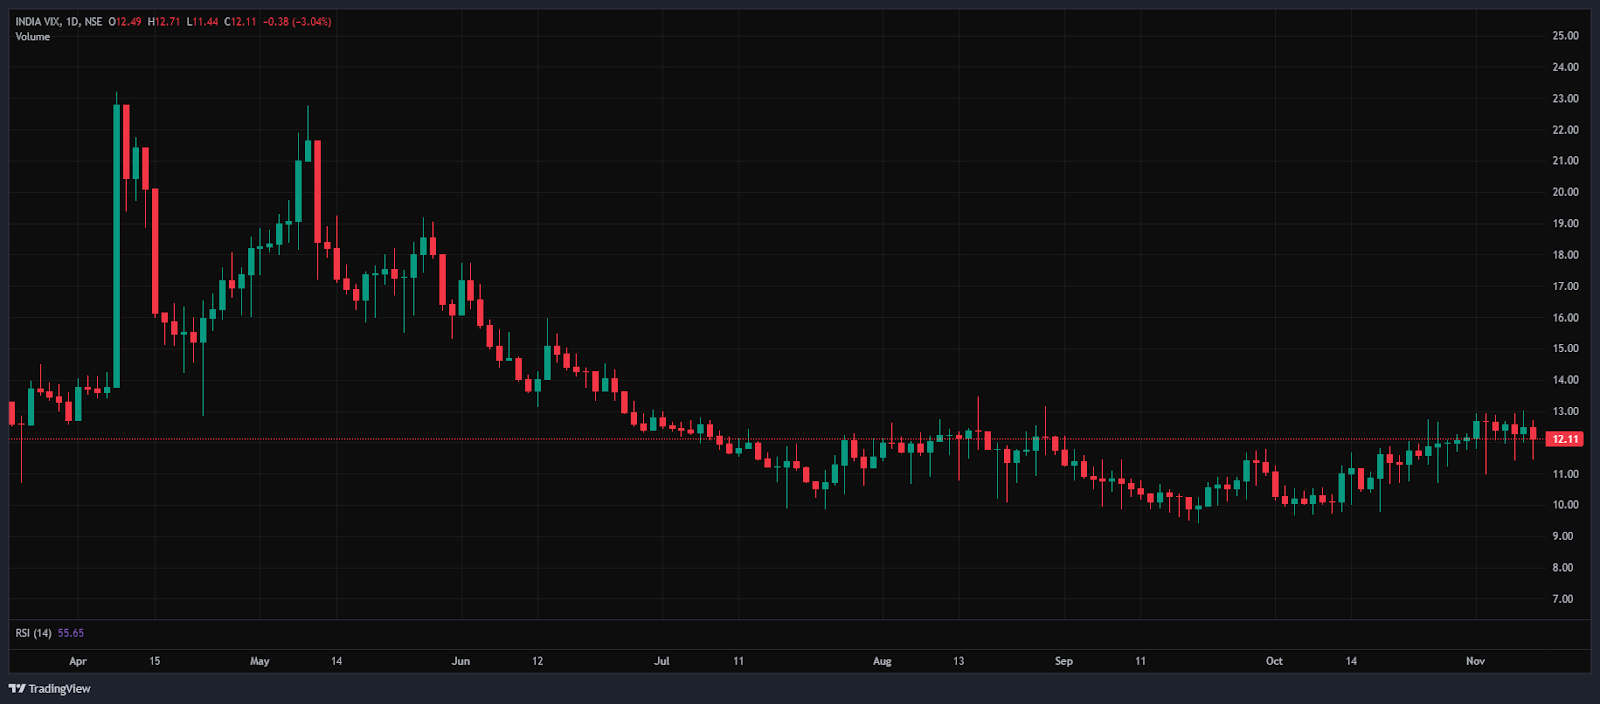
The India VIX decreased 0.38 points or 3.04%, from 12.49 to 12.11 during Wednesday’s session. A decrease in the India VIX typically indicates lower price volatility in the stock market, suggesting a stable market environment. However, a stable market environment and minimal volatility are anticipated when the India VIX is below 15.
Given the ongoing volatility and mixed sentiments, it’s advisable to avoid aggressive positions and wait for clear directional moves above resistance or below support. Traders should consider these key support and resistance levels when entering long or short positions following the price break from these critical levels. Additionally, traders can combine moving averages to identify more accurate entry and exit points.
Disclaimer

The views and investment tips expressed by investment experts/broking houses/rating agencies on tradebrains.in are their own, and not that of the website or its management. Investing in equities poses a risk of financial losses. Investors must therefore exercise due caution while investing or trading in stocks. Trade Brains Technologies Private Limited or the author are not liable for any losses caused as a result of the decision based on this article. Please consult your investment advisor before investing.
About: Trade Brains Portal is a stock analysis platform. Its trade name is Dailyraven Technologies Private Limited, and its SEBI-registered research analyst registration number is INH000015729.
Investments in securities are subject to market risks. Read all the related documents carefully before investing.
Registration granted by SEBI and certification from NISM in no way guarantee performance of the intermediary or provide any assurance of returns to investors.
