
Domestic equity markets opened on a subdued note to start the week, with both the Nifty 50 and BSE Sensex facing selling pressure amid weak global cues. After a volatile session, both indices ended lower, although they managed to stay above key technical support levels on the charts. Despite the dip, broader technical indicators continue to signal strength, with major indices maintaining positions above their short- and long-term moving averages. Market sentiment remained cautious, but not overly bearish, as momentum indicators like the RSI stayed within neutral territory.
Sectoral performance was mixed, with capital markets and PSU banks showing resilience and posting modest gains, while FMCG, consumer durables, and IT stocks dragged down the indices. Broader markets such as the Nifty Midcap 50 also saw some buying interest, adding stability to the overall market tone. Global markets, particularly across Asia, largely mirrored the cautious sentiment, reacting to macroeconomic concerns and global investor uncertainty. However, a positive start in US futures trading helped provide some support to market expectations heading into the next session.
In this overview, we will analyse the key technical levels and trend directions for Nifty and BSE Sensex to monitor in the upcoming trading sessions. All the charts mentioned below are based on the 5-minute timeframe.
Nifty 50
(In this analysis, we have used 20/50/100/200 EMAs, where 20 EMA (Red), 50 EMA (Orange), 100 EMA (Light Blue), and 200 EMA (Dark Blue)).
To view other technical reports, click here
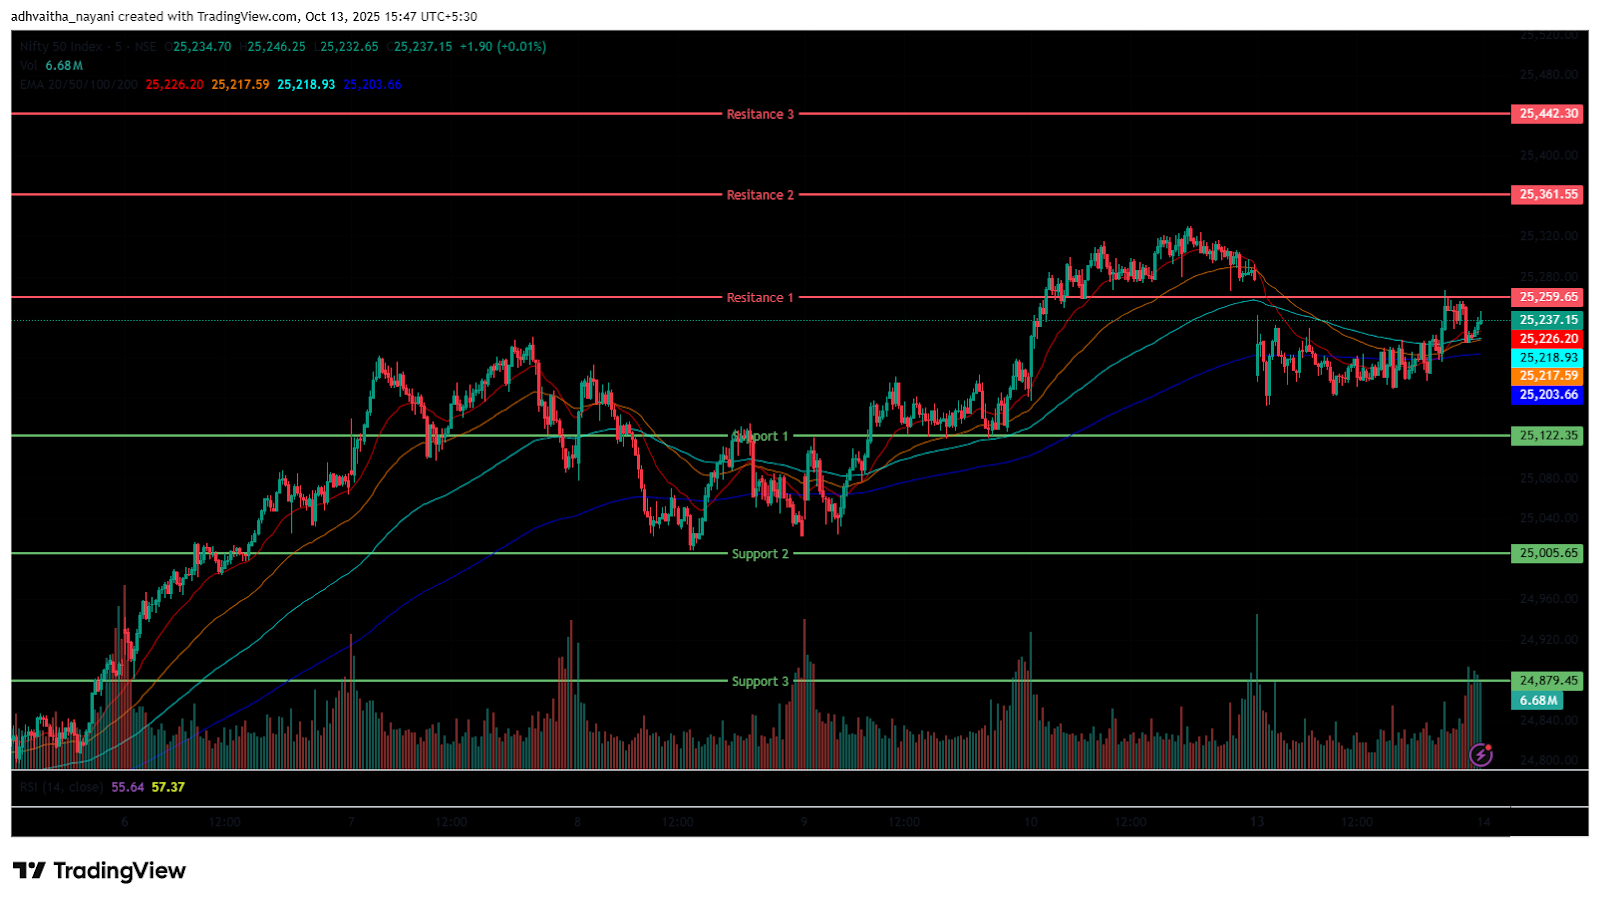
The Nifty 50 Index opened on a negative note at 25,177.30 on Monday, down by 108.05 points from Friday’s closing of 25,285.35. With a bearish start to the day, the index had a volatile morning session, trading in the 25,150 to 25,250 range. Additionally, the Index stood below the EMAs of 20/50 but above the 100/200 EMAs in the 15-minute time frame during the morning session.
Further, the index recovered and surged as high as the 25,267 marking its day high in the afternoon session and was traded in the range of 25,150 and 25,300. During the afternoon session, the Nifty 50 closed above all four EMAs of 20/50/100/200 in the 15-minute time frame. Nifty’s immediate resistance levels are R1 (25,260), R2 (25,362), and R3 (25,442), while immediate support levels are S1 (25,122), S2 (25,006), and S3 (24,879).
The Nifty index had reached a day’s high at 25,267.30 and saw a day’s low at 25,152.30. Finally, it had closed at 25,227.35, in red below the 25,250 level, losing 58 points, or 0.23%. The Nifty 50 closed above all four EMAs of 20/50/100/200 in the daily time frame.
Momentum Indicators
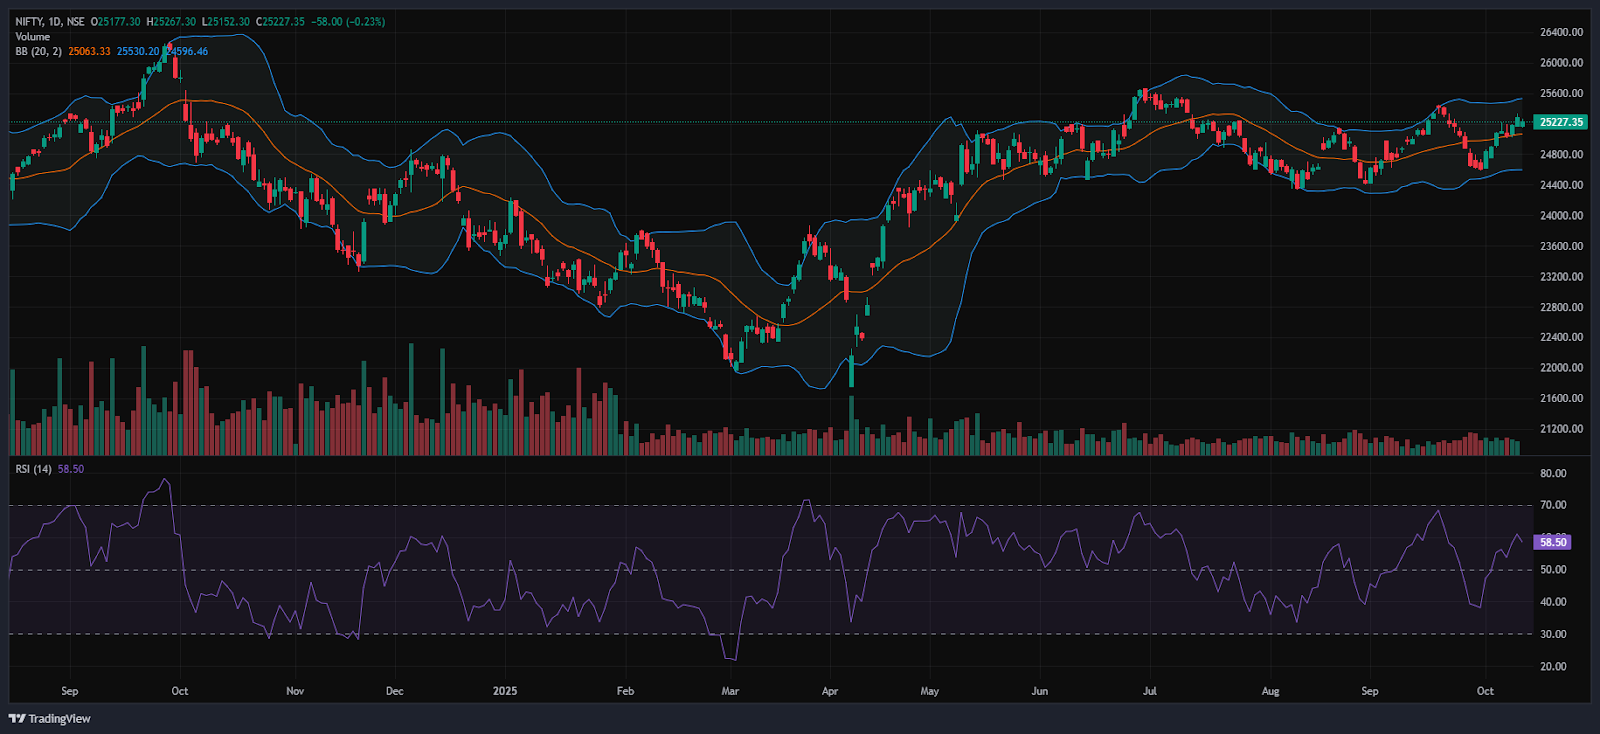
RSI (Daily): The Nifty 50’s RSI stood at 58.50, which is well below the overbought zone of 70, indicating a bullish sentiment and still has room to grow higher.
Bollinger Bands (Daily): The index is trading in the upper band of the Bollinger Band range above the middle band (Simple Moving Average). Its position in the upper range indicates a bullish sentiment. A sustained move above the middle band signals a bullish sentiment, while a drop back toward the lower band may reinforce bearish sentiment.
Volume Analysis: Monday’s trading session had average volumes, which stood at 234.29 Mn.
Derivatives Data: Options OI indicates strong Put writing at 25,200, followed by 25,100, establishing it as a firm support zone. On the upside, a significant Call OI buildup at 25,300 and 25,350 suggests a potential resistance supply. PCR (Put/Call Ratio) stands at 1.0225 (>=1), leaning towards neutral sentiment and the Short Covering signals a short-term bullish signal, with an overall neutral to bullish outlook for the next trading session.
Bank Nifty
(In this analysis, we have used 20/50/100/200 EMAs, where 20 EMA (Red), 50 EMA (Orange), 100 EMA (Light Blue), and 200 EMA (Dark Blue)).
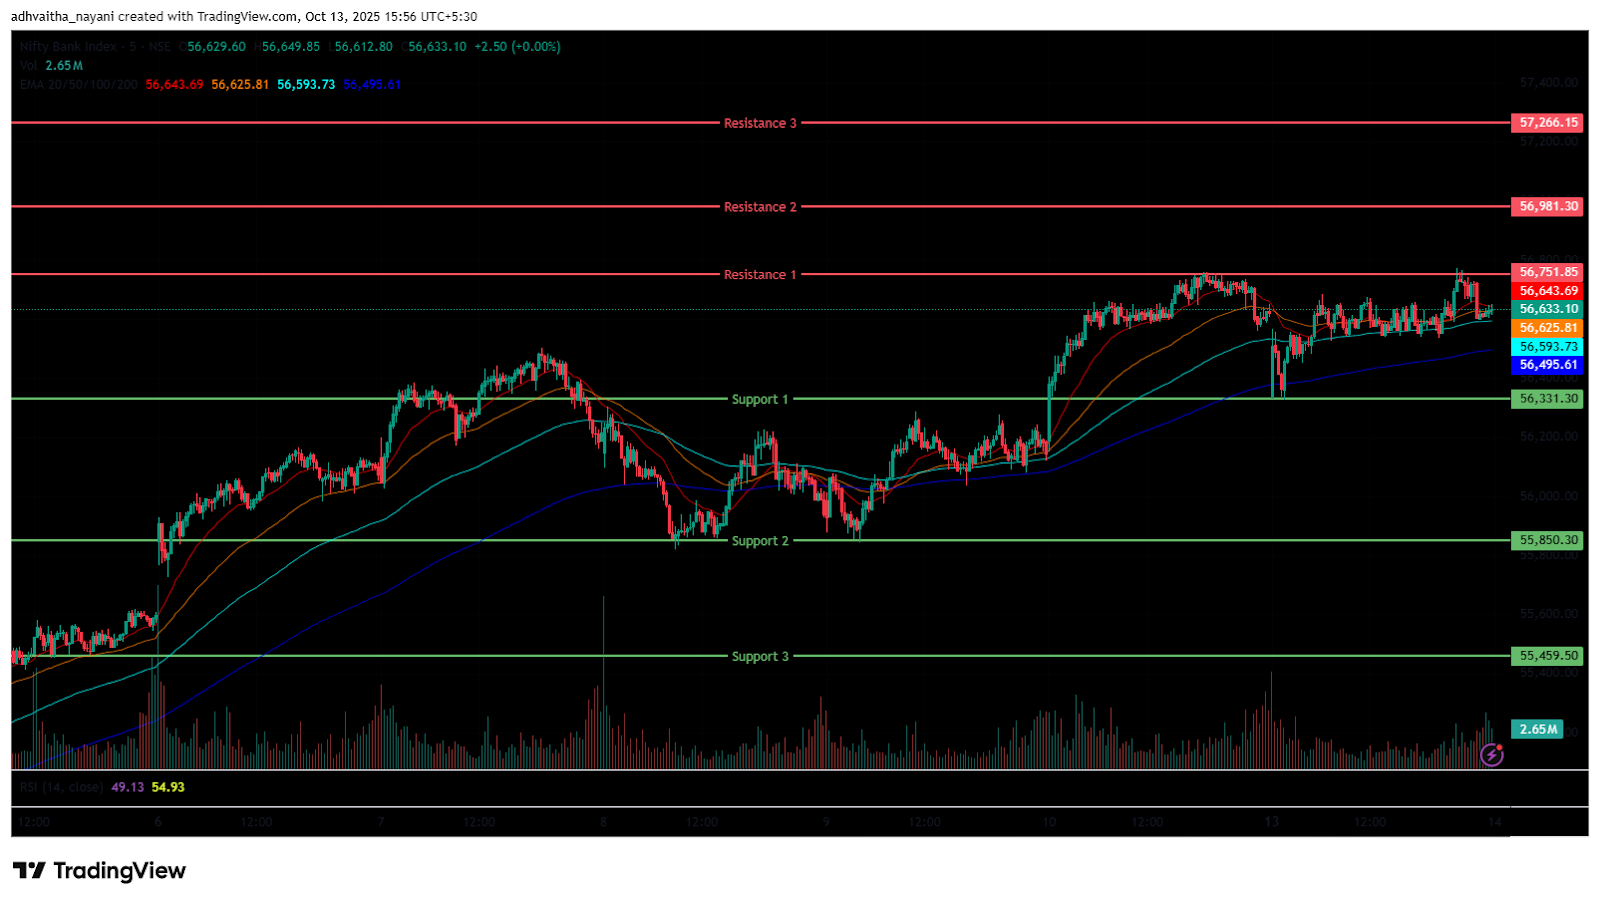
The Bank Nifty Index also started the session on a negative note at 56,337.05 on Monday, down by 272.7 points from Friday’s closing of 56,609.75. The index was trading between the range of 56,300 and 56,700 in the morning session, indicating high volatility. In addition, the index was trading above all four EMAs of 20/50/100/200 in the 15-minute time frame. In the afternoon session, the Index recovered from low and made its day’s high at 56,771.
Further, the Index was trading in the range of 56,500 and 56,800, and ended in green above its opening level. During the afternoon session, Bank Nifty closed above all four EMAs of 20/50/100/200 in the 15-minute time frame. Bank Nifty immediate resistance levels are R1 (56,752), R2 (56,981), and R3 (57,266), while immediate support levels are S1 (56,331), S2 (55,850), and S3 (55,459).
The Bank Nifty index had peaked at 56,770.90 and made a day’s low at 56,327.40. Finally, it had closed in green at 56,625.00, closing above the 56,600 level, gaining 15.25 points or 0.027%. The Relative Strength Index (RSI) stood at 66.90 well below the overbought zone of 70 in the daily time frame, and Bank Nifty closed above all four EMAs of 20/50/100/200 in the daily time frame.
Sensex
(In this analysis, we have used 20/50/100/200 EMAs, where 20 EMA (Red), 50 EMA (Orange), 100 EMA (Light Blue), and 200 EMA (Dark Blue)).
To view other technical reports, click here
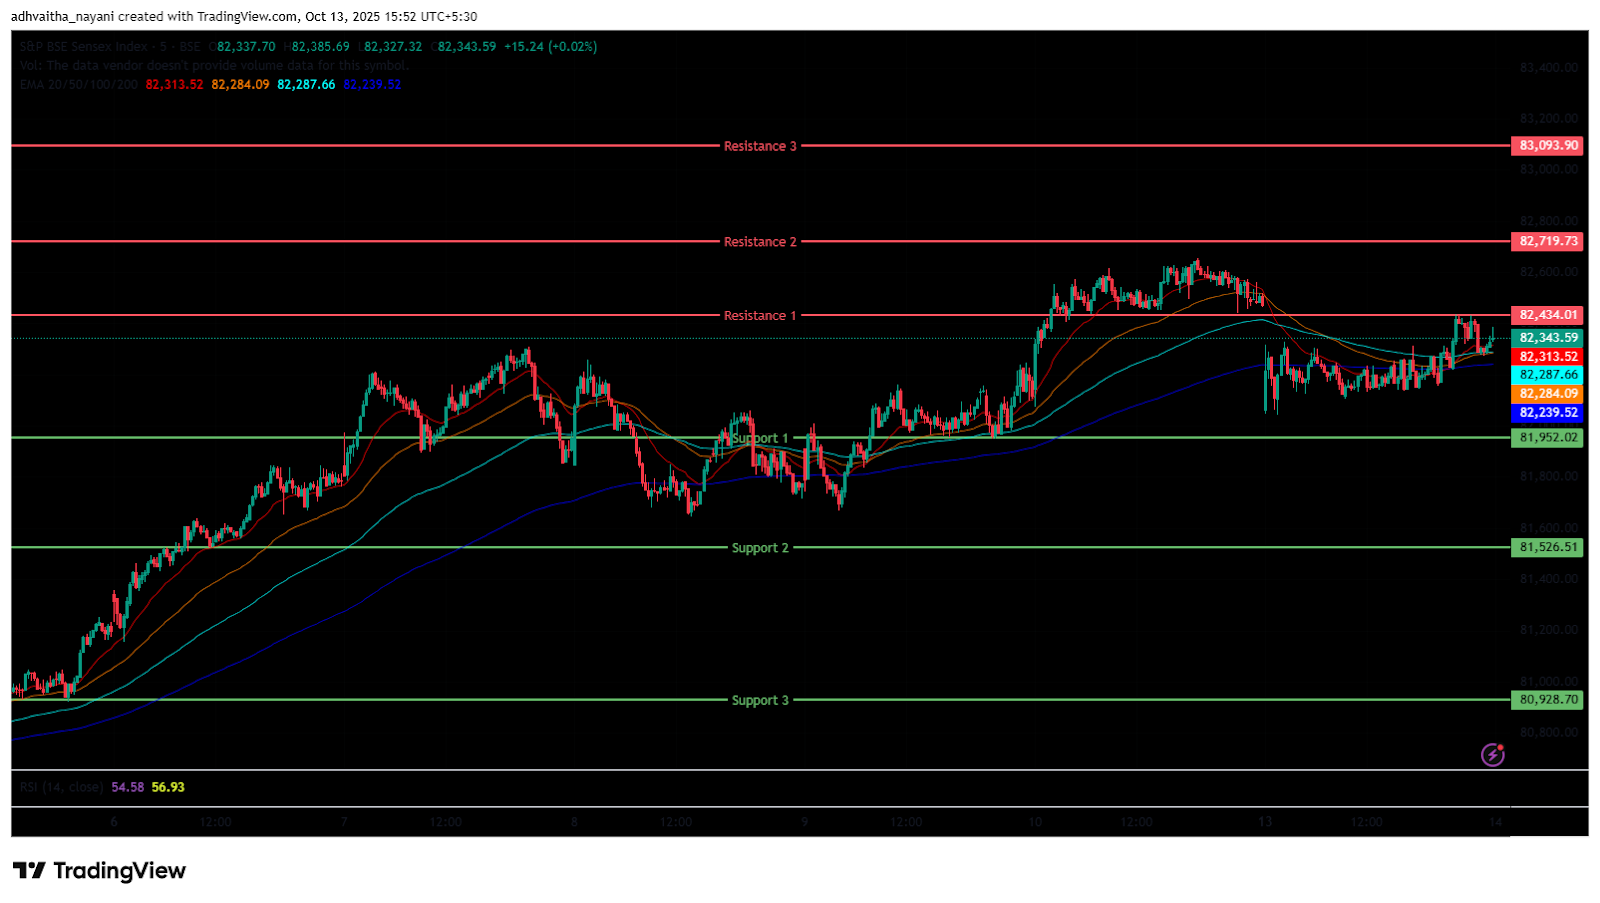
The BSE Sensex Index also opened on a negative note at 82,049.16 on Monday, down by 451.66 points from Friday’s closing of 82,500.82. The index started its session on a bearish note and was trading in the 82,000 and 82,350 range throughout the morning session and was below the EMAs of 20/50 but above the 100/200 EMAs in the 15-minute time frame. In the afternoon session, the Index recovered and surged as high as the 82,438 level, marking its day high.
Further, the Index was traded around 82,100 and 82,450, maintaining its overall bearish trend and closed above all four EMAs of 20/50/100/200 in the 15-minute time frame. BSE Sensex immediate resistance levels are R1 (82,434), R2 (82,720), and R3 (83,094), while immediate support levels are S1 (81,952), S2 (81,526), and S3 (80,929).
The BSE Sensex index had peaked at 82,438.50 and made a day’s low at 82,043.14. Finally, it had closed at 82,327.05 in red, losing 173.77 points or 0.21%. The Relative Strength Index (RSI) stood at 58.52 (below the overbought zone of 70) in the daily time frame, and the BSE Sensex closed above all four EMAs of 20/50/100/200 in the daily time frame.
India VIX
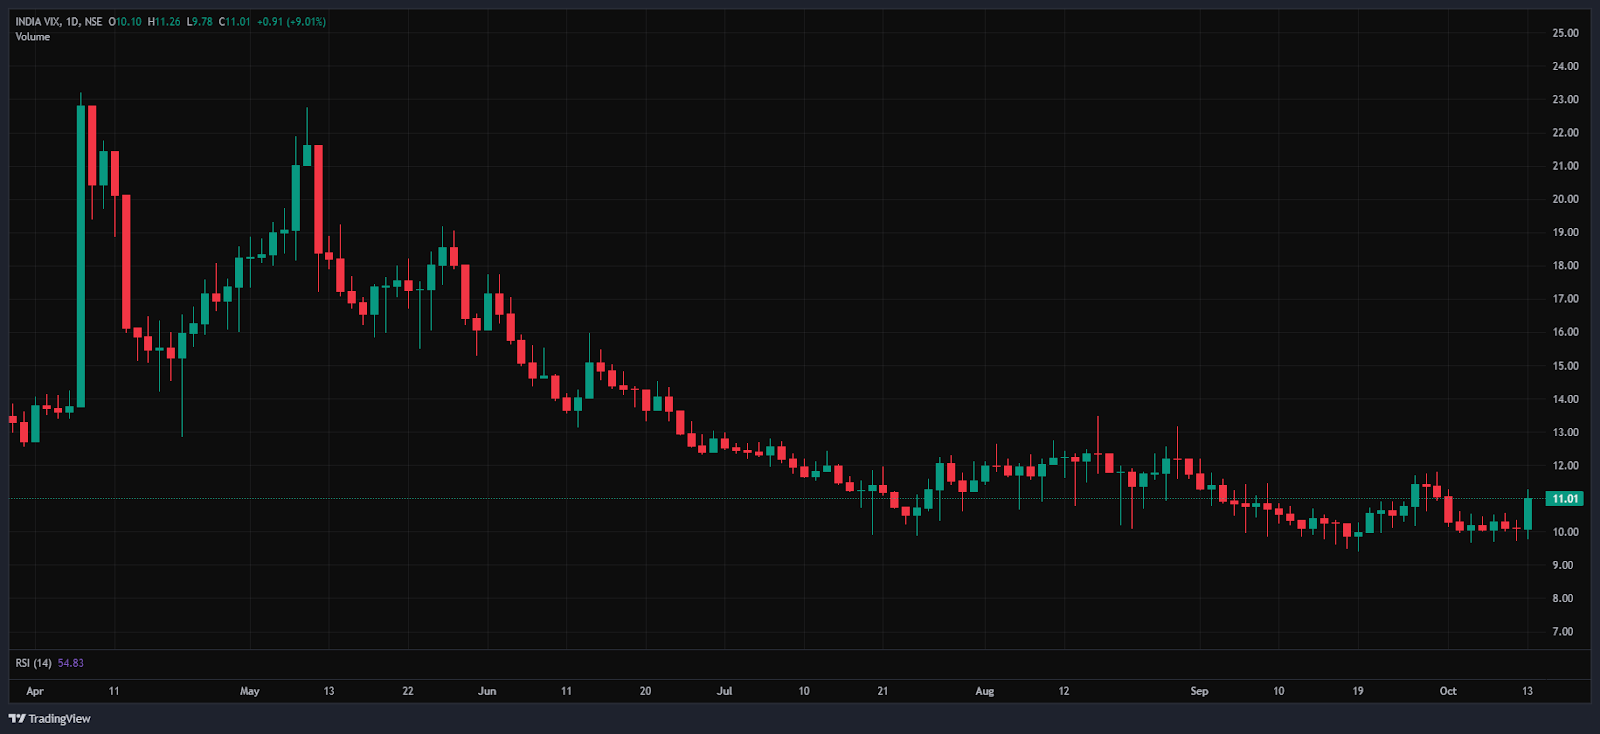
The India VIX increased by 0.90 points or 8.96%, from 10.10 to 11.01 during Monday’s session. An increase in the India VIX typically indicates higher price volatility in the stock market, suggesting a less stable market environment. However, a stable market environment and minimal volatility are anticipated when the India VIX is below 15.
Market Recap on the 13th of October 2025
On Monday, the Nifty 50 opened on a weak note at 25,177.3, down -108.05 points from its previous close of 25,285.35. The index slipped further during the session, hitting an intraday low of 25,152.3, before recovering slightly to close at 25,227.35, down by -58 points, or -0.23%. Technically, the index continued to trade above its key 20/50/100/200-day EMAs on the daily chart, indicating an overall bullish structure despite the day’s dip.
The BSE Sensex followed a similar trajectory, opening lower at 82,049.16, down -451.66 points from its previous close of 82,500.82. After fluctuating throughout the session, it settled at 82,327.05, marking a decline of -173.77 points, or -0.21%. Momentum indicators reflected moderate strength, with the Relative Strength Index (RSI) for the Nifty 50 at 58.5 and for the Sensex at 58.52, both comfortably below the overbought threshold of 70. The Nifty Bank Index closed slightly in the green, adding 15.25 points, or 0.027%, to end the day at 56,625.
The Nifty Capital Market Index emerged as the top sectoral gainer, closing at 4,565.55, up 104.7 points, or 2.4%. KFin Technologies Ltd surged 6.7%, while other capital market stocks such as UTI Asset Management Company Ltd, Aditya Birla Sun Life AMC Ltd, and BSE Ltd gained up to 4.6%.
The Nifty PSU Bank Index also posted modest gains, rising 18.15 points, or 0.2%, to close at 7,713.95. Among the top performers were Indian Bank, Union Bank of India, and Bank of Baroda, which rose by up to 0.9%. The Nifty Midcap 50 Index advanced as well, climbing 38.75 points, or 0.2%, to settle at 16,654.
On the downside, the Nifty FMCG Index was one of the top sectoral losers, ending the day at 54,473.85, down -492.6 points, or -0.90%. Godrej Consumer Products Ltd led the losses, falling -1.68%, followed by United Spirits Ltd at -1.56% and Hindustan Unilever Ltd at -1.43%.
The Nifty Consumer Durable Index also came under pressure, declining 325.35 points, or 0.84%, to close at 38,262.75. Stocks like Century Plyboards (India) Ltd, Voltas Ltd, Kalyan Jewellers India Ltd, and Blue Star Ltd dropped by up to 3.08%. The Nifty IT Index ended in negative territory as well, closing at 35,330.8, down -278.25 points, or -0.78%.
Asian markets mirrored the bearish sentiment on Monday. Hong Kong’s Hang Seng Index dropped -427.32 points, or -1.65%, to finish at 25,863. China’s Shanghai Composite Index slipped -7.53 points, or -0.19%, to close at 3,889.5. Japan’s Nikkei 225 Index declined 491.64 points, or 1.02%, ending at 48,088.8. South Korea’s KOSPI Index also ended in the red at 3,584.55, down -26.05 points, or -0.73%. As of 4:51 p.m. IST, US Dow Jones Futures were trading positively at 45,816.53, up 336.93 points, or 0.74%.
Trade Setup Summary
The Nifty 50 opened on a negative note at 25,177.30 on Monday and ended the session in the red below the 25,250 level at 25,227.35. A break below 25,122 could trigger further selling towards 25,006 while breaking the next resistance level of 25,260 could trigger bullishness towards the 25,362 level.
Bank Nifty started the session on a negative note at 56,337.05 but ended the session in the green at 56,625.00, above the 56,600 level. A break below 56,331 could trigger further selling towards 55,850, while breaking the next resistance level of 56,752 could trigger bullishness towards the 56,981 level.
Sensex also opened on a negative note at 82,049.16 and ended the session in the red at 82,327.05, below the 82,400 level. A break below 81,952 could trigger further selling towards 81,526, while breaking the next resistance level of 82,434 could lead towards the 82,720 level.
Given the ongoing volatility and mixed sentiments, it’s advisable to avoid aggressive positions and wait for clear directional moves above resistance or below support. Traders should consider these key support and resistance levels when entering long or short positions following the price break from these critical levels. Additionally, traders can combine moving averages to identify more accurate entry and exit points.
Disclaimer

The views and investment tips expressed by investment experts/broking houses/rating agencies on tradebrains.in are their own, and not that of the website or its management. Investing in equities poses a risk of financial losses. Investors must therefore exercise due caution while investing or trading in stocks. Trade Brains Technologies Private Limited or the author are not liable for any losses caused as a result of the decision based on this article. Please consult your investment advisor before investing.
About: Trade Brains Portal is a stock analysis platform. Its trade name is Dailyraven Technologies Private Limited, and its SEBI-registered research analyst registration number is INH000015729.
Investments in securities are subject to market risks. Read all the related documents carefully before investing.
Registration granted by SEBI and certification from NISM in no way guarantee performance of the intermediary or provide any assurance of returns to investors.
