
![]()
![]()
The Indian equity markets witnessed a subdued trading session on Tuesday, with major indices opening lower and sustaining losses throughout the day. Sentiment remained cautious as both benchmark indices, Nifty 50 and Sensex, traded below key psychological levels, reflecting mild selling pressure across broader sectors. Despite staying above key moving averages on the technical front, the market lacked upward momentum, suggesting investor hesitation amid broader global uncertainty. Momentum indicators such as the RSI remained in neutral zones, signalling the absence of strong buying conviction.

Sectoral trends painted a clear picture of risk aversion, with high-beta indices like PSU Banks, Consumer Durables, and Media bearing the brunt of the selloff. Mid- and small-cap stocks also came under pressure as broader market sentiment turned defensive. Globally, bearish cues from Asian peers added to the weakness, as concerns over economic recovery and geopolitical tensions weighed heavily.

The negative movement in U.S. futures further reinforced the risk-off mood, with traders possibly positioning cautiously ahead of key data releases or policy cues. Overall, the market sentiment was largely bearish, marked by profit booking and reduced risk appetite.
In this overview, we will analyse the key technical levels and trend directions for Nifty and BSE Sensex to monitor in the upcoming trading sessions. All the charts mentioned below are based on the 5-minute timeframe.
Nifty 50
(In this analysis, we have used 20/50/100/200 EMAs, where 20 EMA (Red), 50 EMA (Orange), 100 EMA (Light Blue), and 200 EMA (Dark Blue)).
To view other technical reports, click here
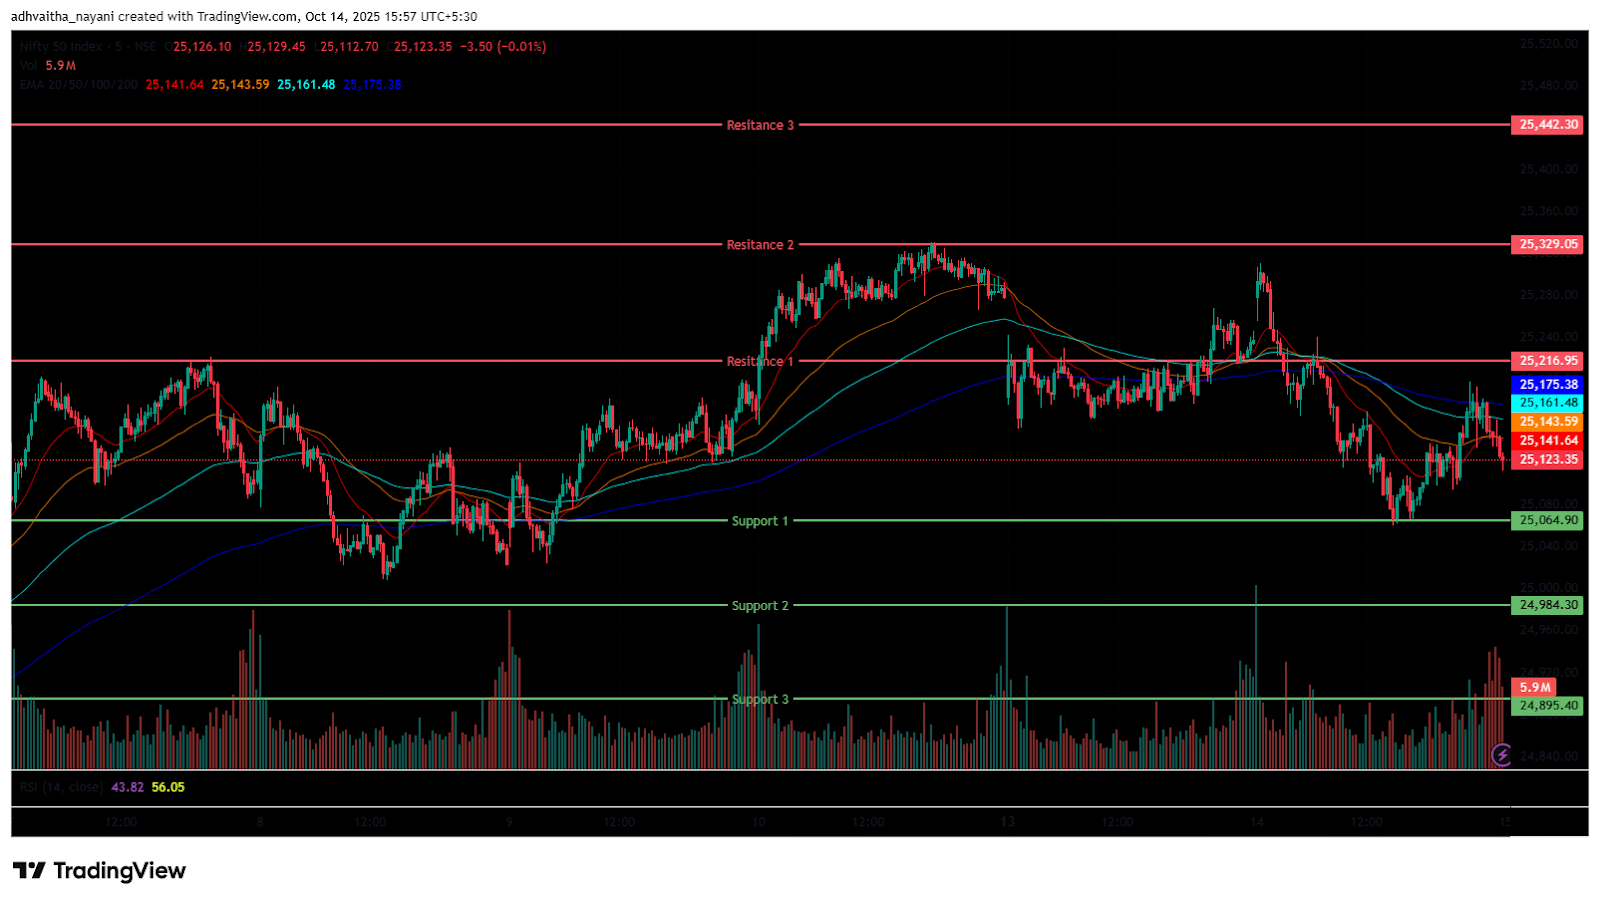
The Nifty 50 Index opened on a positive note at 25,277.55 on Tuesday, up by 50.2 points from Monday’s closing of 25,227.35. With a bullish start to the day, the index had a highly volatile morning session, trading in the 25,050 to 25,350 range. Additionally, the Index stood below all four EMAs of 20/50/100/200 in the 15-minute time frame during the morning session.
Further, the index recovered from the day’s low and surged as high as the 25,197 mark in the afternoon session and was traded in the range of 25,050 and 25,200. During the afternoon session, the Nifty 50 closed below the EMAs of 20/50/100 but above the 200 EMA in the 15-minute time frame. Nifty’s immediate resistance levels are R1 (25,217), R2 (25,329), and R3 (25,442), while immediate support levels are S1 (25,065), S2 (24,984), and S3 (24,895).
The Nifty index had reached a day’s high at 25,310.35 and saw a day’s low at 25,060.55. Finally, it had closed at 25,145.50, in red below the 25,150 level, losing 81.85 points, or 0.32%. The Nifty 50 closed above all four EMAs of 20/50/100/200 in the daily time frame.
Momentum Indicators
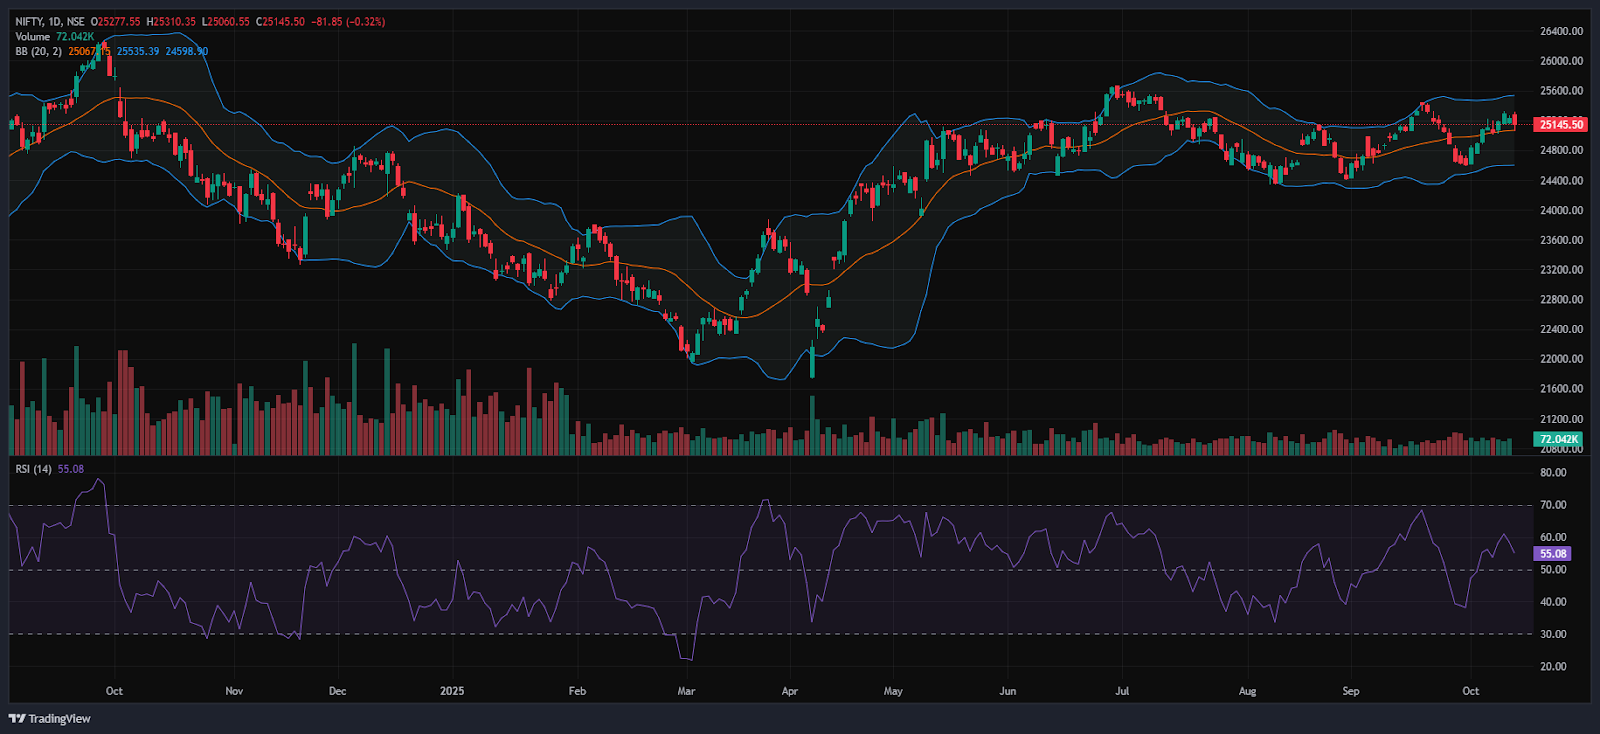
RSI (Daily): The Nifty 50’s RSI stood at 55.08, which is well below the overbought zone of 70, indicating a bullish sentiment and still has room to grow higher.
Bollinger Bands (Daily): The index is trading in the upper band of the Bollinger Band range above the middle band (Simple Moving Average). Its position in the upper range indicates a bullish sentiment and the Index took support of the Middle Band at 25,067 and pulled back to the 25,145 level. A sustained move above the middle band signals a bullish sentiment, while a drop back toward the lower band may reinforce bearish sentiment.
Volume Analysis: Tuesday’s trading session had average volumes, which stood at 292.13 Mn.
Derivatives Data: Options OI indicates strong Put writing at 25,100, followed by 25,000, establishing it as a firm support zone. On the upside, a significant Call OI buildup at 25,150 and 25,200 suggests a potential resistance supply. PCR (Put/Call Ratio) stands at 0.7426 (<1), leaning towards bullish sentiment and the Long Unwinding signals a strong bearish signal, with an overall mixed outlook for the next trading session.
Bank Nifty
(In this analysis, we have used 20/50/100/200 EMAs, where 20 EMA (Red), 50 EMA (Orange), 100 EMA (Light Blue), and 200 EMA (Dark Blue)).
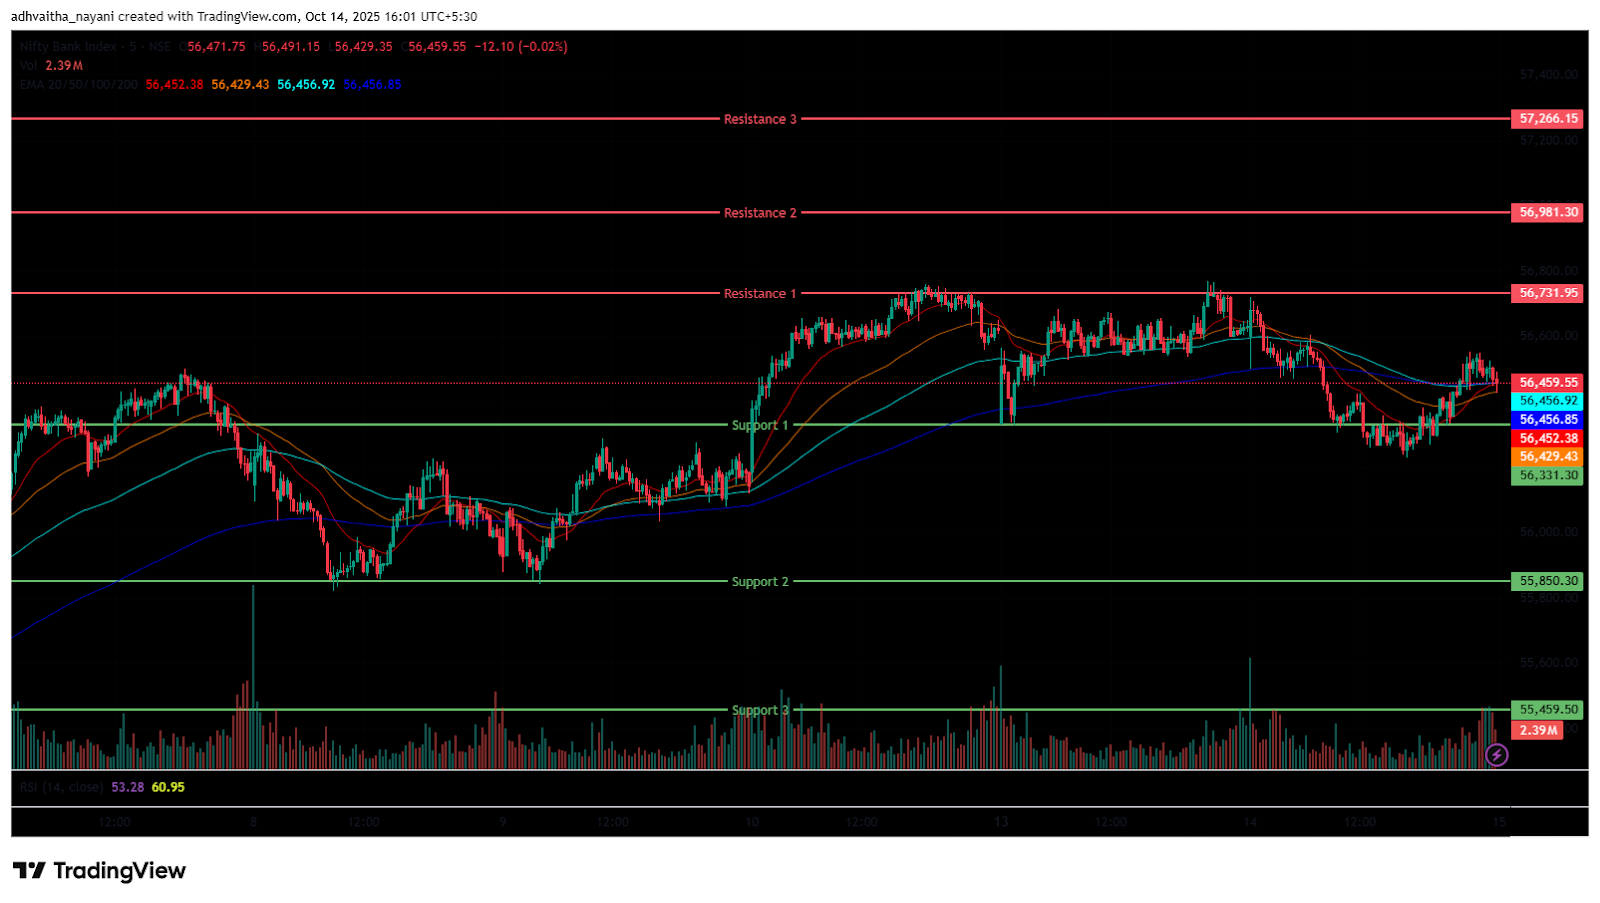
The Bank Nifty Index also started the session on a negative note at 56,598.65 on Tuesday, down by 26.35 points from Monday’s closing of 56,625.00. The index was trading between the range of 56,250 and 56,750 in the morning session, indicating high volatility. In addition, the index was trading below the EMAs of 20/50/100 but above the 200 EMA in the 15-minute time frame. In the afternoon session, the Index recovered from the day’s low and surged as high as the 56,552 level.
Further, the Index was trading in the range of 56,200 and 56,600, and ended in red below its opening level. During the afternoon session, Bank Nifty closed above all four EMAs of 20/50/100/200 in the 15-minute time frame. Bank Nifty immediate resistance levels are R1 (56,732), R2 (56,981), and R3 (57,266), while immediate support levels are S1 (56,331), S2 (55,850), and S3 (55,459).
The Bank Nifty index had peaked at 56,721.30 and made a day’s low at 56,230.15. Finally, it had closed in red at 56,496.45, closing below the 56,500 level, losing 128.55 points or 0.23%. The Relative Strength Index (RSI) stood at 64.45 well below the overbought zone of 70 in the daily time frame, and Bank Nifty closed above all four EMAs of 20/50/100/200 in the daily time frame.
Sensex
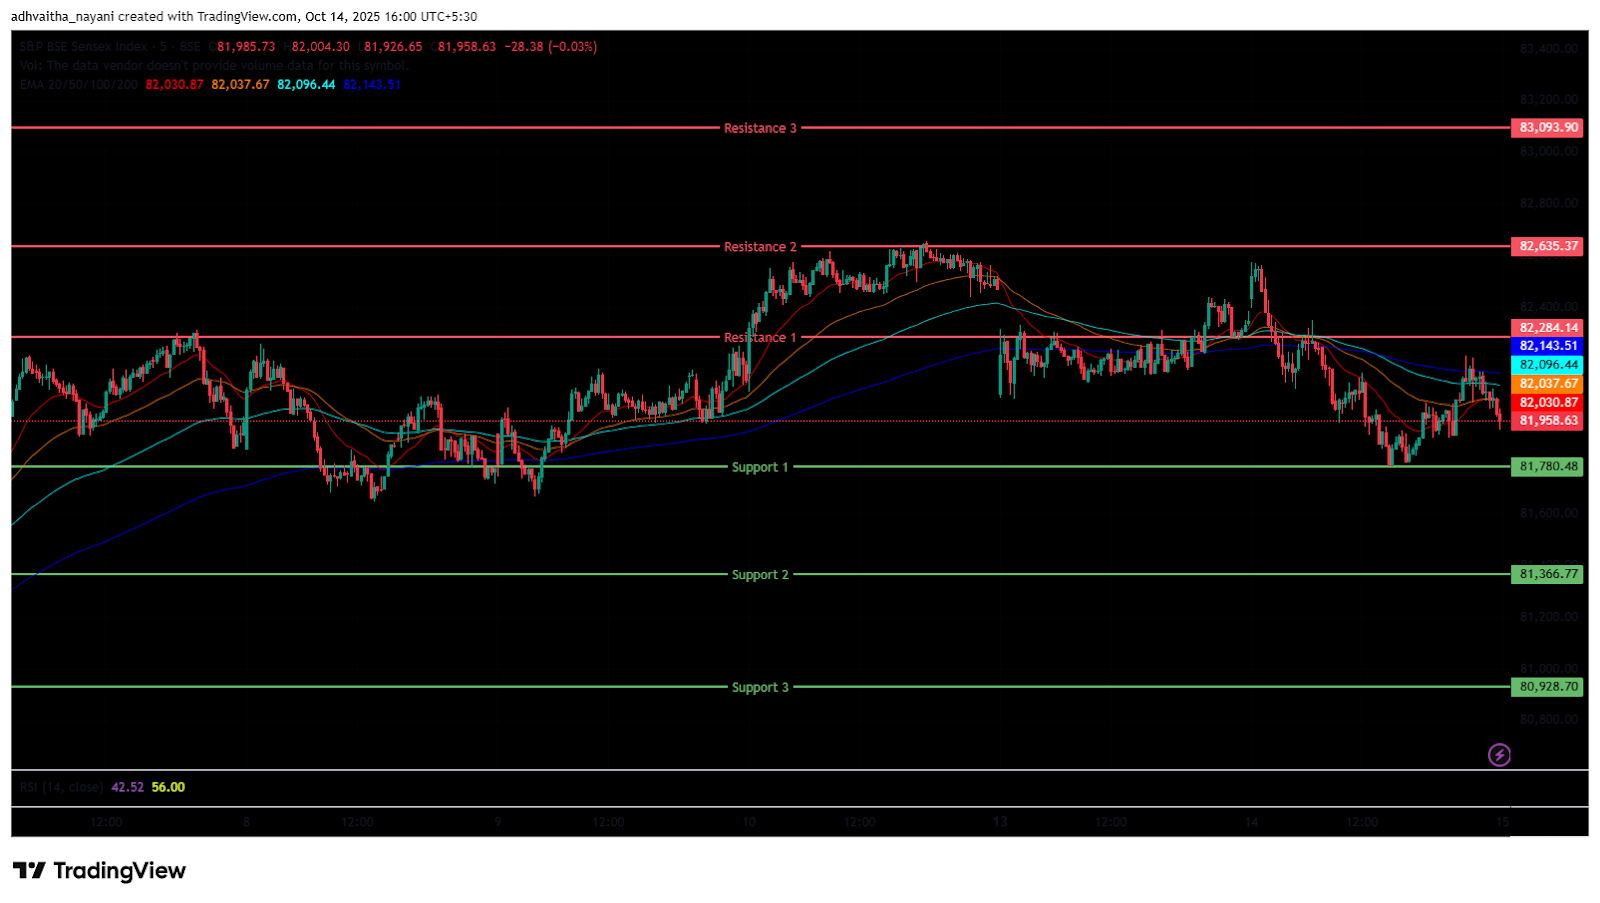
(In this analysis, we have used 20/50/100/200 EMAs, where 20 EMA (Red), 50 EMA (Orange), 100 EMA (Light Blue), and 200 EMA (Dark Blue)).
To view other technical reports, click here
The BSE Sensex Index also opened on a positive note at 82,404.54 on Tuesday, up by 77.49 points from Monday’s closing of 82,327.05. The index started its session on a bearish note and was trading in the 81,800 and 82,600 range throughout the morning session and was below all four EMAs of 20/50/100/200 in the 15-minute time frame.
In the afternoon session, the Index recovered from the day’s low and was traded around 81,800 and 82,250, maintaining its overall bearish trend and closing below the EMAs of 20/50/100 but above the 200 EMA in the 15-minute time frame. BSE Sensex immediate resistance levels are R1 (82,284), R2 (82,635), and R3 (83,094), while immediate support levels are S1 (81,780), S2 (81,367), and S3 (80,929).
The BSE Sensex index had peaked at 82,573.37 and made a day’s low at 81,781.62. Finally, it had closed at 82,029.98 in red, losing 297.07 points or 0.36%. The Relative Strength Index (RSI) stood at 54.71 (below the overbought zone of 70) in the daily time frame, and the BSE Sensex closed above all four EMAs of 20/50/100/200 in the daily time frame.
India VIX
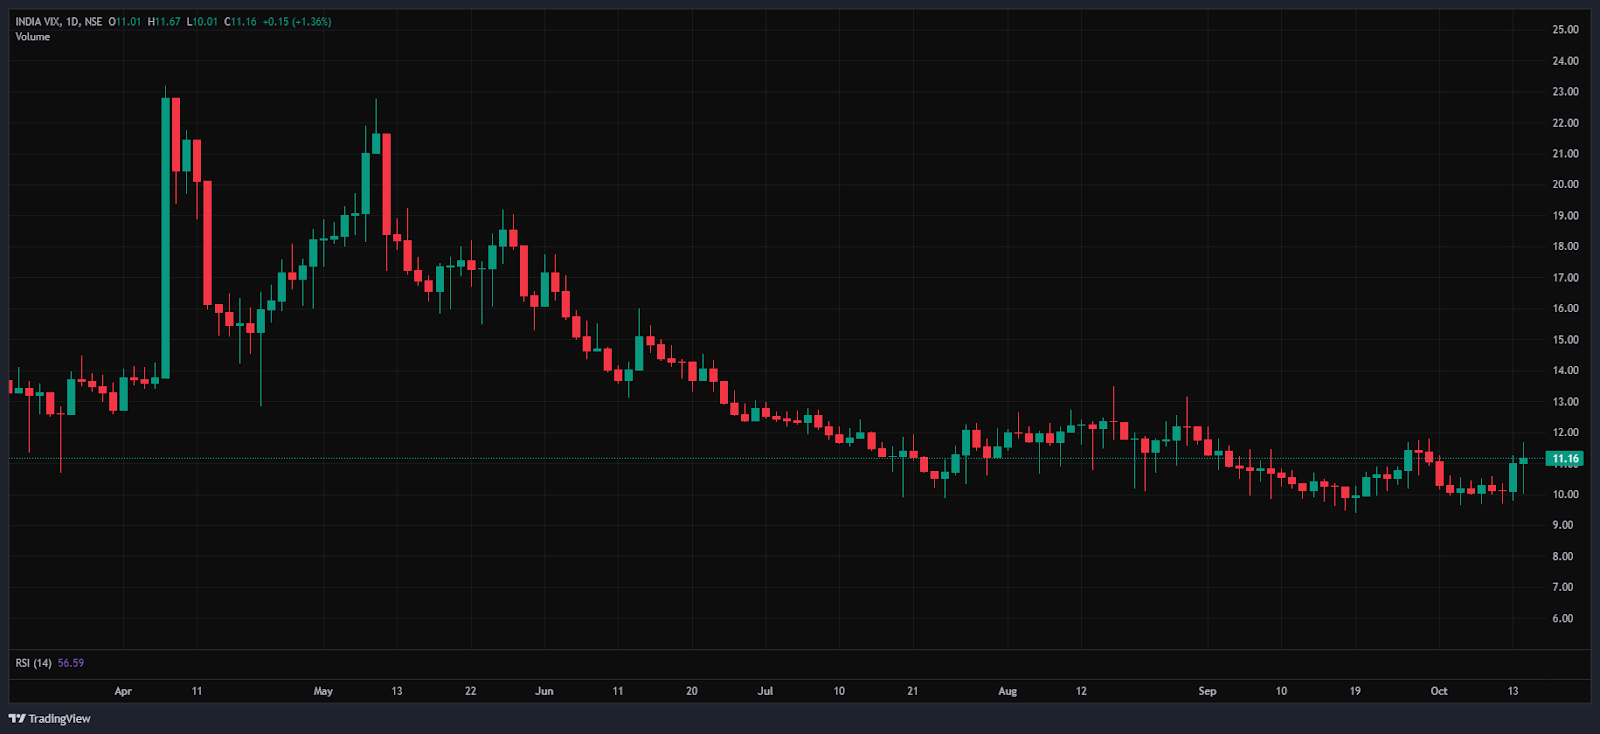
The India VIX increased by 0.15 points or 1.34%, from 11.01 to 11.16 during Tuesday’s session. An increase in the India VIX typically indicates higher price volatility in the stock market, suggesting a less stable market environment. However, a stable market environment and minimal volatility are anticipated when the India VIX is below 15.
Market Recap on the 14th of October 2025
On Tuesday, the Nifty 50 opened on a bearish note at 25,177.30, dropping 108.05 points from Monday’s close of 25,285.35. During the session, it touched an intraday low of 25,060.55 breaking below the 25,100 level before closing at 25,145.50, down 81.85 points or 0.32%. Technically, however, the index continued to trade above its 20/50/100/200-day EMAs on the daily chart. The BSE Sensex followed a similar trajectory, opening lower at 82,049.16 down 451.66 points from the previous close of 82,500.82.
It mirrored the Nifty 50’s movement throughout the day and ended at 82,029.98, down 297.07 points or 0.36%, closing below the 82,100 mark. Momentum indicators showed moderate strength, with the RSI for Nifty 50 at 55.39 and for Sensex at 54.31, both well below the overbought level of 70. Also, the Bank Nifty Index closed in negative territory, falling -128.55 points, or -0.23%, to end at 56,496.45. The decline was driven by pressure from the weekly F&O expiry, negative global signals, escalating US-China trade tensions, rising crude oil prices, and mixed Q2 earnings, all of which further weighed on market sentiment.
All Top indices were bearish on Tuesday. The Nifty PSU Bank index was the major loser, declining by -117.45 points or -1.52%, closing at 7,596.50. Bank of Maharashtra, UCO Bank, Indian Overseas Bank, and Central Bank of India all fell by up to -4.29%. Another major decline came in the Nifty Consumer Durable index as it fell -1.08% or -412.05 points, and closed at 37,850.70.
Stocks such as Dixon Technologies, Century Plyboards, PG Electroplast Ltd, and Bata India Ltd fell up to 3.26%. The Nifty Media Index followed the decline, closing at 1,547.25, down -16.10 points, or -1.03%. Nazara Technologies Ltd dropped -2.18%, while other media stocks like Tips Music Ltd, Sun TV Network Ltd, Network 18 Media, and Hathway Cable & Datacom Ltd slipped by up to -2.12%.
The Asian markets also showed a negative sentiment on Tuesday. Japan’s Nikkei 225 Index declined -1,415.80 points, or -3.03%, closing at 46,673.00. Hong Kong’s Hang Seng Index declined by -461.48 points, or -1.81%, to close at 25,428.00. Whereas, China’s Shanghai Composite Index was down at 3,865.23, losing -24.27 points, or -0.63%.
Similarly, Singapore’s Straits Times Index decreased by -35.32 points, or -0.81%, ending at 4,354.52. South Korea’s KOSPI Index closed lower at 3,561.81, down -22.74 points, or -0.64%. As of 4:42 p.m. IST, U.S. Dow Jones Futures were trading at 45,802.86, down -268.70 points, or -0.58%.
Trade Setup Summary
The Nifty 50 opened on a positive note at 25,277.55 on Tuesday but ended the session in the red below the 25,150 level at 25,145.50. A break below 25,065 could trigger further selling towards 24,984 while breaking the next resistance level of 25,217 could trigger bullishness towards the 25,329 level.
Bank Nifty started the session on a negative note at 56,598.65 and ended the session in the red at 56,496.45, below the 56,500 level. A break below 56,331 could trigger further selling towards 55,850, while breaking the next resistance level of 56,732 could trigger bullishness towards the 56,981 level.
Sensex also opened on a positive note at 82,404.54 but ended the session in the red at 82,029.98, below the 82,100 level. A break below 81,780 could trigger further selling towards 81,367, while breaking the next resistance level of 82,284 could lead towards the 82,635 level.
Given the ongoing volatility and mixed sentiments, it’s advisable to avoid aggressive positions and wait for clear directional moves above resistance or below support. Traders should consider these key support and resistance levels when entering long or short positions following the price break from these critical levels. Additionally, traders can combine moving averages to identify more accurate entry and exit points.
Disclaimer

The views and investment tips expressed by investment experts/broking houses/rating agencies on tradebrains.in are their own, and not that of the website or its management. Investing in equities poses a risk of financial losses. Investors must therefore exercise due caution while investing or trading in stocks. Trade Brains Technologies Private Limited or the author are not liable for any losses caused as a result of the decision based on this article. Please consult your investment advisor before investing.
About: Trade Brains Portal is a stock analysis platform. Its trade name is Dailyraven Technologies Private Limited, and its SEBI-registered research analyst registration number is INH000015729.
Investments in securities are subject to market risks. Read all the related documents carefully before investing.
Registration granted by SEBI and certification from NISM in no way guarantee performance of the intermediary or provide any assurance of returns to investors.
