
The Indian equity markets ended the week on a buoyant note, reflecting a broadly positive sentiment among investors. Optimism surrounding a potential rate cut by the US Federal Reserve, along with signs of easing trade tensions between the US and India, helped bolster confidence across the board. Both the Nifty 50 and Sensex maintained upward momentum throughout the session, closing firmly in the green. Technical strength was evident as key indices held above their crucial moving averages, indicating ongoing bullish undertones. Market breadth also favoured the bulls, with the majority of sectors ending the day with gains, reinforcing the prevailing positive mood.

Sectoral performance added further strength to the market’s tone, particularly with strong buying interest seen in public sector enterprises and metal stocks. These sectors were driven by favourable news flows, such as expansion plans and improved growth outlooks, which lifted investor sentiment. On the other hand, selective profit booking was visible in consumer goods and media stocks, suggesting a cautious approach in defensively positioned sectors. Overall, the mood remained constructive, supported by moderate momentum indicators and healthy global cues, positioning the markets well for continued strength in the near term.

In this overview, we will analyse the key technical levels and trend directions for Nifty and BSE Sensex to monitor in the upcoming trading sessions. All the charts mentioned below are based on the 5-minute timeframe.
Nifty 50
(In this analysis, we have used 20/50/100/200 EMAs, where 20 EMA (Red), 50 EMA (Orange), 100 EMA (Light Blue), and 200 EMA (Dark Blue)).
To view other technical reports, click here
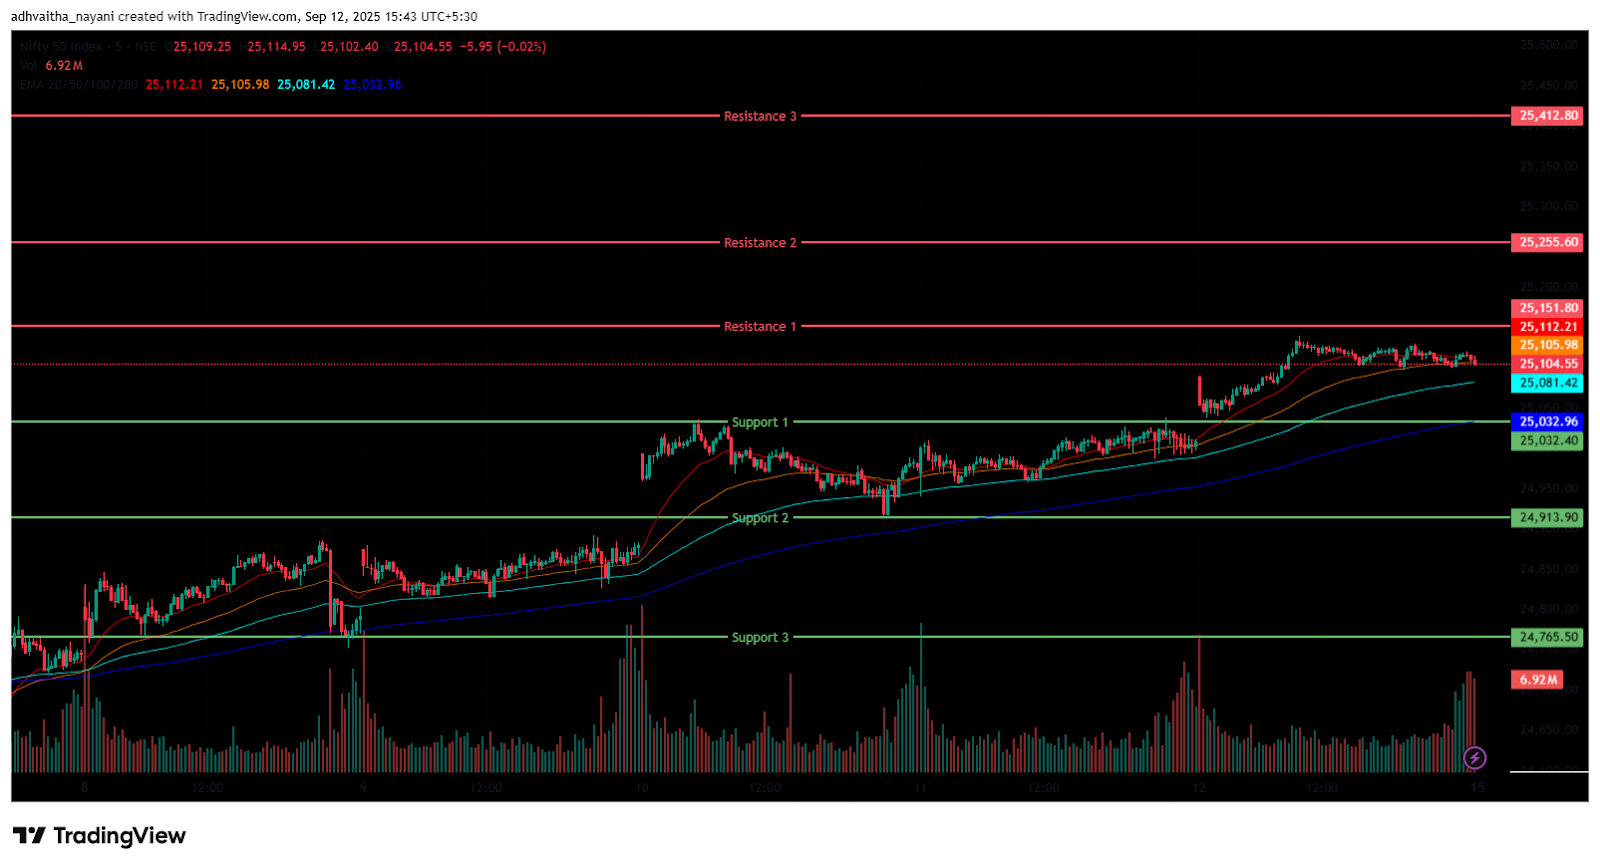
The Nifty 50 Index opened on a positive note at 25,074.45 on Friday, up by 68.95 points from Thursday’s closing of 25,005.50. The index began the day on a positive note but fell as low as 25,038, but it eventually recovered the day’s low and held above 25,100. The index fluctuated between 25,000 and 25,150 during the morning session, trading above its opening level at 25,116.8 and was above the 20/50/100/200 EMAs during the morning session’s 15-minute time frame.
Later, in the afternoon session, the index consolidated around the 25,099 and 25,130 level, trading in green. Overall, the index ended in a positive state on the Friday session. During the afternoon session, the Nifty 50 was traded above all four EMAs of 20/50/100/200 in the 15-minute time frame. Nifty’s immediate resistance levels are R1 (25,112), R2 (25,152), and R3 (25,413), while immediate support levels are S1 (25,032), S2 (24,914), and S3 (24,765).
The Nifty index had reached a day’s high at 25,139.45 and saw a day’s low at 25,038.05. Finally, it had closed at 25,114.00, in green above the 25,100 level, gaining 108.5 points, or 0.43%. The Nifty 50 closed above all four EMAs of 20/50/100/200 EMAs in the daily time frame.
Momentum Indicators
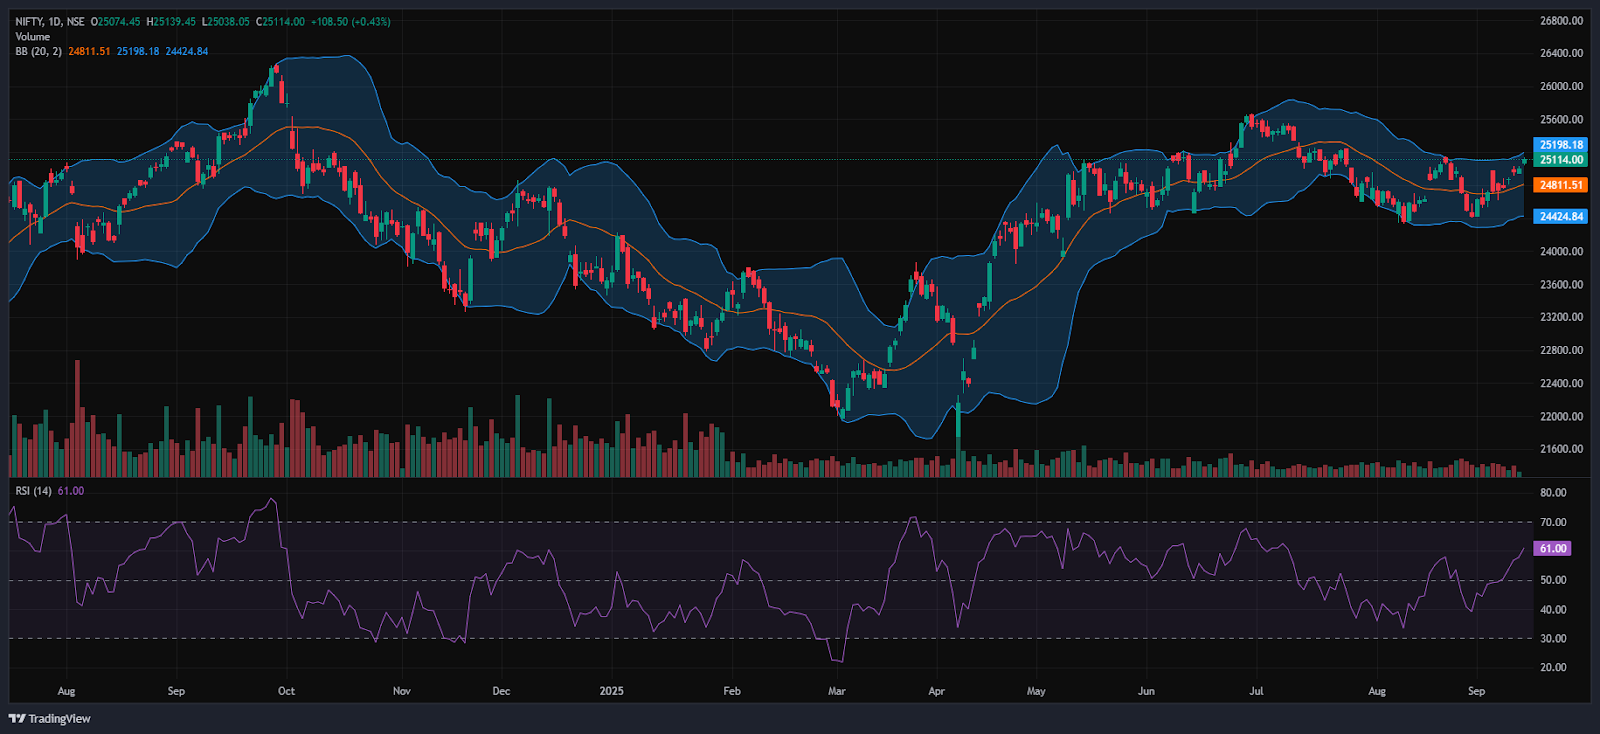
RSI (Daily): The Nifty 50’s RSI stood at 61, which is well below the overbought zone of 70, indicating a bullish sentiment.
Bollinger Bands (Daily): The index is trading in the upper band of its Bollinger Band range above the middle band (Simple Moving Average). Its position in the upper range, along with solid support around the 25,100 level. A sustained move above the middle band signals a bullish sentiment, while a drop back toward the lower band may reinforce bearish sentiment.
Volume Analysis: Friday’s trading session average volumes stood at 225.74 Mn.
Derivatives Data: Options OI indicates strong Put writing at 25,100, following 25,000, establishing it as a firm support zone. On the upside, a significant Call OI buildup at 25,200 and 25,300 suggests a potential resistance supply. PCR (Put/Call Ratio) stands at 1.3277 (>1), leaning towards bearish sentiment and the short covering signals a short-term bullish move, with an overall mixed outlook for the next trading session.
Bank Nifty
(In this analysis, we have used 20/50/100/200 EMAs, where 20 EMA (Red), 50 EMA (Orange), 100 EMA (Light Blue), and 200 EMA (Dark Blue)).
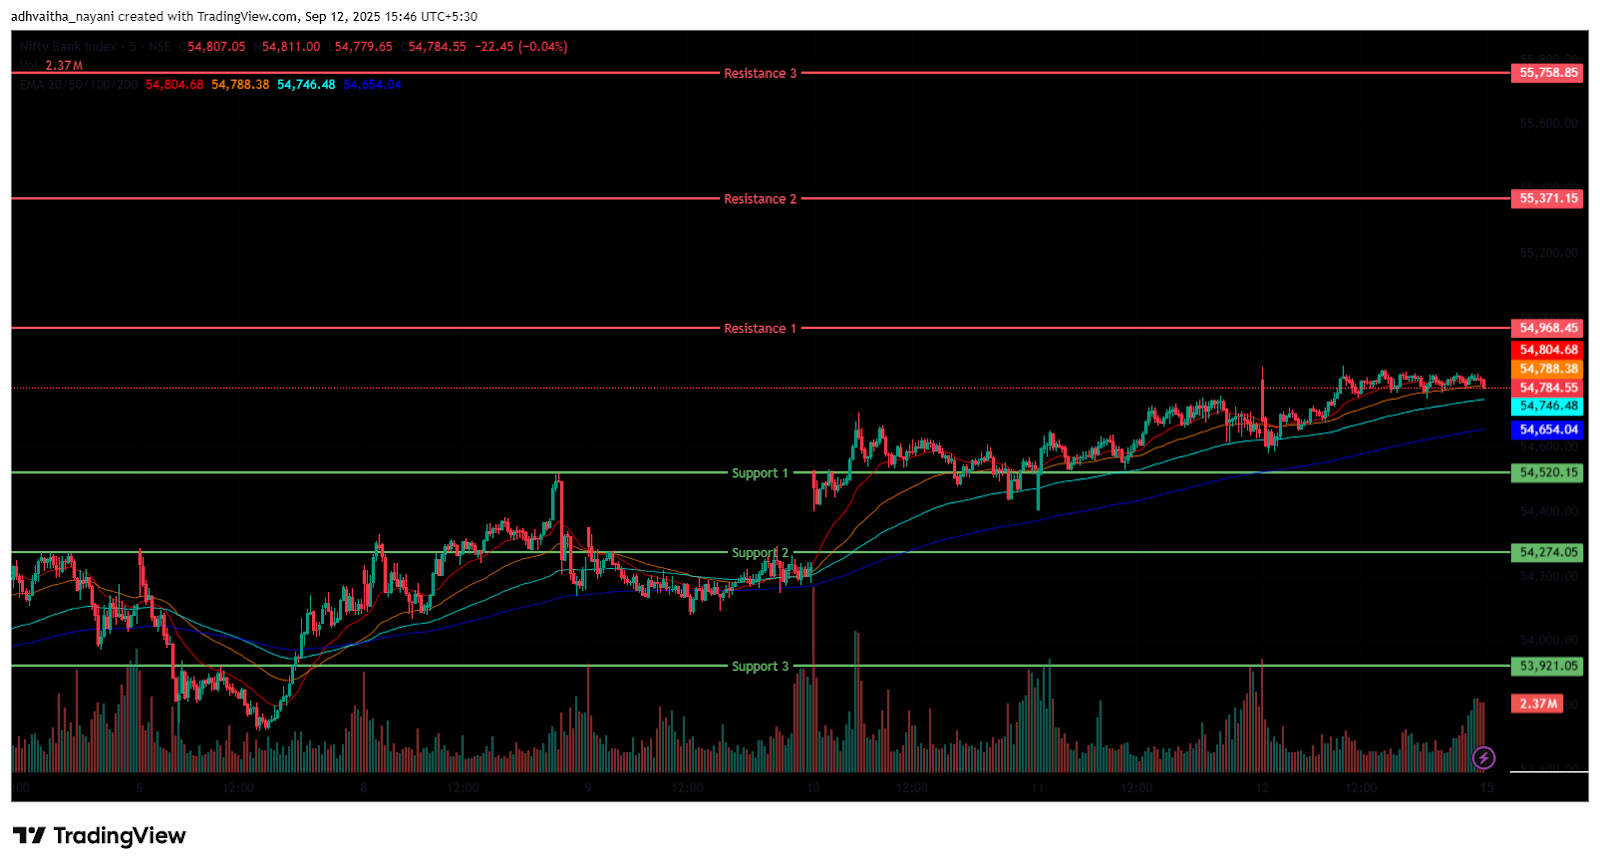
The Bank Nifty Index started the session on a positive note at 54,781.55 on Friday, up by 111.95 points from Thursday’s closing of 54,669.60. The index began on a bullish note but did not sustain the positive flow. The index lost its momentum in the morning session and dragged down to 54,580. But later the Index recovered from the day’s low, reaching 54,852 making its day high and was traded above its opening level at 54,815 in the morning session. The index was traded above all four EMAs of 20/100/50/200 in the 15-minute time frame and was trading between the 54,600 and 54,850 levels in the morning session.
The Bank Nifty index consolidated around the 54,750 and 54,850 levels during the afternoon session, trading in the green. During the afternoon session, Bank Nifty closed above all four EMAs of 20/50/100/200 in the 15-minute time frame. Bank Nifty immediate resistance levels are R1 (54,968), R2 (55,371), and R3 (55,759), while immediate support levels are S1 (54,520), S2 (54,274), and S3 (53,921).
The Bank Nifty index had peaked at 54,852.25 and made a day’s low at 54,580.35. Finally, it had closed in green at 54,809.30, breaking above the 54,800 level, gaining 139.70 points or 0.26%. The Relative Strength Index (RSI) stood at 49.68 well below the overbought zone of 70 and was balanced in the daily time frame, and Bank Nifty closed below the EMAs of 50/100 but remained above the 20/200 EMA in the daily time frame.
Sensex
(In this analysis, we have used 20/50/100/200 EMAs, where 20 EMA (Red), 50 EMA (Orange), 100 EMA (Light Blue), and 200 EMA (Dark Blue)).
To view other technical reports, click here
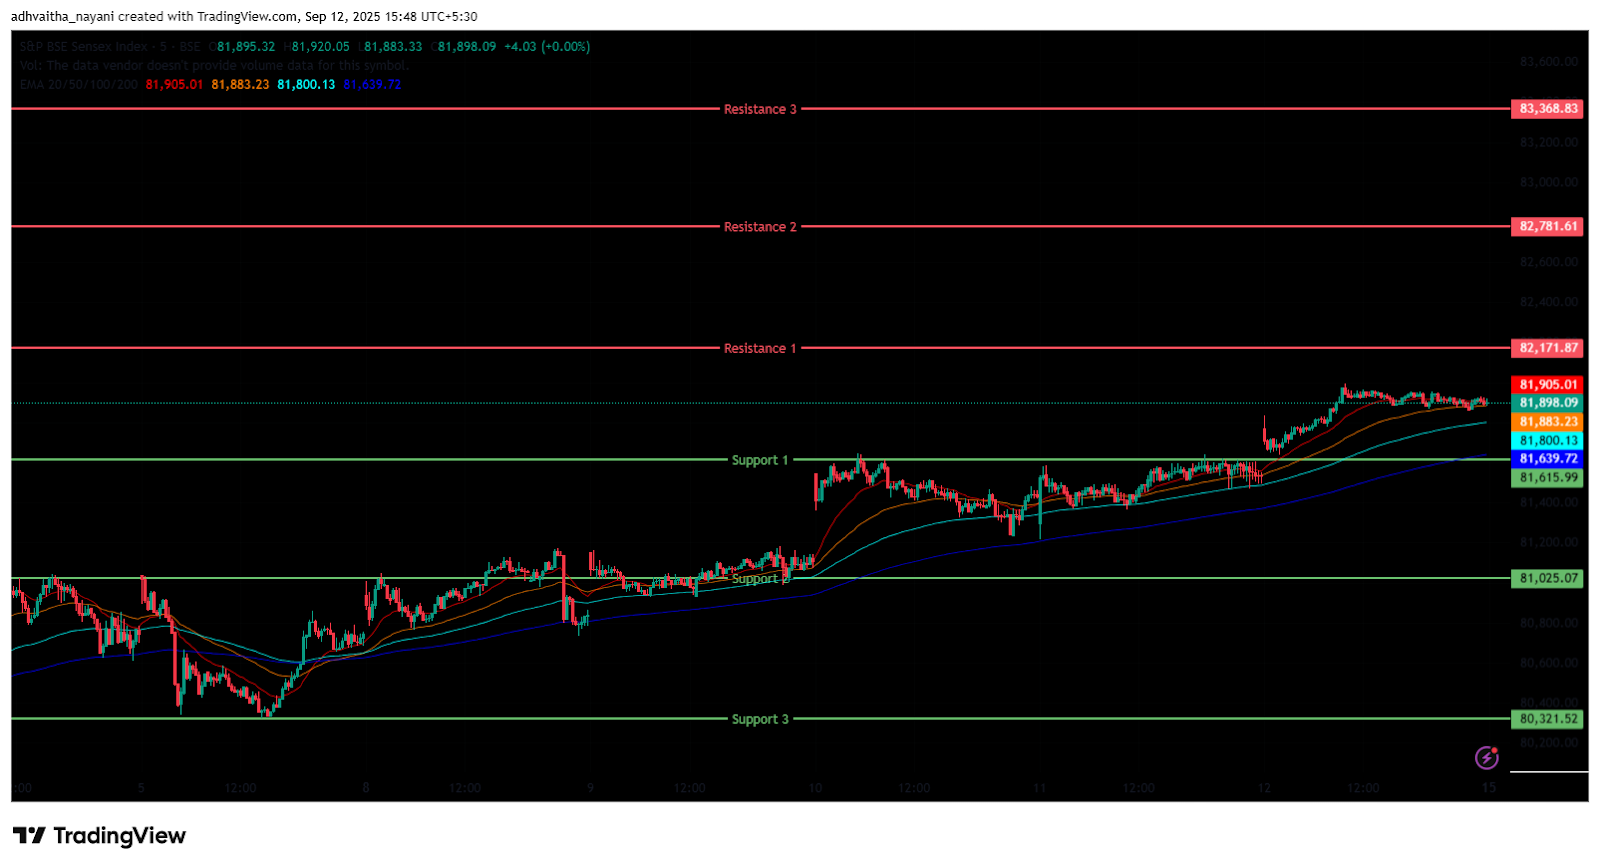
The BSE Sensex Index opened on a positive note at 81,758.95 on Friday, up by 210.22 points from Thursday’s closing of 81,548.73. The Index started on a bullish note in the morning session and surged to 81,993 making its day high and was above its opening level in the morning session at 81,924. The Index was traded above all four EMAs of 20/50/100/200 in the 15-minute time frame and was trading between 81,600 and 82,000 in the morning session.
In the afternoon session, the Sensex Index consolidated around the 81,850 and 81,950 level, trading in green. However, the Index managed to stay above the 81,900 level during the afternoon session, maintaining its overall positive trend, and was trading above all four EMAs of 20/50/100/200 in the 15-minute time frame. BSE Sensex immediate resistance levels are R1 (82,172), R2 (82,782), and R3 (83,369), while immediate support levels are S1 (81,616), S2 (81,025), and S3 (80,321).
The BSE Sensex index had peaked at 81,992.85 and made a day’s low at 81,641.38. Finally, it had closed at 81,904.70 in green, gaining 355.98 points or 0.44%. The Relative Strength Index (RSI) stood at 59.37 (below the overbought zone of 70) in the daily time frame, and the BSE Sensex closed above all four EMAs of 20/50/100/200 in the daily time frame.
India VIX
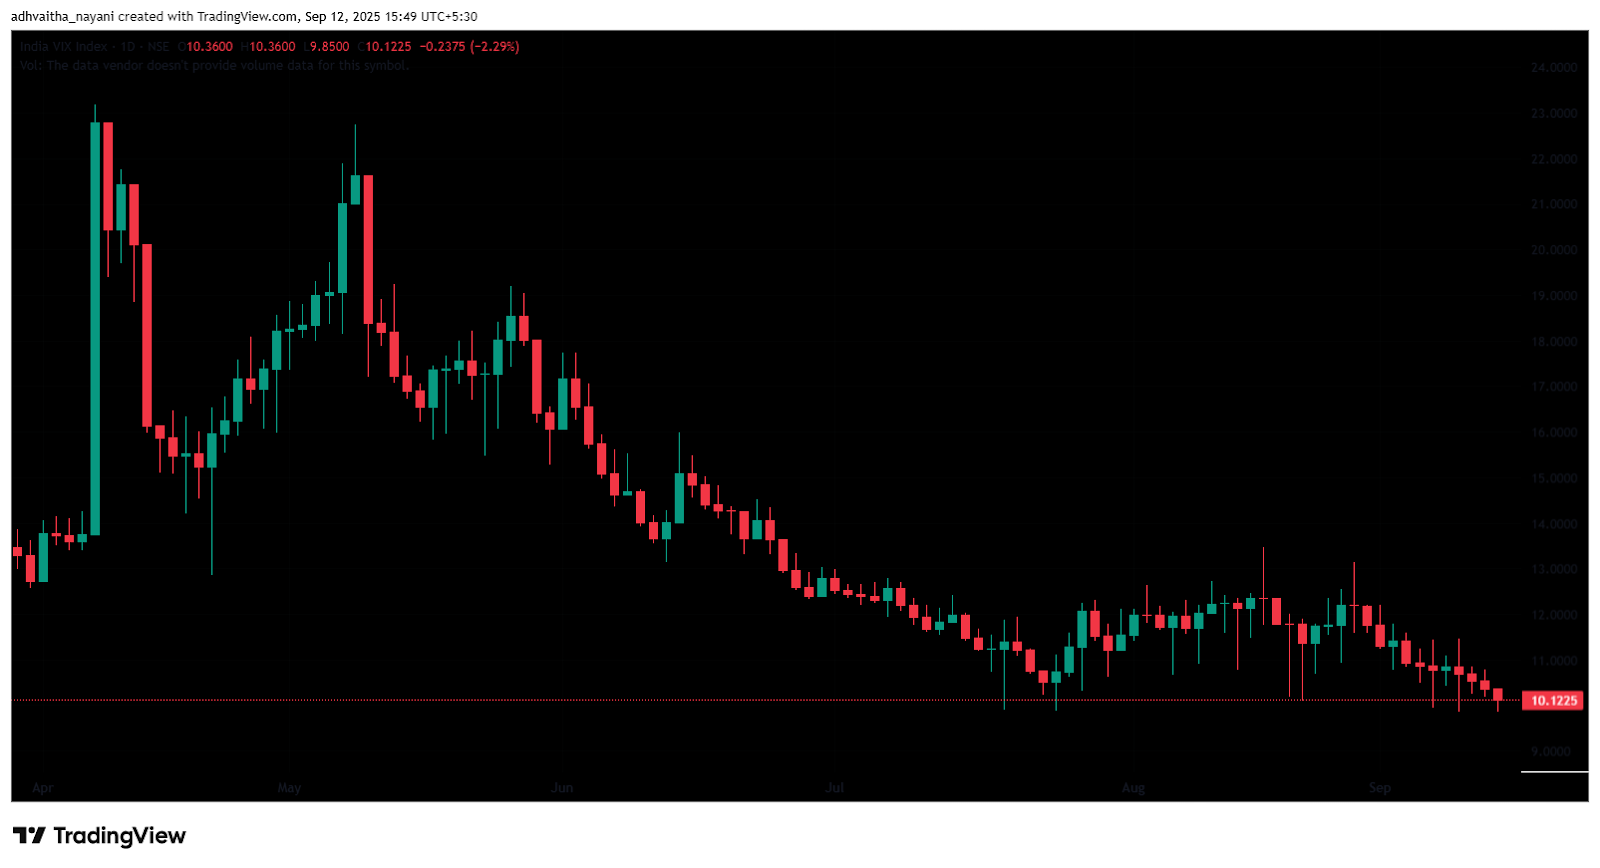
The India VIX decreased by 0.24 points or 2.29%, from 10.36 to 10.12 during Friday’s session. A decrease in the India VIX typically indicates lower price volatility in the stock market, suggesting a more stable market environment.
Market Recap on the 12th of September 2025
On Friday, the Nifty 50 opened on a bullish note at 25,074.45, up by 68.95 points from its previous close of 25,005.50. It hit an intraday high of 25,139.45 before closing the day at 25,114.00. This marked a gain of 108.50 points, or 0.43%. Technically, the index closed above all four key exponential moving averages (20/50/100/200-day) on the daily chart.
The BSE Sensex mirrored this movement, opening higher at 81,758.95, a rise of 210.22 points from the previous close of 81,548.73. It rose further through the session to close at 81,904.70, gaining 355.97 points, or 0.44%. Market sentiment remained positive, buoyed by investor optimism over a potential US Federal Reserve rate cut and easing trade tensions between the US and India.
Momentum indicators showed moderate strength, with the Nifty 50’s Relative Strength Index (RSI) at 61.00 and the Sensex RSI at 59.37, both comfortably below the overbought threshold of 70. The Bank Nifty Index also ended in the green, climbing 139.70 points, or 0.26%, to settle at 54,809.30.
Most sectoral indices ended in green on Friday, with only a few closing in the red. The Nifty CPSE Index was the top gainer, which rose 65.65 points, or 1.04%, to close at 6,402.3. Cochin Shipyard Ltd surged 5.72%, while other CPSE stocks such as Bharat Electronics Ltd, NLC India Ltd, and NHPC Ltd posted gains of up to 3.67%.
The Nifty Metal Index followed, finishing at 9,883.6 with a gain of 90.65 points, or 0.93%. Hindustan Copper Ltd emerged as the top performer in the sector, rising 12.66% as it announced plans to acquire new copper deposits both in India and overseas, while Hindustan Zinc Ltd climbed 3.74%, and Vedanta Ltd advanced 3.02%. The Nifty PSE Index also registered strong performance, closing at 9,658.65, up 67.95 points, or 0.71%.
On the downside, the Nifty FMCG Index was the biggest loser of the session, ending at 56,557.15, down -403.45 points, or -0.71%. Hindustan Unilever Ltd led the decline, falling -1.58%, while Godrej Consumer Products Ltd, Patanjali Foods Ltd, and Varun Beverages Ltd slipped up to 1.33%. The Nifty Media Index also closed lower at 1,621.05, down -6.40 points, or -0.39%. Key laggards included PVR Inox Ltd, Saregama India Ltd, Sun TV Network Ltd, and Tips Music Ltd, which lost up to -1.31%. The Nifty PSU Bank Index declined by -19.10 points, or -0.27%, to end the day at 7,057.05.
Asian markets also showed a bullish performance on Friday. Hong Kong’s Hang Seng Index ended in the green at 26,391.00, rising 304.68 points, or 1.15%. South Korea’s KOSPI Index rose by 51.34 points, or 1.51%, to close at 3,395.54. Japan’s Nikkei 225 Index also ended higher at 44,778.00, advancing 405.50 points, or 0.91%. In contrast, China’s Shanghai Composite Index fell and closed at 3,870.60, declining -4.71 points, or -0.12%. As of 4:36 p.m. IST, US Dow Jones Futures were trading down by -84.02 points, or -0.18%, at 46,023.98. This week, the Nifty index gained by 1.51%, or 373 points, closing above the 25,100 level.
Trade Setup Summary
The Nifty 50 opened on a positive note at 25,074.45 on Friday and ended the session in the green above the 25,100 level at 25,114.00. A break below 25,032 could trigger further selling towards 24,914, while breaking the next resistance level of 25,152 could trigger bullishness towards the 25,256 level.
Bank Nifty started the session on a positive note at 54,781.55 and ended the session in the green at 54,809.30, above the 54,800 level. A break below 54,520 could trigger further selling towards 54,274, while breaking the next resistance level of 54,968 could trigger bullishness towards the 55,371 level.
Sensex also opened on a positive note at 81,758.95 and ended the session in the green at 81,904.70, above the 81,900 level. A break below 81,616 could trigger further selling towards 81,025, while breaking the next resistance level of 82,172 could lead towards the 82,782 level.
Given the ongoing volatility and mixed sentiments, it’s advisable to avoid aggressive positions and wait for clear directional moves above resistance or below support. Traders should consider these key support and resistance levels when entering long or short positions following the price break from these critical levels. Additionally, traders can combine moving averages to identify more accurate entry and exit points.
Disclaimer

The views and investment tips expressed by investment experts/broking houses/rating agencies on tradebrains.in are their own, and not that of the website or its management. Investing in equities poses a risk of financial losses. Investors must therefore exercise due caution while investing or trading in stocks. Trade Brains Technologies Private Limited or the author are not liable for any losses caused as a result of the decision based on this article. Please consult your investment advisor before investing.
About: Trade Brains Portal is a stock analysis platform. Its trade name is Dailyraven Technologies Private Limited, and its SEBI-registered research analyst registration number is INH000015729.
Investments in securities are subject to market risks. Read all the related documents carefully before investing.
Registration granted by SEBI and certification from NISM in no way guarantee performance of the intermediary or provide any assurance of returns to investors.
