
Equity markets opened on a soft note but managed to recover through the day, supported by political stability after the NDA’s win in Bihar. Despite early weakness and continued foreign investor selling, both major indices held above key technical support levels and closed slightly higher. Momentum indicators stayed in the healthy zone, reflecting steady strength without entering overheated territory, even as broader sentiment remained cautious due to weak global cues.
Defence and public-sector banking stocks led the gains, with several companies in these segments showing strong upward moves. In contrast, technology and metal shares faced pressure, mirroring the subdued mood across Asian markets where major indices ended lower. Even so, the domestic market logged a weekly advance, supported by stable inflation readings and resilience in frontline indices.
In this overview, we will analyse the key technical levels and trend directions for Nifty and BSE Sensex to monitor in the upcoming trading sessions. All the charts mentioned below are based on the 15-minute timeframe.
NIFTY 50 Chart & Price Action Analysis
To view other technical reports, click here
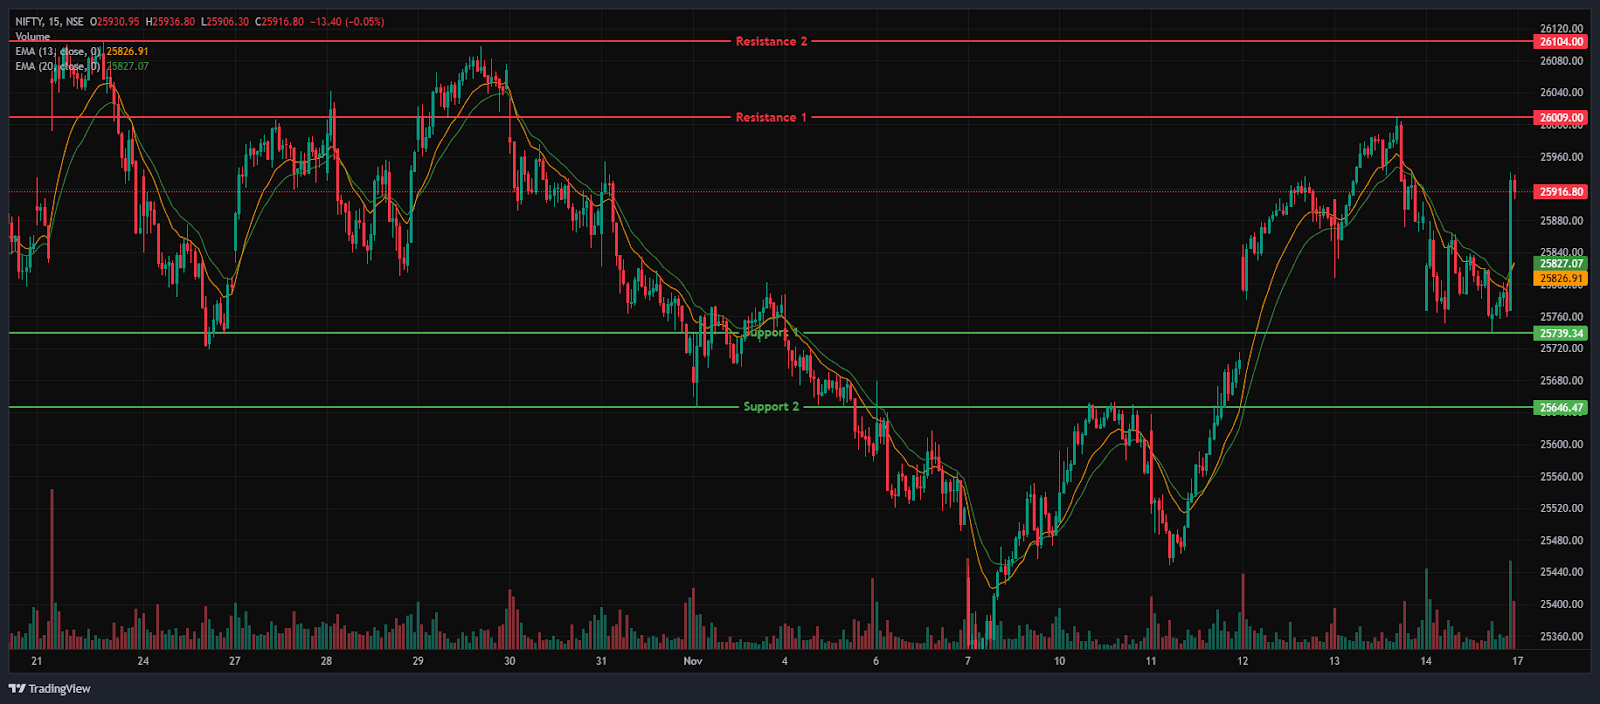
The Nifty 50 Index opened on a negative note at 25,767.90 on Friday, down by 111.25 points from Thursday’s closing of 25,879.15. The index opened on a gap-down note on Friday, hovering near the key level of 25,800. The index formed a range-bound trend in the morning session and was trading within the range of 25,750 and 25,900; however, in the afternoon session, it surged from its day’s low and settled above the 25,900 level, ending the session in Bullish.
The Nifty index had reached a day’s high at 25,940.20 and saw a day’s low at 25,740.80. Finally, it had closed at 25,910.05, marginally up, above the 25,900 level, up 30.90 points, or 0.12%. In the short term, the Index was above the 13/20 day EMA in the daily time frame, indicating an uptrend.
The index’s nearest resistance level is at 26,009 (R1), which it has failed to stay above multiple times. The higher resistance level is at 26,104 (R2), which is the 52-week high for the index. On the other hand, the closest support is now at 25,739 (S1), which was a previous resistance level but has turned into support. If the index falls below this, the next support level to watch is at 25,646 (S2).
Trade Setup:
| Nifty 50 | |
| Resistance 2 | 26,104.00 |
| Resistance 1 | 26,009.00 |
| Closing Price | 25,910.05 |
| Support 1 | 25,739.34 |
| Support 2 | 25,646.47 |
NIFTY 50 Momentum Indicators Analysis
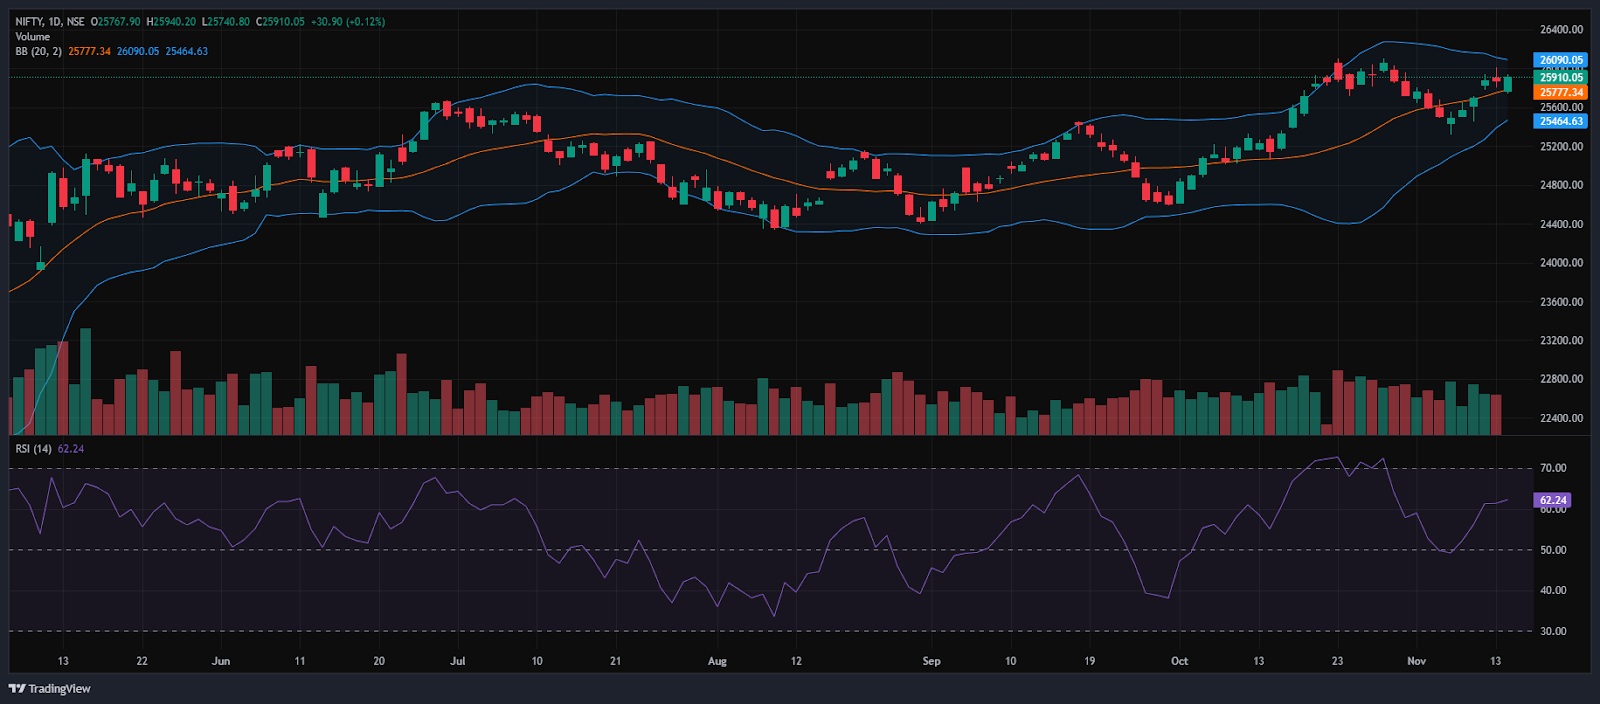
RSI (Daily): The Nifty 50’s RSI stood at 62.24, which is below the overbought zone of 70, indicating bullish sentiment and room to grow higher.
Bollinger Bands (Daily): The index is trading in the upper band of the Bollinger Band range (Simple Moving Average). Its position in the upper range suggests a bullish sentiment and in Friday’s session, the Index formed a large bullish candle with minimal wicks on both ends and ended on a bullish note. The index took support near 25,741, and 25,940 acted as a resistance level. A sustained move above the middle band signals a bullish sentiment, while a drop back toward the lower band may reinforce bearish sentiment.
Volume Analysis: Friday’s trading session had an above-average volume of 518.94 Mn.
Derivatives Data: Options OI indicates strong Put writing at 25,900, followed by 25,800, establishing a strong support zone. On the upside, a significant Call OI buildup at 26,000 and 26,100 suggests a potential supply of resistance. PCR (Put/Call Ratio) stands at 0.8 (<1), leaning towards bullish sentiment, and the short Buildup indicates that traders are increasing their short positions in anticipation of a price decline, which signals a bearish outlook, thus overall indicating a mixed outlook for the next trading session.
Bank Nifty Chart & Price Action Analysis
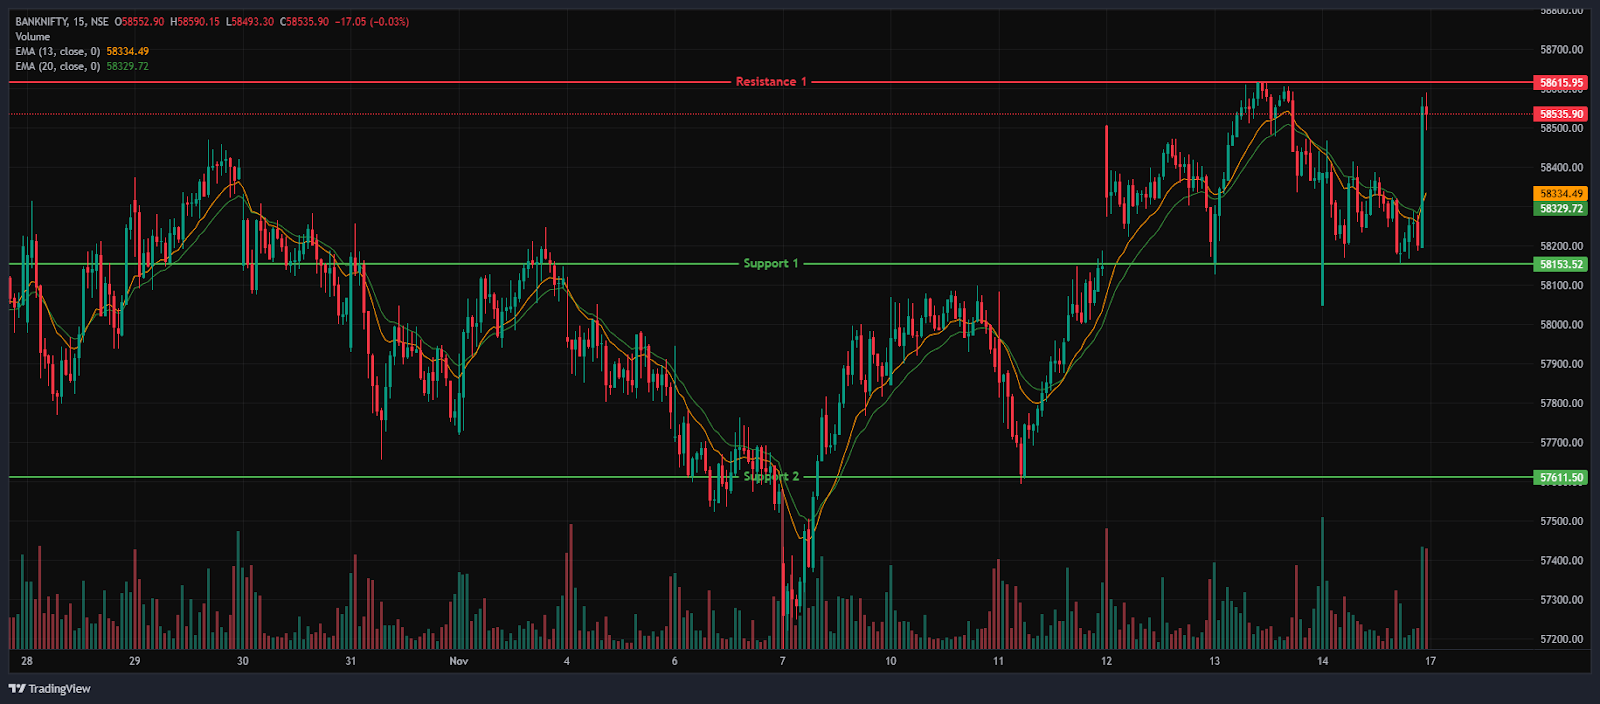
The Bank Nifty Index opened on a negative note at 58,050.00 on Friday, down by 331.95 points from Thursday’s closing of 58,381.95. The index opened on a negative note and dragged down to the 58,050 level, marking its day low in the morning session, but later recovered from the day’s low and was trading between the 58,000 and 58,500 levels. In the afternoon session, the index rallied from low to peak at the 58,590 level, marking its day high and traded between the range of 58,150 and 58,600.
The Bank Nifty index had peaked at 58,590.15 and made a day’s low at 58,050.00. Finally, it had closed in green at 58,517.55, rising above the 58,500 level, gaining 135.60 points or 0.23%. The Relative Strength Index (RSI) stood at 67.08, below the overbought zone of 70 in the daily time frame. In the short term, the Index was above the 13/20 day EMA in the daily time frame, indicating an uptrend.
The higher resistance level is at 58,615.95 (R1), which is near to the 52-week high for the index. On the other hand, the closest support is now at 58,153.52 (S1), which were previous resistance levels but have turned into support. If the index falls below this, the next support level to watch is at 57,611.5 (S2).
Trade Setup:
| Bank Nifty | |
| Resistance 1 | 58,615.95 |
| Closing Price | 58,517.55 |
| Support 1 | 58,153.52 |
| Support 2 | 57,611.50 |
BSE Sensex Chart & Price Action Analysis
To view other technical reports, click here
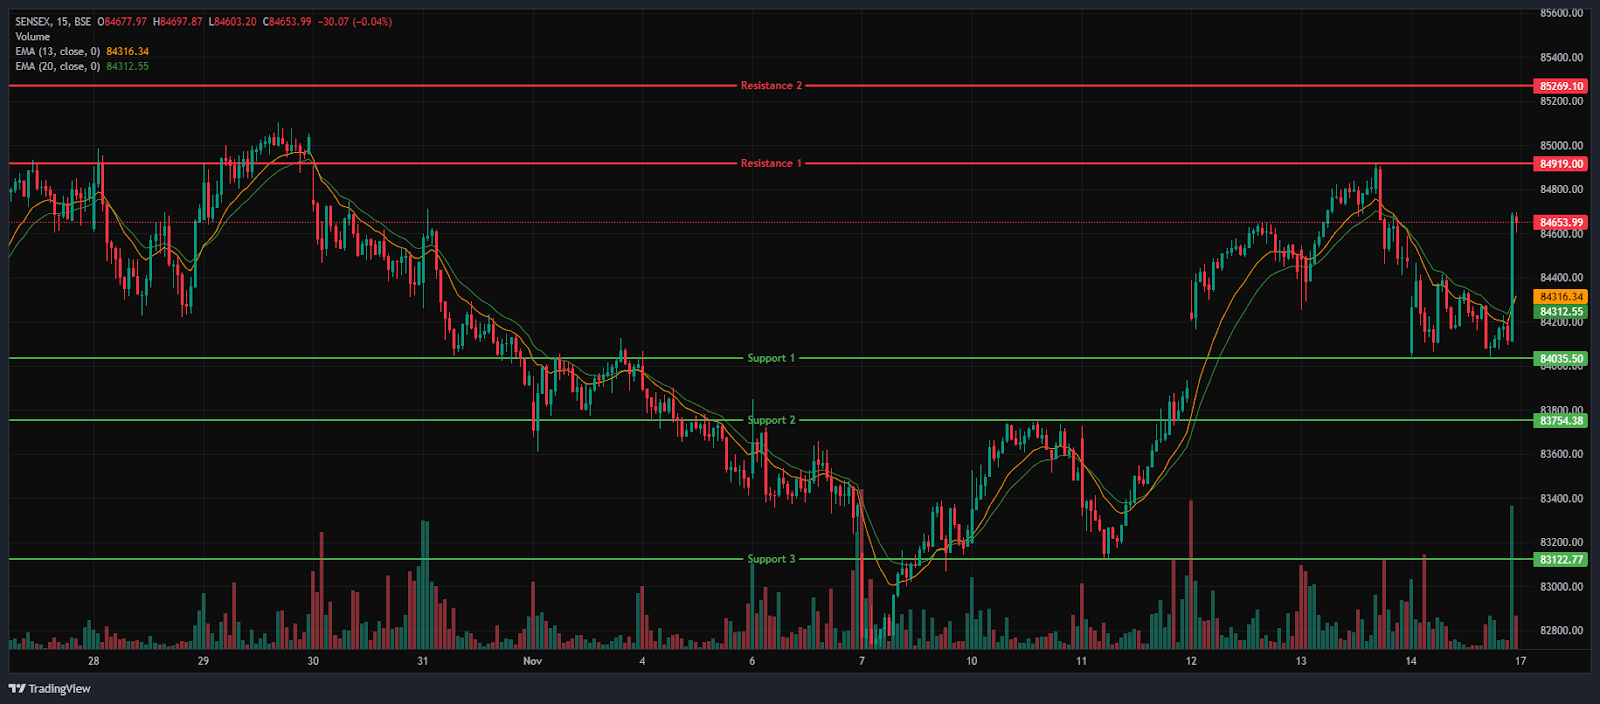
The BSE Sensex Index opened on a negative note at 84,060.14 on Friday, down by 418.53 points from Thursday’s closing of 84,478.67. The Sensex index opened on a gap-down note and dragged down to the 84,000 level and was traded between the range of 84,000 and 84,500 during the morning session. In the afternoon session, the index fell as low as the 84,029 level, marking its day low and later recovered from the day’s low to peak at the day’s high at 84,698. The Index was traded between the range of 84,000 and 84,700.
The BSE Sensex index had peaked at 84,697.87 and made a day’s low at 84,029.32. Finally, it had closed at 84,562.78 in green, gaining 84.11 points or 0.1%. The Relative Strength Index (RSI) stood at 62.55, below the overbought zone of 70 in the daily time frame. In the short term, the Index was above the 13/20 day EMA in the daily time frame, indicating an uptrend.
The index faces immediate resistance at 84,919 (R1), levels it has struggled to sustain above. The next key resistance is at 85,269.1 (R2), near its 52-week high. On the downside, support lies at 84,035.5 (S1) and 83,754.38 (S2), both former resistance levels, with a deeper support at 83,122.77 (S3) if these are breached.
Trade Setup:
| Sensex | |
| Resistance 2 | 85,269.10 |
| Resistance 1 | 84,919.00 |
| Closing Price | 84,562.78 |
| Support 1 | 84,035.50 |
| Support 2 | 83,754.38 |
| Support 3 | 83,122.77 |
Market Recap on November 14th, 2025
On Friday, the Nifty 50 opened lower at 25,767.9, down -111.25 points from its previous close of 25,879.15. The index hit an intraday low of 25,740.8 and closed at 25,910.05, slightly up 30.9 points, or 0.12%. The index closed above all key moving averages (20/50/100/200-day EMAs) on the daily chart. The BSE Sensex followed the same trajectory, opening on a negative trend at 84,060.14, down -418.53 points from the previous close of 84,478.67. It closed at 84,562.78, up 84.11 points, or 0.1%.
Both indices showed high momentum, with RSI values for Nifty 50 at 62.24 and Sensex at 62.55, below the overbought threshold of 70. Both indices recovered from the day’s low amidst the victory of the NDA in Bihar. Yet the equity benchmarks settled flat as FIIs sold for the fourth consecutive day, and weak global cues held the investor sentiments subdued.
The Nifty Defence index was the major gainer, rising 1.4% or 111.55 points, and standing at 8,287.85. Stocks such as Paras Defence rose 6.6%, followed by Bharat Dynamics Ltd and Dynamatic Technologies Ltd, which gained up to 6.3% on Friday. The Nifty PSU Bank index was also among the biggest gainers, rising 1.2% or 96.85 points, and standing at 8,399.9. Stocks such as Bank of Maharashtra jumped 1.8% on Friday. While other PSU Bank stocks like Canara Bank, State Bank of India, and Bank of India also gained up to 1.8%.
On the Sectoral Losers, the Nifty IT Index was the biggest loser, falling -1.03%, or -378.20 points, to 36,301. IT stocks like Infosys Ltd, Mphasis Ltd, and Oracle Financial Services Ltd saw declines of up to -2.53%. The Nifty Metal Index also fell on Friday’s trade, ending at 10,494, down -93.85 or -0.89%.
Asian markets had a negative sentiment on Friday. Japan’s Nikkei 225 declined by -908.83 points or -1.80%, closing at 50,373.00. China’s Shanghai Composite decreased by -39.01 points, or -0.98%, to 3,990.49, while Hong Kong’s Hang Seng Index also declined by -479.03 points, or -1.80%, to close at 26,594.00. On the other hand, South Korea’s KOSPI fell by -159.06 points or -3.97%, closing at 4,011.57. This week, the broad indices Nifty 50 and Sensex rose by 1.45% and 1.32% respectively. The consumer price index (CPI) inflation for rural, urban and combined for October was 0.25 (provisional).
India VIX
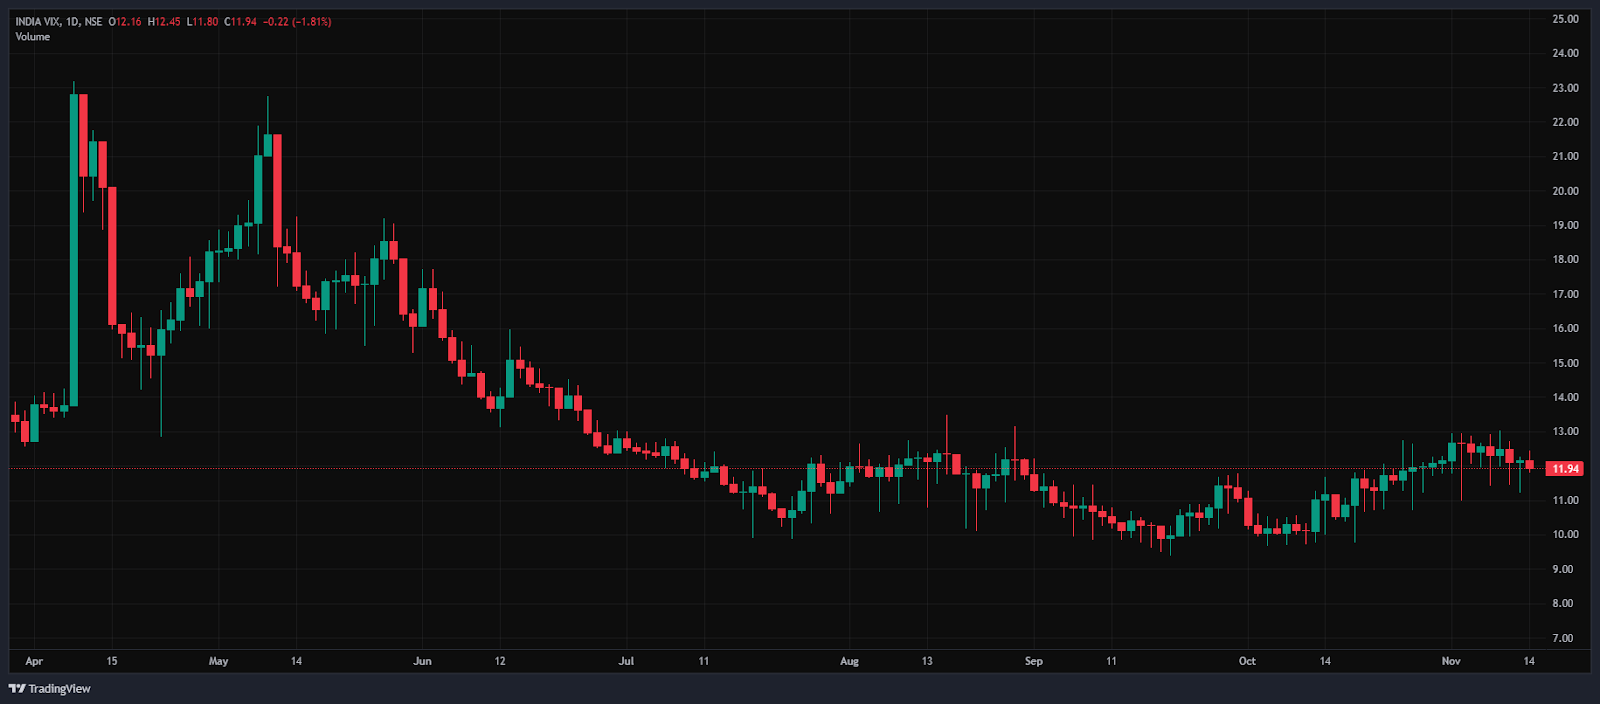
The India VIX decreased 0.23 points or 1.85%, from 12.16 to 11.94 during Friday’s session. A decrease in the India VIX typically indicates lower price volatility in the stock market, suggesting a more stable market environment. However, a stable market environment and minimal volatility are anticipated when the India VIX is below 15.
Given the ongoing volatility and mixed sentiments, it’s advisable to avoid aggressive positions and wait for clear directional moves above resistance or below support. Traders should consider these key support and resistance levels when entering long or short positions following the price break from these critical levels. Additionally, traders can combine moving averages to identify more accurate entry and exit points.
Disclaimer

The views and investment tips expressed by investment experts/broking houses/rating agencies on tradebrains.in are their own, and not that of the website or its management. Investing in equities poses a risk of financial losses. Investors must therefore exercise due caution while investing or trading in stocks. Trade Brains Technologies Private Limited or the author are not liable for any losses caused as a result of the decision based on this article. Please consult your investment advisor before investing.
About: Trade Brains Portal is a stock analysis platform. Its trade name is Dailyraven Technologies Private Limited, and its SEBI-registered research analyst registration number is INH000015729.
Investments in securities are subject to market risks. Read all the related documents carefully before investing.
Registration granted by SEBI and certification from NISM in no way guarantee performance of the intermediary or provide any assurance of returns to investors.
