
The markets reflected a positive sentiment on Tuesday, as both the Nifty 50 and the Sensex maintained their upward trajectory throughout the session. The broader trend remained bullish, supported by strong technical indicators and sustained movement above key moving averages. Investor confidence seemed to strengthen, particularly as the indices held firm despite a relatively flat start. The overall momentum suggested that buyers were in control, with profit-taking appearing limited and sectoral breadth largely positive.

Among sectors, auto and realty stocks led the rally, signalling optimism around domestic consumption and infrastructure development. The strong showing in these segments was complemented by gains in banking and infrastructure-related counters, adding further resilience to the market mood.

On the flip side, FMCG stocks showed mild weakness, possibly reflecting near-term concerns around valuations or input costs. Global cues were mixed but largely steady, with most Asian markets in the green and US futures pointing to a mildly positive opening.
In this overview, we will analyse the key technical levels and trend directions for Nifty and BSE Sensex to monitor in the upcoming trading sessions. All the charts mentioned below are based on the 5-minute timeframe.
Nifty 50
(In this analysis, we have used 20/50/100/200 EMAs, where 20 EMA (Red), 50 EMA (Orange), 100 EMA (Light Blue), and 200 EMA (Dark Blue)).
To view other technical reports, click here
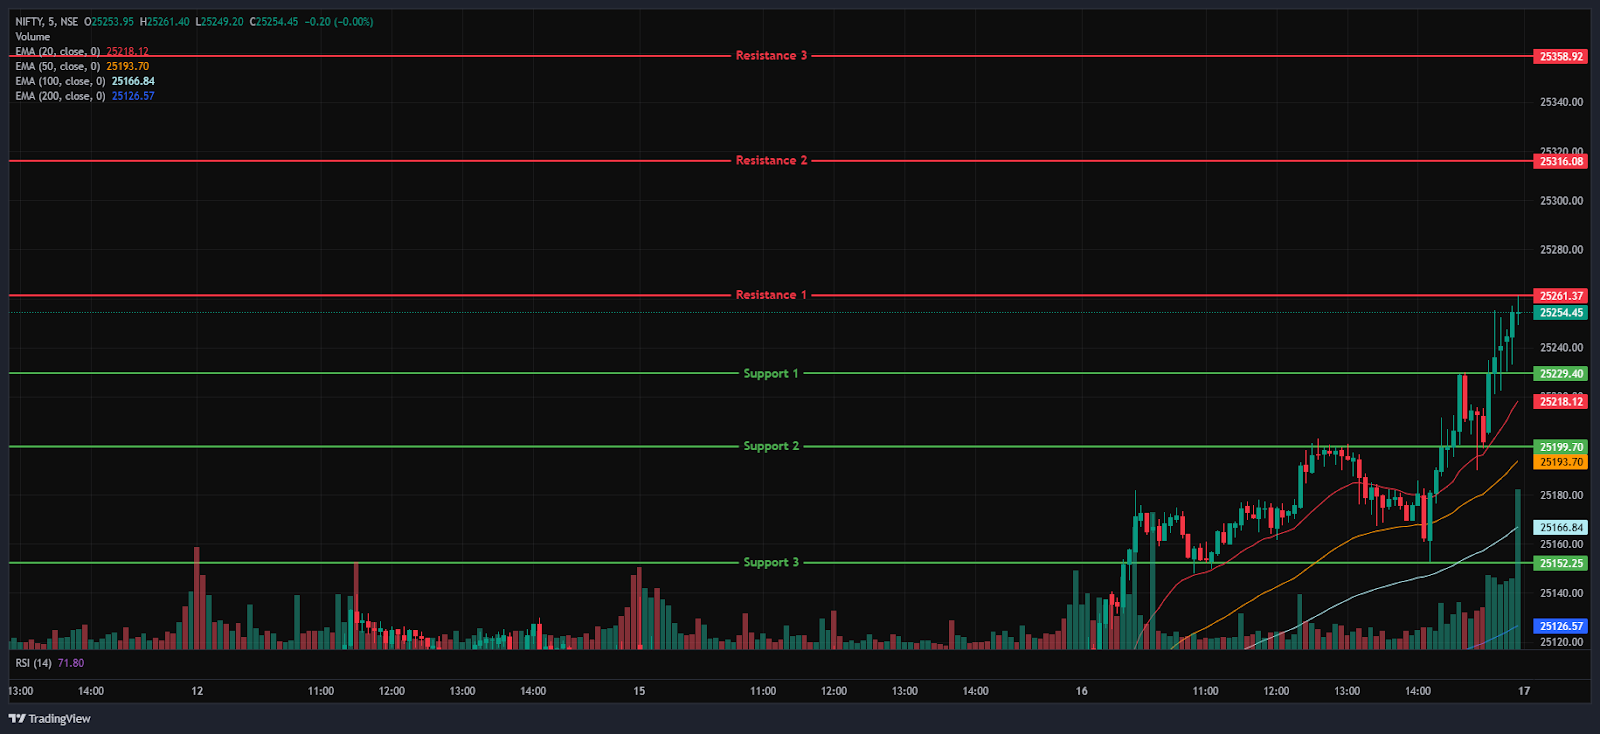
The Nifty 50 Index opened on a flat positive note at 25,073.60 on Tuesday, up by 4.4 points from Monday’s closing of 25,069.20. With a positive start to the day, the index jumped over the 25,200 mark in the morning session and closed above its opening level at 25,203. Additionally, the Index stood above all four EMAs of 20/50/100/200 in the 15-minute time frame during the morning session, which saw it trade between 25,050 and 25,200.
Later in the afternoon session, the index reached its day high of 25,261 and continued to rise, trading in green, above the 25,230 level. Overall, the index ended in a bullish state on the Tuesday session. During the afternoon session, the Nifty 50 was traded above all four EMAs of 20/50/100/200 in the 15-minute time frame. Nifty’s immediate resistance levels are R1 (25,261), R2 (25,316), and R3 (25,359), while immediate support levels are S1 (25,229), S2 (25,200), and S3 (25,152).
The Nifty index had reached a day’s high at 25,261.40 and saw a day’s low at 25,070.45. Finally, it had closed at 25,239.10, in green above the 25,200 level, gaining 169.90 points, or 0.68%. The Nifty 50 closed above all four EMAs of 20/50/100/200 EMAs in the daily time frame.
Momentum Indicators
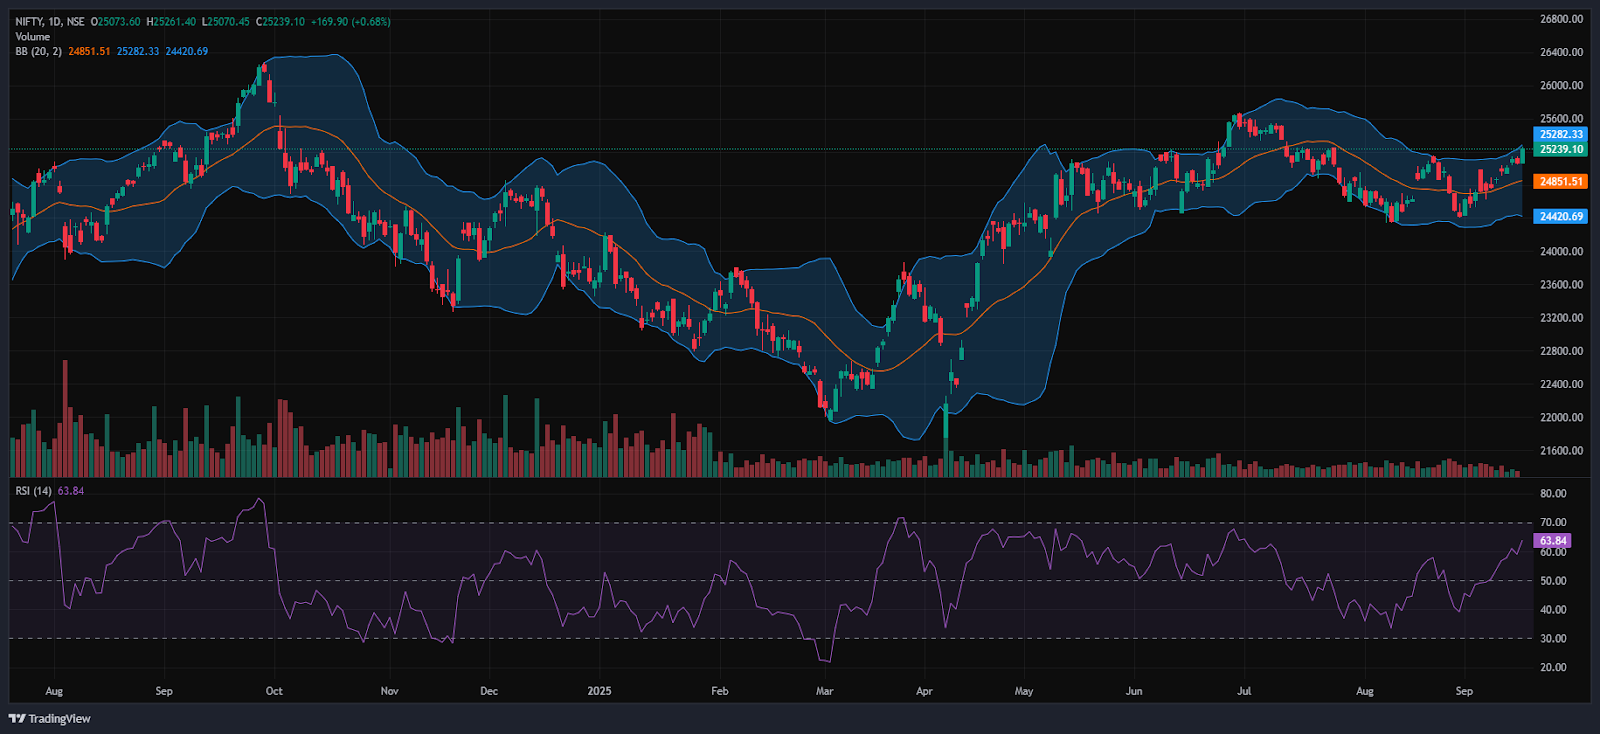
RSI (Daily): The Nifty 50’s RSI stood at 63.84, which is well below the overbought zone of 70, indicating a bullish sentiment.
Bollinger Bands (Daily): The index is trading in the upper band of its Bollinger Band range above the middle band (Simple Moving Average). Its position in the upper range, along with solid resistance around the 25,250 level and in Tuesday’s session, the Index formed a strong Bullish Candle. A sustained move above the middle band signals a bullish sentiment, while a drop back toward the lower band may reinforce bearish sentiment.
Volume Analysis: Tuesday’s trading session average volumes stood at 240.12 Mn.
Derivatives Data: Options OI indicates strong Put writing at 25,200, following 25,150, establishing it as a firm support zone. On the upside, a significant Call OI buildup at 25,250 and 25,300 suggests a potential resistance supply. PCR (Put/Call Ratio) stands at 1.3446 (>1), leaning towards bearish sentiment and the long Buildup signals a Strong bullish move, with an overall mixed outlook for the next trading session.
Bank Nifty
(In this analysis, we have used 20/50/100/200 EMAs, where 20 EMA (Red), 50 EMA (Orange), 100 EMA (Light Blue), and 200 EMA (Dark Blue)).
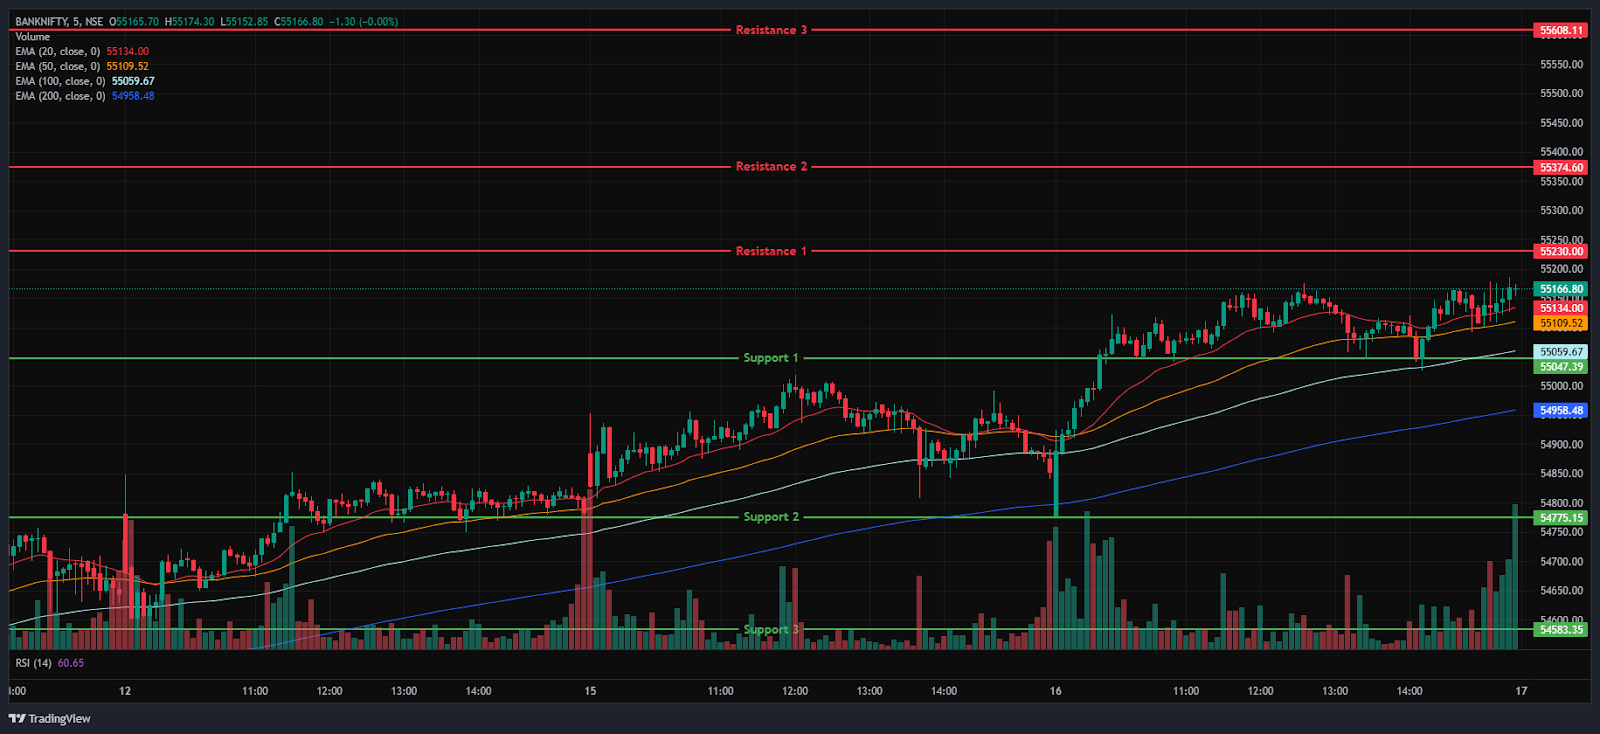
The Bank Nifty Index started the session on a negative note at 54,778.40 on Tuesday, down by 109.45 points from Monday’s closing of 54,887.85. The index started the day on a negative note and dropped as low as 54,778; however, it later recovered from this low and soared to 55,175 in the morning session, trading above its opening level of 55,143. In addition, the index was trading between the 54,750 and 55,175 levels in the morning session and above all four EMAs of 20/100/50/200 in the 15-minute time frame.
The Bank Nifty index dropped as low as 55,026 in the afternoon session, but it bounced back to reach its day high of 55,185 and remained above the 55,100 mark, trading in the green. During the afternoon session, Bank Nifty closed above all four EMAs of 20/50/100/200 in the 15-minute time frame. Bank Nifty immediate resistance levels are R1 (55,230), R2 (55,375), and R3 (55,608), while immediate support levels are S1 (55,047), S2 (54,775), and S3 (54,583).
The Bank Nifty index had peaked at 55,185.45 and made a day’s low at 54,777.75. Finally, it had closed in green at 55,147.60, traded above the 55,100 level, gaining 259.75 points or 0.47%. The Relative Strength Index (RSI) stood at 55.01 well below the overbought zone of 70 in the daily time frame, and Bank Nifty closed above all four EMAs of 20/50/100/200 in the daily time frame.
Sensex
(In this analysis, we have used 20/50/100/200 EMAs, where 20 EMA (Red), 50 EMA (Orange), 100 EMA (Light Blue), and 200 EMA (Dark Blue)).
To view other technical reports, click here
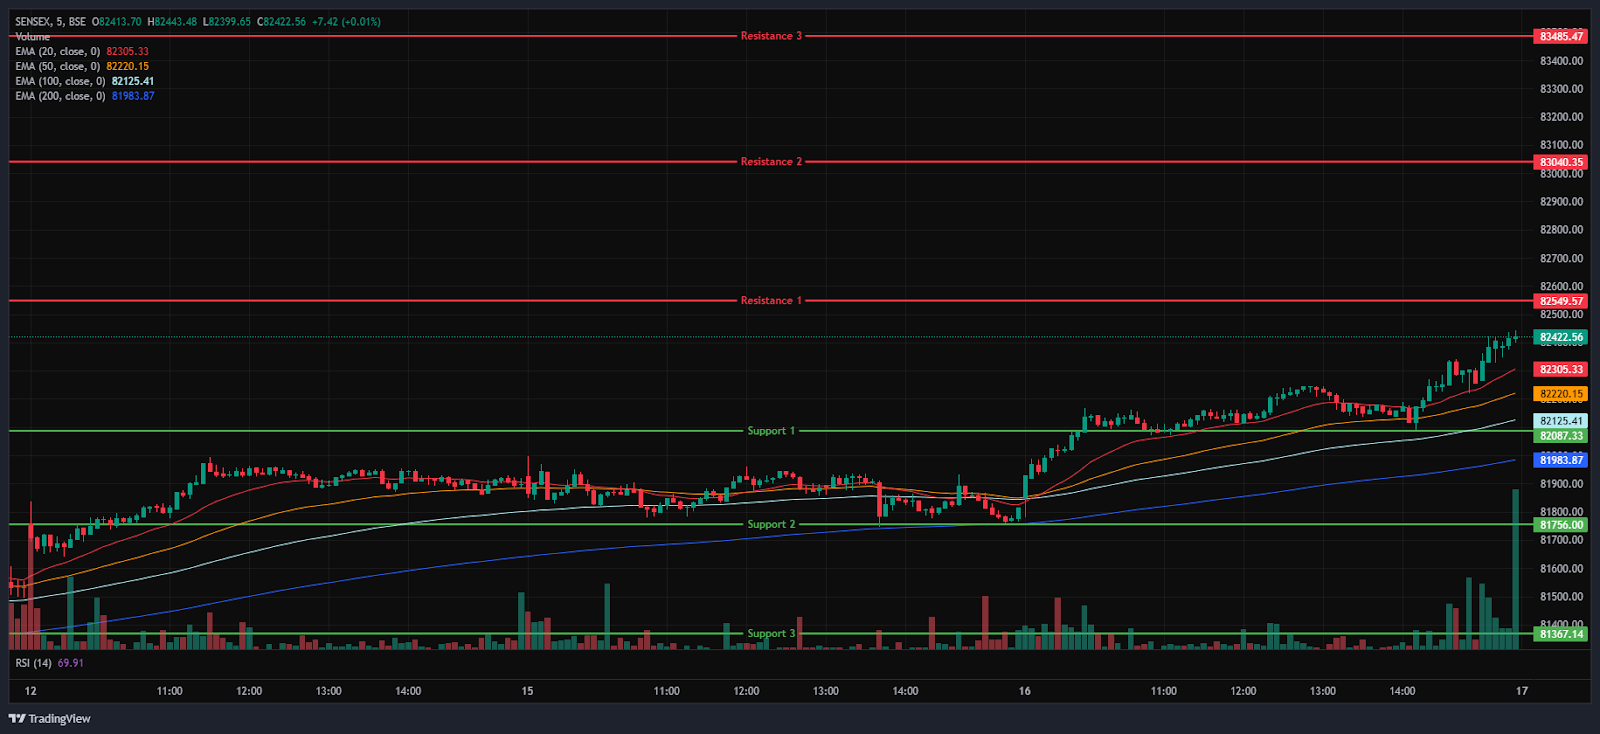
The BSE Sensex Index opened on a positive note at 81,852.11 on Tuesday, up by 66.37 points from Monday’s closing of 81,785.74. Following a positive start to the morning session, the Index soared to the 82,240.39 level and was traded above its starting level of 82,233.66. Furthermore, throughout the 15-minute time frame, the Index was trading above all four EMAs of 20/50/100/200. In the morning session, it was trading between 81,800 and 82,250.
The Sensex Index continued to gain ground in the afternoon session, reaching its day high of 82,443 and maintaining its position above the 82,400 level, maintaining its overall bullish trend and trading above all four EMAs of 20/50/100/200 in the 15-minute time frame. BSE Sensex immediate resistance levels are R1 (82,550), R2 (83,040), and R3 (83,485), while immediate support levels are S1 (82,087), S2 (81,756), and S3 (80,367).
The BSE Sensex index had peaked at 82,443.48 and made a day’s low at 81,779.94. Finally, it had closed at 82,380.69 in green, gaining 594.95 points or 0.73%. The Relative Strength Index (RSI) stood at 63.11 (below the overbought zone of 70) in the daily time frame, and the BSE Sensex closed above all four EMAs of 20/50/100/200 in the daily time frame.
India VIX
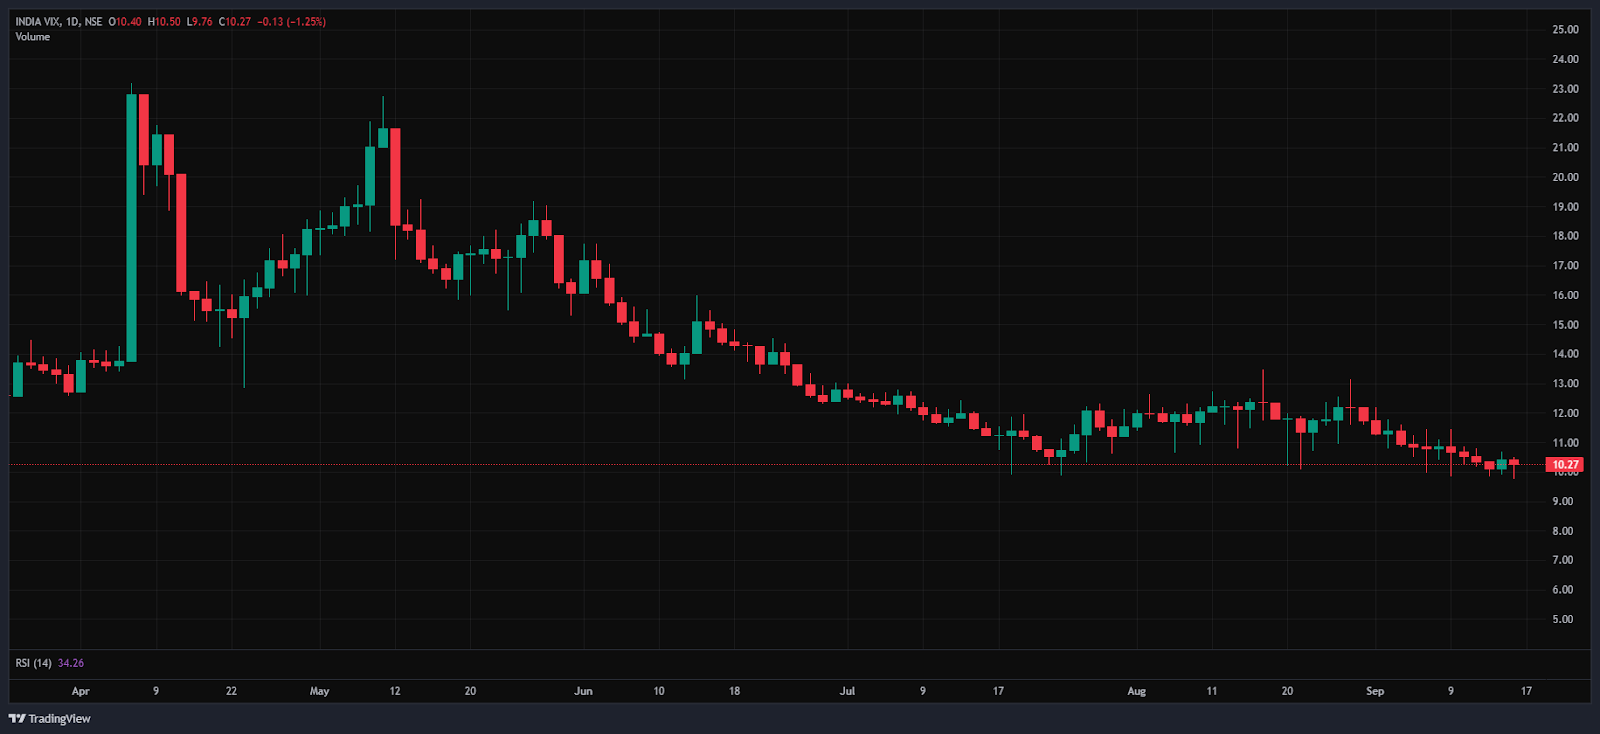
The India VIX decreased by 0.12 points or 1.20%, from 10.40 to 10.27 during Tuesday’s session. A decrease in the India VIX typically indicates lower price volatility in the stock market, suggesting a more stable market environment. However, a stable market environment and minimal volatility are anticipated when the India vix is below 15.
Market Recap on the 16th of September 2025
On Tuesday, the Nifty 50 opened on a flat note at 25,073.6, gaining just 4.4 points from its previous close of 25,069.2. It touched an intraday high of 25,261.4 before settling at 25,239.1, up by 169.9 points or 0.68%. Technically, the index stayed above all four key exponential moving averages (20/50/100/200-day) on the daily chart, indicating bullish momentum.
The BSE Sensex mirrored the trend, opening slightly higher at 81,852.11, up 66.37 points from its previous close of 81,785.74. It moved in tandem with the Nifty 50 and closed at 82,380.69, marking a gain of 594.95 points or 0.73%. Momentum indicators remained moderately strong, with the RSI at 63.84 for Nifty 50 and 63.11 for Sensex, both below the overbought threshold of 70. The Bank Nifty Index also ended in the green, adding 259.75 points or 0.47%, to close at 55,147.6.
Sectoral performance was broadly positive, with most indices finishing in the green and only a few laggards. The Nifty Auto Index led the gains, rising 385.75 points or 1.4%, to close at 27,146.4. Balkrishna Industries Ltd advanced 2.6%, while other auto majors such as MRF Ltd, Mahindra & Mahindra Ltd, Bharat Forge Ltd, and Maruti Suzuki India Ltd posted gains of up to 2.4%.
The Nifty Realty Index added 9.7 points, or 1.1%, to end at 915.35, with top contributors including Prestige Estates Projects Ltd, The Phoenix Mills Ltd, DLF Ltd, and Godrej Properties Ltd, all gaining up to 1.9%. The Nifty Infrastructure Index also recorded modest growth, rising 93.05 points or 1%, to close at 9,190.65.
On the downside, the Nifty FMCG Index was the only major sectoral laggard, closing at 56,398.65, down 152.7 points or -0.3%. Godrej Consumer Products Ltd declined 2.2%, while Varun Beverages Ltd and Dabur India Ltd slipped by up to 1.9%.
Asian markets ended mostly positive on Tuesday. China’s Shanghai Composite Index was flat, closing at 3,861.87, up just 1.37 points or 0.04%. In contrast, Hong Kong’s Hang Seng Index dipped slightly by 11.56 points or -0.04%, to end at 26,435. South Korea’s KOSPI Index rose to 3,449.62, gaining 42.31 points or 1.23%, while Japan’s Nikkei 225 advanced 236.88 points or 0.53%, to finish at 45,005. As of 3:56 p.m. IST, US Dow Jones Futures were trading at 45,907.95, up 24.5 points or 0.05%.
Trade Setup Summary
The Nifty 50 opened on a positive note at 25,073.60 on Tuesday and ended the session in the green above the 25,200 level at 25,239.10. A break below 25,229 could trigger further selling towards 25,200, while breaking the next resistance level of 25,261 could trigger bullishness towards the 25,316 level.
Bank Nifty started the session on a negative note at 54,778.40 but ended the session in the green at 55,147.60, above the 55,100 level. A break below 55,047 could trigger further selling towards 54,775, while breaking the next resistance level of 55,230 could trigger bullishness towards the 55,375 level.
Sensex also opened on a positive note at 81,852.11 and ended the session in the green at 82,380.69, above the 81,350 level. A break below 82,087 could trigger further selling towards 81,756, while breaking the next resistance level of 82,550 could lead towards the 83,040 level.
Given the ongoing volatility and mixed sentiments, it’s advisable to avoid aggressive positions and wait for clear directional moves above resistance or below support. Traders should consider these key support and resistance levels when entering long or short positions following the price break from these critical levels. Additionally, traders can combine moving averages to identify more accurate entry and exit points.
Disclaimer

The views and investment tips expressed by investment experts/broking houses/rating agencies on tradebrains.in are their own, and not that of the website or its management. Investing in equities poses a risk of financial losses. Investors must therefore exercise due caution while investing or trading in stocks. Trade Brains Technologies Private Limited or the author are not liable for any losses caused as a result of the decision based on this article. Please consult your investment advisor before investing.
About: Trade Brains Portal is a stock analysis platform. Its trade name is Dailyraven Technologies Private Limited, and its SEBI-registered research analyst registration number is INH000015729.
Investments in securities are subject to market risks. Read all the related documents carefully before investing.
Registration granted by SEBI and certification from NISM in no way guarantee performance of the intermediary or provide any assurance of returns to investors.
