

The Nifty, Bank Nifty, and Sensex all started yesterday on a muted note and continued to fall during the day due to sustained geopolitical tensions, and profit-booking seen across sectors like Pharma after the US President Trump said that tariffs on pharmaceutical imports are coming very shortly. Heavyweight stocks like HDFC, ICICI, and Reliance dragged the indices downwards. Almost all the sectoral indices ended in red, with Nifty Pharma and Nifty Healthcare indices being the major laggards, whereas Nifty IT and Nifty India Defence indices were the only major gainers.
Amid the ongoing geopolitical tensions, investors turned to safe-haven assets like gold, which sustained the Rs 1 Lakh mark. On Tuesday, the market saw weakness during the opening, and it continued to falter throughout the day, due to sustained Iran-Israel war, and Trump’s statement on Iranians to evacuate Tehran made investors to become more cautious. Investors are also closely eyeing the US Federal Reserve’s two-day meeting, the outcome of which will be revealed on June 18, 2025.

In this overview, we will analyze the key technical levels and trend directions for Nifty, Bank Nifty, and BSE Sensex to monitor in the upcoming trading sessions. All the charts mentioned below are based on the 5-minute timeframe.
NIFTY 50 Chart & Price Action Analysis
(In this analysis, we have used 20/50/100/200 EMAs, where 20 EMA (Red), 50 EMA (Orange), 100 EMA (Light Blue), 200 EMA (Dark Blue)).
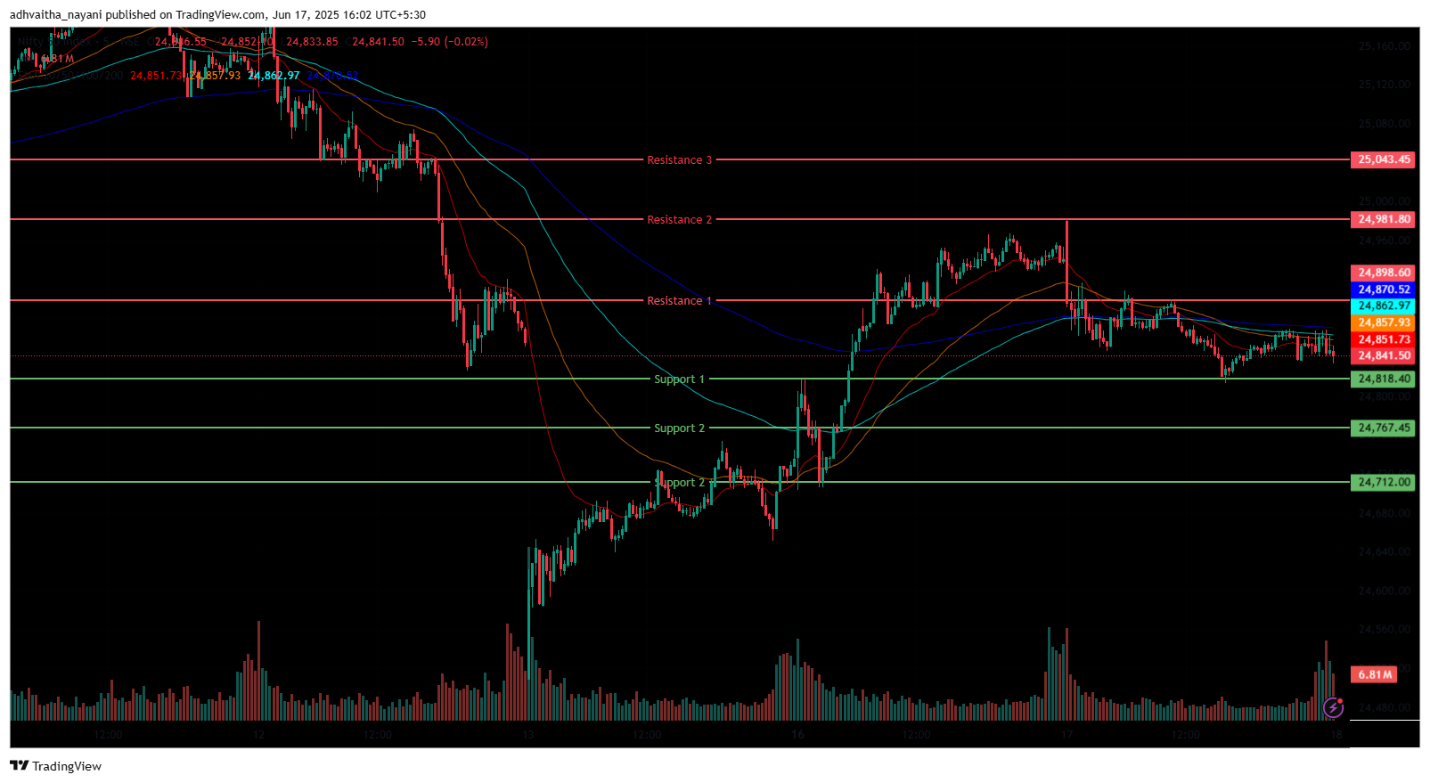
The Nifty 50 Index opened yesterday a muted note at 24,978, up by 32 points from Monday’s closing of 24,946. It was trading below the opening level around the 24,850 range in the morning session, and remained closer to the 20/50-day EMAs; however later declined below 20/50/100/200-day EMAs in the 15-minute time frame during the morning session. In the afternoon session, the Nifty Index reached the day’s low at 24,814 and broke below all four EMAs in the 15-minute time frame.
Nifty’s immediate resistance levels are R1 (24,899), R2 (24,982), and R3 (25,043), while immediate support levels are S1 (24,818), S2 (24,767), and S3 (24,712).
The Nifty index reached a day’s high at 24,982, just below the 25,000 mark, and saw a day’s low at 24,814. Finally, it closed at 24,853, down in the red, losing -93.1 points or -0.37%. The Relative Strength Index (RSI) stood at 53.3 (well below the overbought zone of 70) in the daily time frame, and Nifty 50 closed above all four 20/50/100/200 EMAs.
Bank Nifty Chart & Price Action Analysis

(In this analysis, we have used 20/50/100/200 EMAs, where 20 EMA (Red), 50 EMA (Orange), 100 EMA (Light Blue), 200 EMA (Dark Blue)).
The Bank Nifty Index also opened yesterday on a similar trend at 55,975, slightly above the previous day’s closing price of 55,945. It was trading below the opening level at the 55,800 range in the morning session and remained closer to the 20/50-day EMAs; however later declined below 20/50/100/200-day EMAs in the 15-minute time frame during the morning session. While in the afternoon session, Bank Nifty saw a day’s low at 55,644 and closed at 55,714, and was below 20/50/100/200-day EMAs in the afternoon session.
Bank Nifty immediate resistance levels are R1 (55,824), R2 (55,960), and R3 (56,067), while immediate support levels are S1 (55,651), S2 (55,756), and S3 (54,399). The Bank Nifty index peaked at 56,067 and had a day’s low at 55,644. Finally, it rebounded slightly from the day’s low to close at 55,714, down by -230.75 points or -0.41%. The Relative Strength Index (RSI) stood at 52.5 (well below the overbought zone of 70) in the daily time frame, and Bank Nifty closed above 50/100/200 EMAs but below the 20-day EMA.
BSE Sensex Chart & Price Action Analysis
(In this analysis, we have used 20/50/100/200 EMAs, where 20 EMA (Red), 50 EMA (Orange), 100 EMA (Light Blue), 200 EMA (Dark Blue)).
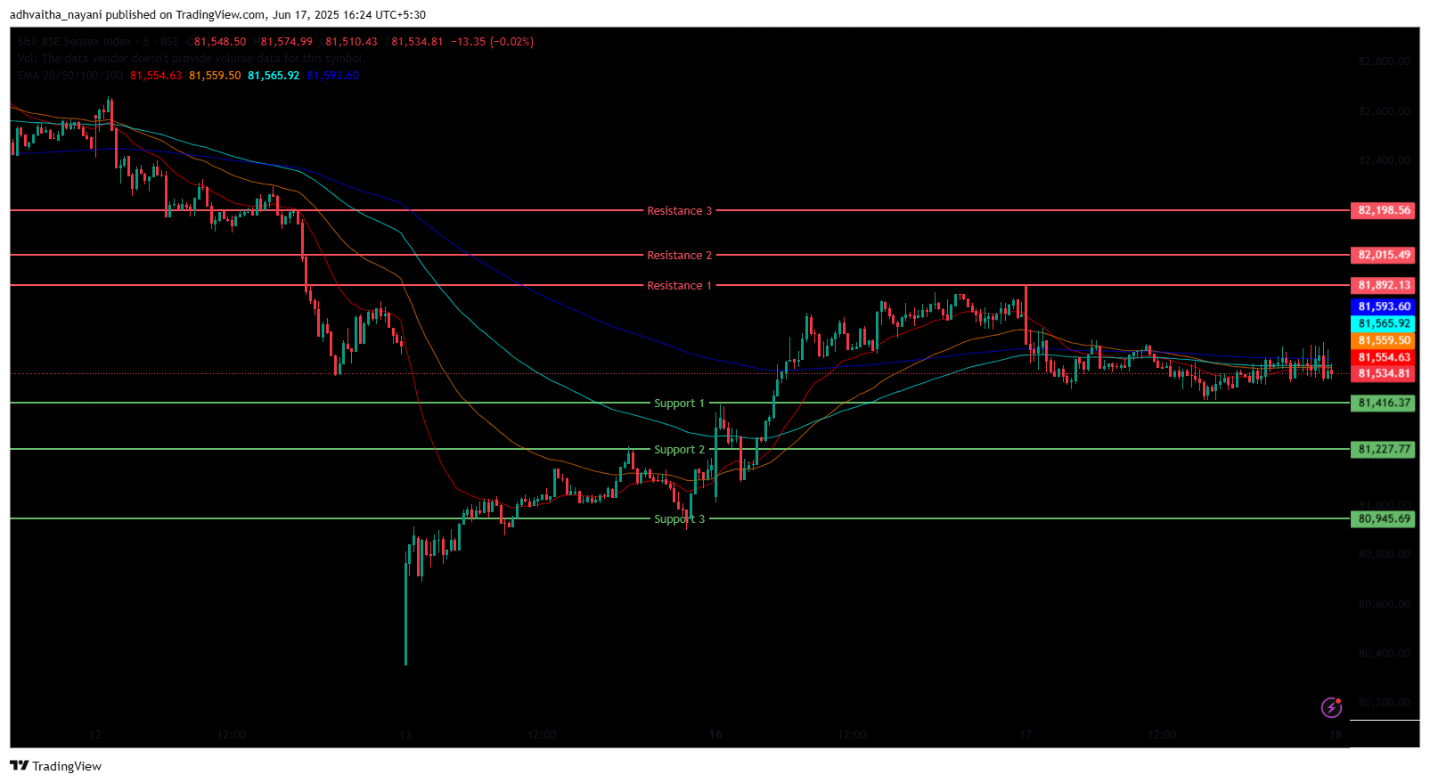
The BSE Sensex Index opened yesterday at 81,869, which was slightly above the previous day’s closing price of 81,796. It was trading below the opening level at 81,550 range in the morning session and remained closer to the 20/50-day EMAs; however later declined below 20/50/100/200-day EMAs in the 15-minute time frame during the morning session. In the afternoon session, the BSE Sensex was trading on a flat note at the 81,550 levels and closed at 81,583, below the 100/200 EMAs, and remained closer to the 20/50 EMAs in the 15-minute time frame.
BSE Sensex immediate resistance levels are R1 (81,892), R2 (82,015), and R3 (82,198), while immediate support levels are S1 (81,416), S2 (81,228), and S3 (80,946). The BSE Sensex index peaked at 81,890 and had a day’s low at 81,427. Finally, it slightly rebounded from the day’s low to close at 81,583, down by -213 points or -0.26%. The Relative Strength Index (RSI) stood at 52.3 (well below the overbought zone of 70) in the daily time frame, and BSE Sensex closed above all four 20/50/100/200 EMAs.
Market Recap June 17th, 2025
After the US president cautioned Iran about the ongoing conflict and stated that Tehran should have signed a nuclear agreement with the US, investors remained cautious and concerned about geopolitical uncertainties, which continued to put pressure on the benchmark indexes. The Indian markets had a good start but remained in red for the duration of trading hours.
The intraday high for the Nifty 50 was 24,982.05. The day started at 24,977.85. In a similar way the BSE Sensex breached the 20-day EMA and RSI of 52.24 after starting at 81,869.47 and rising to an intraday high of 81,890.15 and closed at 81,583.30, down by -212.85 points, or -0.26%. The Nifty 50 ended the day at 24,853.40, down -93.10 points, or -0.37%, with an RSI of 53.26 and a daily time frame trading above the 20/50/100/200 EMA.
The IT index was the major sectoral gainer today, closing at 39,356.10, up 283.05 points, or 0.72%. The largest companies, including Tech Mahindra, LTI Mindtree, Infosys Ltd., and Persistent Systems, recorded gains of up to 2 percent.
The largest loser of the day was the Nifty Pharma index, which closed the day at 21,622.80, down -416.65 points, or -1.89%. The Nifty Healthcare index closed at 14,138.65, down -1.79%, or -257.45 points, after the fall. Aurobindo Pharma Ltd., Laurus Pharma, Natco Pharma Ltd., Granules India Ltd., and Lupin Ltd. all had losses of up to 4% in both indices.
As the Israel-Iran conflict grew more intense, tensions in the Middle East and global commerce escalated, leading investors to assess the market as US President Donald Trump urged everyone to leave Tehran immediately. Due to Middle East tensions, the US president also left the G7 summit the previous day. Asian markets opened in a neutral manner on Tuesday. In the Asia-Pacific markets, the Hang Seng index in Hong Kong fell -0.34%, or -80.69 points, to close at 23,980.3, while the Kospi index in South Korea continued its upward trend, rising 0.12%, or 3.64 points, to conclude at 2,950.3. At 38,536.74, Japan’s Nikkei 225 closed the day up 225.41 points, or 0.59%. The Shanghai index ended the day down -0.04%, or -1.32 points, at 3,387.4.
India VIX
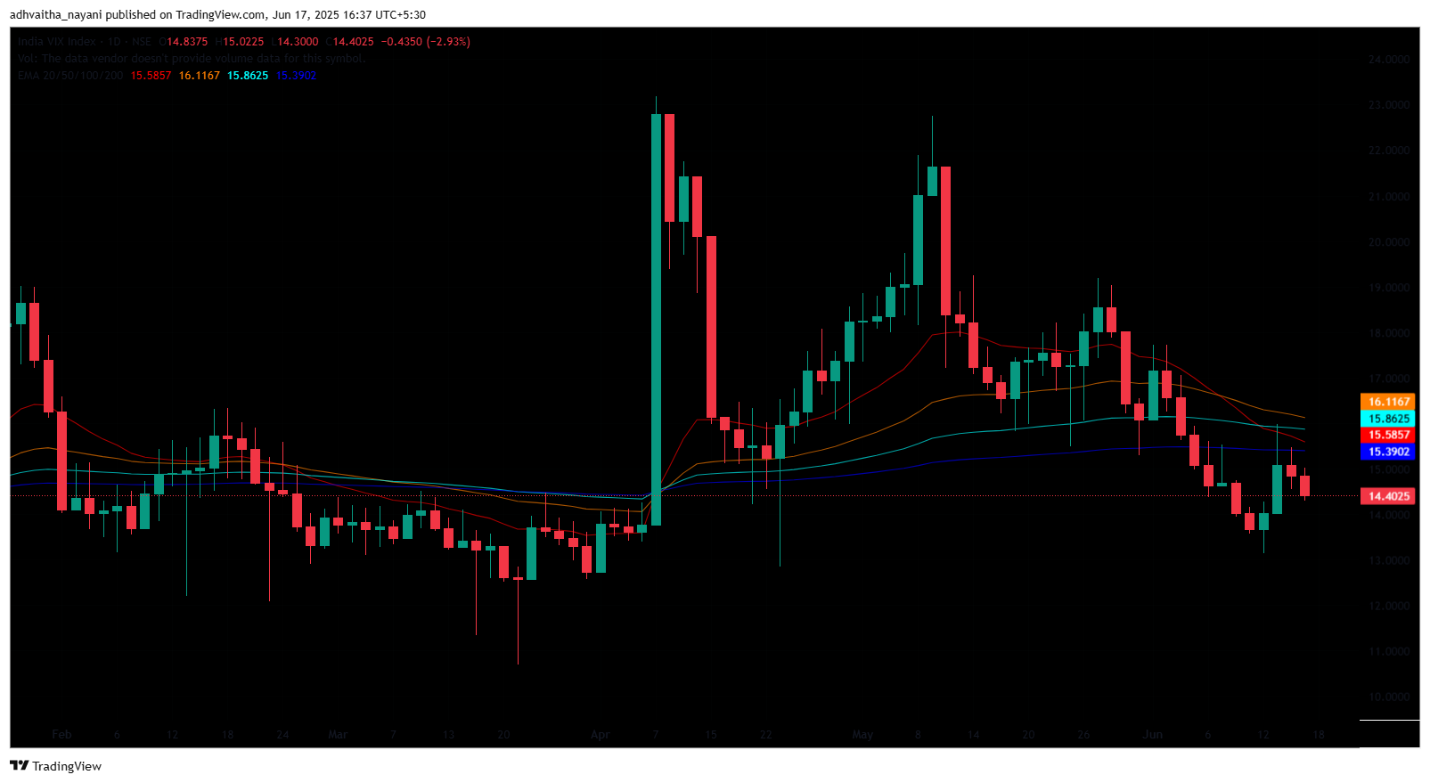
The India VIX decreased from 14.84 on Monday to 14.40, down by -0.43 points or -2.93%. The index continued to ease from the recent high of 15.98, which was marked on Friday, thus indicating lessened market volatility.
Trade Setup Summary
The Nifty 50 opened yesterday on a cautious note and gradually declined throughout the trading session but remained above the 20-day EMA (24,811) in the daily time frame, and closed at 24,853, peaking at 24,982, nearing the 25,000 mark. The index remains volatile due to the ongoing geopolitical tensions and anticipation of the US Fed meeting outcome. Given ongoing volatility and mixed sentiments, avoid aggressive positions and wait for clear directional moves above resistance or below support. A break below 24,818 could trigger further selling towards 24,767.
Bank Nifty opened on a similar note and tested the levels of 56,066, which stands as a key resistance level. In the afternoon session, Bank Nifty plunged to a day’s low at 55,644 and closed slightly above at 55,714. All major banking stocks were in the red, with heavyweights including HDFC Bank, ICICI Bank, Axis Bank, etc, dragging the index down. A break below 55,650 could trigger further selling towards 55,576.
Sensex opened slightly above yesterday’s close and tested the 81,890 level and continued its downward trajectory, closing in red at 81,583. A break below 81,416 could trigger further selling towards 81,228.
Traders should consider these key support and resistance levels to enter long or short positions following the price break from the key levels. Also, traders can combine moving averages for more accurate entry and exit points.
Disclaimer

The views and investment tips expressed by investment experts/broking houses/rating agencies on tradebrains.in are their own, and not that of the website or its management. Investing in equities poses a risk of financial losses. Investors must therefore exercise due caution while investing or trading in stocks. Trade Brains Technologies Private Limited or the author are not liable for any losses caused as a result of the decision based on this article. Please consult your investment advisor before investing.
About: Trade Brains Portal is a stock analysis platform. Its trade name is Dailyraven Technologies Private Limited, and its SEBI-registered research analyst registration number is INH000015729.
Investments in securities are subject to market risks. Read all the related documents carefully before investing.
Registration granted by SEBI and certification from NISM in no way guarantee performance of the intermediary or provide any assurance of returns to investors.
