
Markets displayed a broadly positive sentiment on Wednesday, buoyed by improving global cues and easing trade tensions between India and the US. Key indices opened on a strong note and maintained a steady upward trajectory throughout the session. The technical setup remained favourable, with benchmark indices holding above major moving averages, suggesting continued investor confidence. Momentum indicators also pointed to moderate strength, signalling that the market is not yet in overbought territory and may have room to move higher.

Investor enthusiasm was particularly evident in the PSU banking and defence sectors, where stocks rallied on improved outlook and sector-specific optimism. Positive sentiment extended across most sectoral indices, although some sectors, like metal and consumer durables, witnessed some profit booking.

Broader Asian markets offered a mixed picture, but the overall tone remained cautiously optimistic, especially with eyes on the US Federal Reserve’s anticipated rate decision. The market’s performance reflected a combination of domestic strength and global anticipation, with traders positioning themselves ahead of key macroeconomic events.
In this overview, we will analyse the key technical levels and trend directions for Nifty and BSE Sensex to monitor in the upcoming trading sessions. All the charts mentioned below are based on the 5-minute timeframe.
Nifty 50
(In this analysis, we have used 20/50/100/200 EMAs, where 20 EMA (Red), 50 EMA (Orange), 100 EMA (Light Blue), and 200 EMA (Dark Blue)).
To view other technical reports, click here
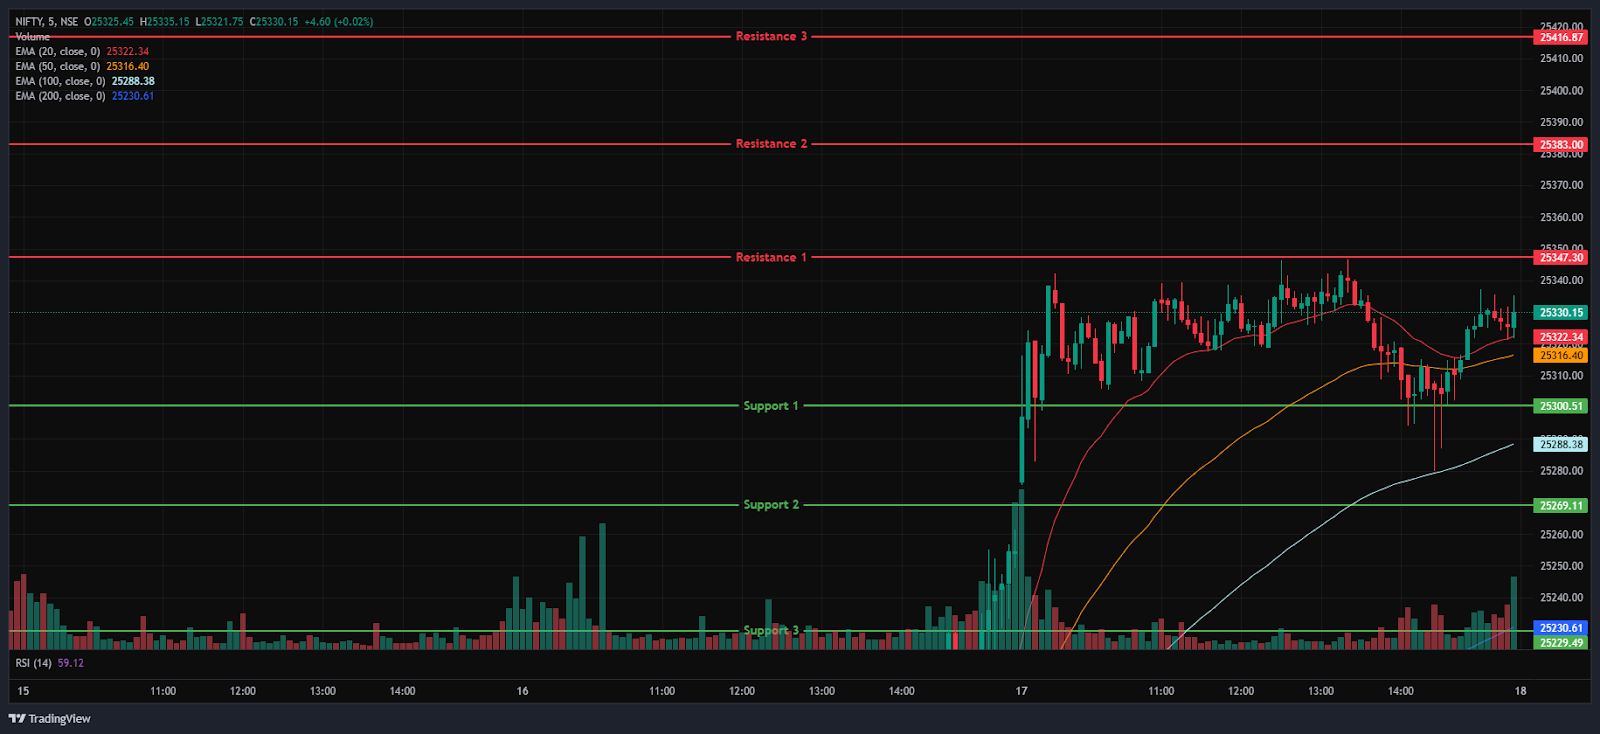
The Nifty 50 Index opened on a positive note at 25,276.60 on Wednesday, up by 37.5 points from Tuesday’s closing of 25,239.10. With a gap-up start to the day, the index jumped over the 25,340 mark in the morning session and closed above its opening level at 25,332. Additionally, the Index stood above all four EMAs of 20/50/100/200 in the 15-minute time frame during the morning session, which saw a range-bound trade between 25,250 and 25,350. The index maintained its range-bound session later in the afternoon session, reaching its day high of 25,346.
Further, the Index lost its momentum and fell as low as 25,280, but later recovered from the low and held above the 25,300 level, trading in green. Overall, the index ended in a bullish state on the Wednesday session. During the afternoon session, the Nifty 50 was traded above all four EMAs of 20/50/100/200 in the 15-minute time frame. Nifty’s immediate resistance levels are R1 (25,347), R2 (25,383), and R3 (25,417), while immediate support levels are S1 (25,300), S2 (25,269), and S3 (25,229).
The Nifty index had reached a day’s high at 25,346.50 and saw a day’s low at 25,275.35. Finally, it had closed at 25,330.25, in green above the 25,300 level, gaining 91.15 points, or 0.36%. The Nifty 50 closed above all four EMAs of 20/50/100/200 EMAs in the daily time frame.
Momentum Indicators
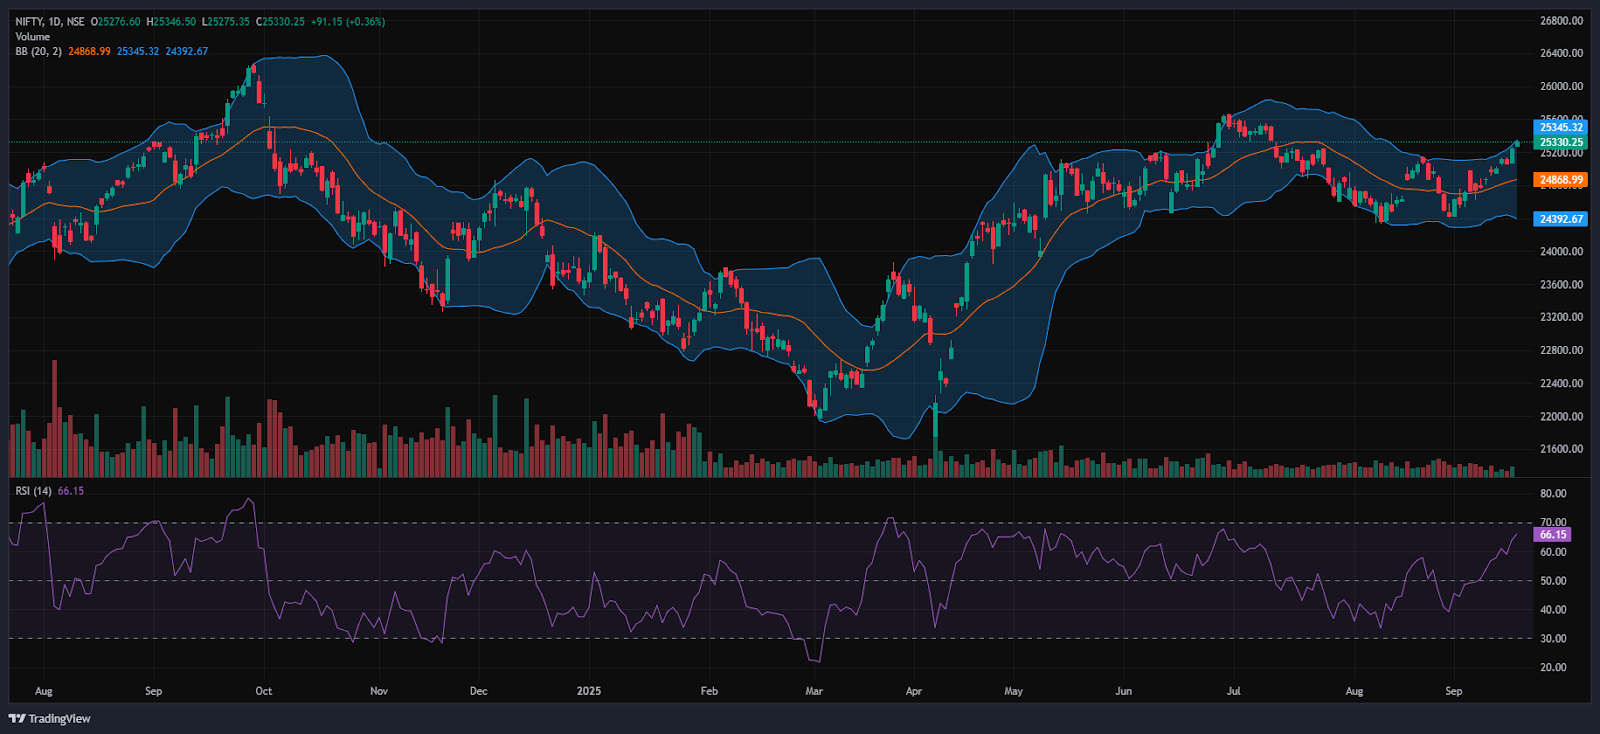
RSI (Daily): The Nifty 50’s RSI stood at 66.15, which is well below the overbought zone of 70, indicating a bullish sentiment.
Bollinger Bands (Daily): The index is trading in the upper band of its Bollinger Band range above the middle band (Simple Moving Average). Its position in the upper range, along with solid resistance around the 25,330 level and in Wednesday’s session, the Index formed a Bullish Candle. A sustained move above the middle band signals a bullish sentiment, while a drop back toward the lower band may reinforce bearish sentiment.
Volume Analysis: Wednesday’s trading session average volumes stood at 268.94 Mn.
Derivatives Data: Options OI indicates strong Put writing at 25,300, following 25,200, establishing it as a firm support zone. On the upside, a significant Call OI buildup at 25,400 and 25,500 suggests a potential resistance supply. PCR (Put/Call Ratio) stands at 1.1627 (>1), leaning towards Mild Bearish and the long Buildup signals a Strong bullish move, with an overall mixed outlook for the next trading session.
Bank Nifty
(In this analysis, we have used 20/50/100/200 EMAs, where 20 EMA (Red), 50 EMA (Orange), 100 EMA (Light Blue), and 200 EMA (Dark Blue)).
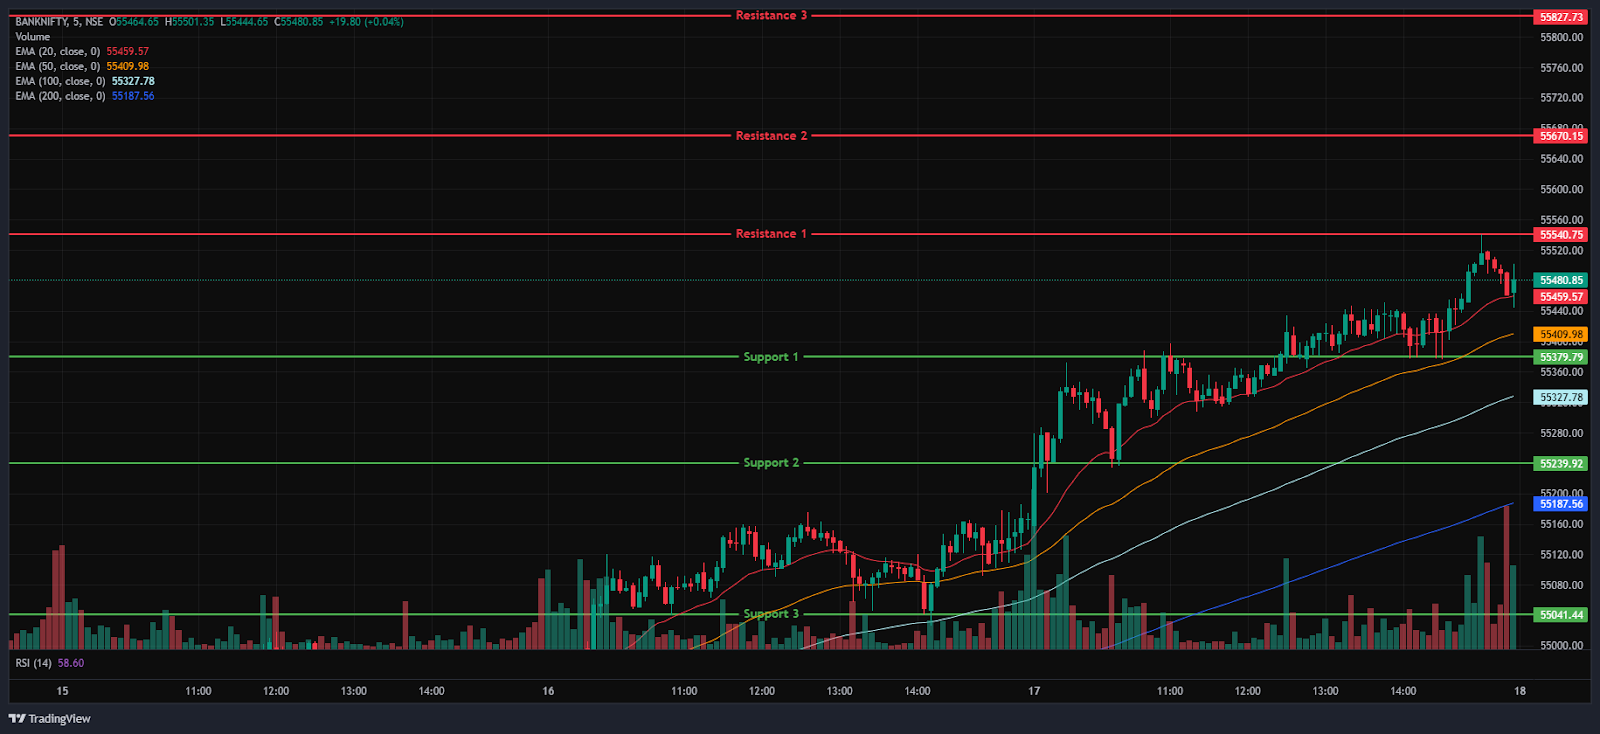
The Bank Nifty Index started the session on a positive note at 55,158.35 on Wednesday, up by 10.75 points from Tuesday’s closing of 55,147.60. The index started the day on a positive note and surged as high as 54,433 and was trading above its opening level of 55,382. In addition, the index was trading between the 55,150 and 55,450 levels in the morning session and was above all four EMAs of 20/100/50/200 in the 15-minute time frame.
The Index made its day high of 55,541 in the afternoon session, trading in green and holding above the 55,450 mark. During the afternoon session, Bank Nifty closed above all four EMAs of 20/50/100/200 in the 15-minute time frame. Bank Nifty immediate resistance levels are R1 (55,541), R2 (55,670), and R3 (55,828), while immediate support levels are S1 (55,380), S2 (55,240), and S3 (55,041).
The Bank Nifty index had peaked at 55,540.75 and made a day’s low at 55,146.55. Finally, it had closed in green at 55,493.30, traded above the 55,450 level, gaining 345.70 points or 0.63%. The Relative Strength Index (RSI) stood at 59.78 well below the overbought zone of 70 in the daily time frame, and Bank Nifty closed above all four EMAs of 20/50/100/200 in the daily time frame.
Sensex
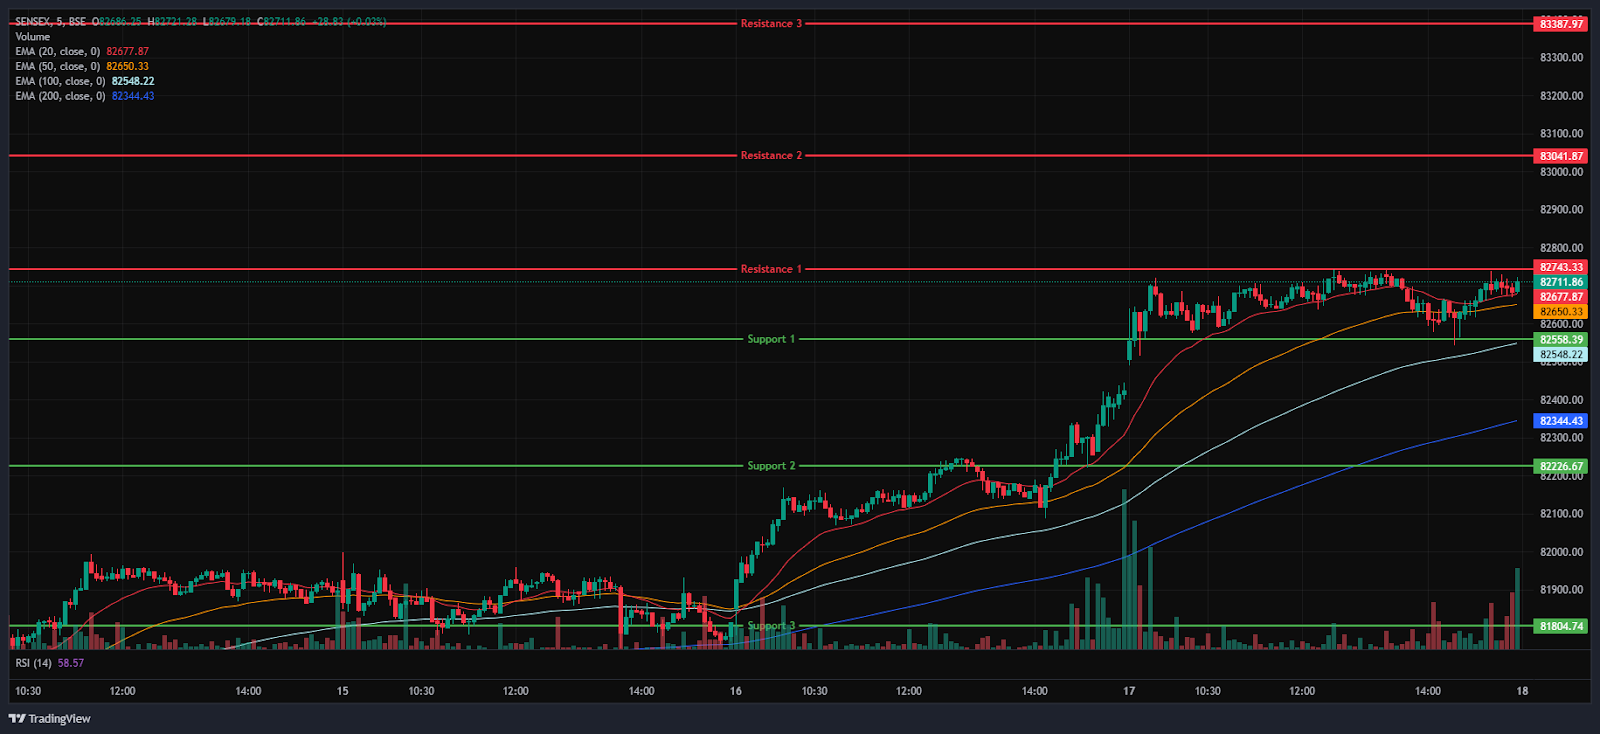
(In this analysis, we have used 20/50/100/200 EMAs, where 20 EMA (Red), 50 EMA (Orange), 100 EMA (Light Blue), and 200 EMA (Dark Blue)).
To view other technical reports, click here
The BSE Sensex Index opened on a positive note at 82,506.40 on Wednesday, up by 125.71 points from Tuesday’s closing of 82,380.69. Following a positive start to the morning session, the Index soared to the 82,742 level and was traded above its opening level at 82,699. Furthermore, throughout the morning session in the 15-minute time frame, the Index was trading above all four EMAs of 20/50/100/200 and was trading between 82,500 and 82,750.
The Index continued to gain ground in the afternoon session, maintaining its position above the 82,650 level, maintaining its overall bullish trend and trading above all four EMAs of 20/50/100/200 in the 15-minute time frame. BSE Sensex immediate resistance levels are R1 (82,743), R2 (83,042), and R3 (83,388), while immediate support levels are S1 (82,558), S2 (82,227), and S3 (81,805).
The BSE Sensex index had peaked at 82,741.95 and made a day’s low at 82,490.47. Finally, it had closed at 82,693.71 in green, gaining 313.02 points or 0.38%. The Relative Strength Index (RSI) stood at 65.57 (below the overbought zone of 70) in the daily time frame, and the BSE Sensex closed above all four EMAs of 20/50/100/200 in the daily time frame.
India VIX
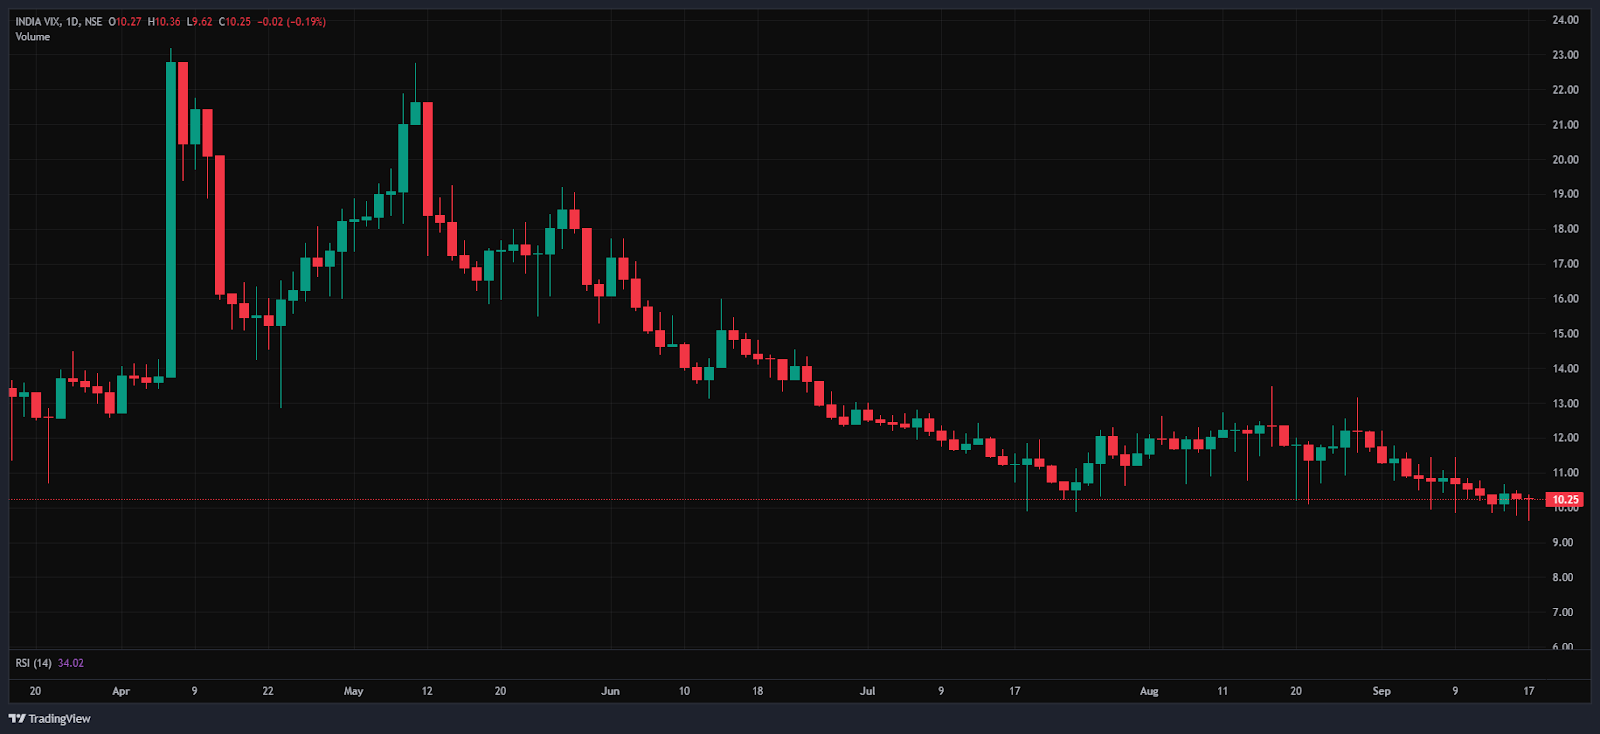
The India VIX decreased by 0.025 points or 0.24%, from 10.27 to 10.25 during Wednesday’s session. A decrease in the India VIX typically indicates lower price volatility in the stock market, suggesting a more stable market environment. However, a stable market environment and minimal volatility are anticipated when the India vix is below 15.
Market Recap on the 17th of September 2025
With a positive opening at 25,276.6 on Wednesday, the Nifty 50 was up just 37.5 points from its closing price of 25,239.1. Before closing at 25,330.25, up 91.15 points or 0.36%, it had an intraday high of 25,346.5. Technically, on the daily chart, the index stayed above the four major exponential moving averages (20, 50, 100, and 200-day). By starting at 82,506.4, up 125.71 points from its previous close of 82,380.69, the BSE Sensex also showed a positive trend.
It traded in a similar range to the Nifty 50 and settled at 82,693.71, marking a gain of 313 points or 0.38%. Momentum indicators showed moderate strength, with the RSI for Nifty 50 at 66.15 and for Sensex at 65.57, both below the overbought level of 70. The Bank Nifty Index closed in positive territory, gaining 345.7 points, or 0.63%, to finish at 55,493.3. The investors showed positive reactions to the cooling trade relations between India and the US, and anticipated an interest rate cut by the Fed later on Wednesday.
On Wednesday, most of the sectoral indices closed higher. The Top-performing index was the Nifty PSU Bank Index, which increased 186.25 points, or 2.6%, to close at 7,315.9. Maharashtra Bank saw a 4.1% increase. The stocks of other PSU banks, including Canara Bank, State Bank of India, and Punjab National Bank, also increased by up to 3.3%.
The Nifty India Defence Index closed at 8,316.55, up 162.25 points, or 2%. With increases of up to 6.7%, Garden Reach Shipbuilders, Zen Technologies, Data Patterns, and Cochin Shipyard Ltd. were the top gainers. Also showing minor increases, the Nifty Capital Markets Index ended the day at 4,365.7, up 48.4 points, or 1.1%.
The Nifty Metal Index, which closed at 9,923.15, down -50.3 points or -0.5%, was the top loser on the downside. Welspun Corp Ltd, NALCO Ltd, and Hindustan Copper Ltd all saw declines of up to 1.7%, while Jindal Steel Ltd fell 1.9%. Following the decline, the Nifty consumer durables fell 118.05 points, or -0.3%, to close at 39,554.75. Titan Company Ltd, Havells India, Bata India, and Whirlpool of India all saw declines of up to 1.5%.
On Wednesday, Asian markets showed a mixed trend. The Shanghai Composite Index of China was up 14.47 points, or 0.37%, at 3,876.34. Whereas, Hong Kong’s Hang Seng Index closed at 26,908.39, up 151.48 points, or 1.16%. The Japan’s Nikkei 225 Index was down -111.89 points, or -0.25%, to settle at 44,790.38, while South Korea’s KOSPI Index closed lower at 3,413.4, down -36.22 points, or -1.05%. US Dow Jones Futures were down -11 points, or -0.024%, at 45,773 as of 4:46 p.m. IST.
Trade Setup Summary
The Nifty 50 opened on a positive note at 25,276.60 on Wednesday and ended the session in the green above the 25,300 level at 25,330.25. A break below 25,300 could trigger further selling towards 25,269, while breaking the next resistance level of 25,347 could trigger bullishness towards the 25,383 level.
Bank Nifty started the session on a positive note at 55,158.35 and ended the session in the green at 55,493.30, above the 55,450 level. A break below 55,380 could trigger further selling towards 55,240, while breaking the next resistance level of 55,541 could trigger bullishness towards the 55,670 level.
Sensex also opened on a positive note at 82,506.40 and ended the session in the green at 82,693.71, above the 82,650 level. A break below 82,558 could trigger further selling towards 82,227, while breaking the next resistance level of 82,743 could lead towards the 83,042 level.
Given the ongoing volatility and mixed sentiments, it’s advisable to avoid aggressive positions and wait for clear directional moves above resistance or below support. Traders should consider these key support and resistance levels when entering long or short positions following the price break from these critical levels. Additionally, traders can combine moving averages to identify more accurate entry and exit points.
Disclaimer

The views and investment tips expressed by investment experts/broking houses/rating agencies on tradebrains.in are their own, and not that of the website or its management. Investing in equities poses a risk of financial losses. Investors must therefore exercise due caution while investing or trading in stocks. Trade Brains Technologies Private Limited or the author are not liable for any losses caused as a result of the decision based on this article. Please consult your investment advisor before investing.
About: Trade Brains Portal is a stock analysis platform. Its trade name is Dailyraven Technologies Private Limited, and its SEBI-registered research analyst registration number is INH000015729.
Investments in securities are subject to market risks. Read all the related documents carefully before investing.
Registration granted by SEBI and certification from NISM in no way guarantee performance of the intermediary or provide any assurance of returns to investors.
