
Domestic equity benchmarks opened on a mildly positive note but quickly lost momentum, reversing their recent winning streak. Despite starting higher, both the Nifty 50 and the Sensex slipped into negative territory by the close, reflecting broad-based profit booking across sectors. The indices remained technically strong by holding above key moving averages, yet sentiment weakened as traders booked gains after several sessions of steady advances. Momentum indicators stayed in the healthy zone, suggesting the market is not yet overextended but is experiencing short-term pressure.
Broader sectoral performance also turned negative, with realty, IT, and metal stocks leading the decline. Heavy selling in these sectors weighed on overall market sentiment, amplified by uncertainty around weekly derivatives expiry and lingering weakness in global cues. Asian markets mirrored this downbeat mood, reacting to a tech-led slump on Wall Street and concerns over rising bond yields in Japan, which collectively added to the cautious tone in domestic equities.
In this overview, we will analyse the key technical levels and trend directions for Nifty and BSE Sensex to monitor in the upcoming trading sessions. All the charts mentioned below are based on the 15-minute timeframe.
NIFTY 50 Chart & Price Action Analysis
To view other technical reports, click here
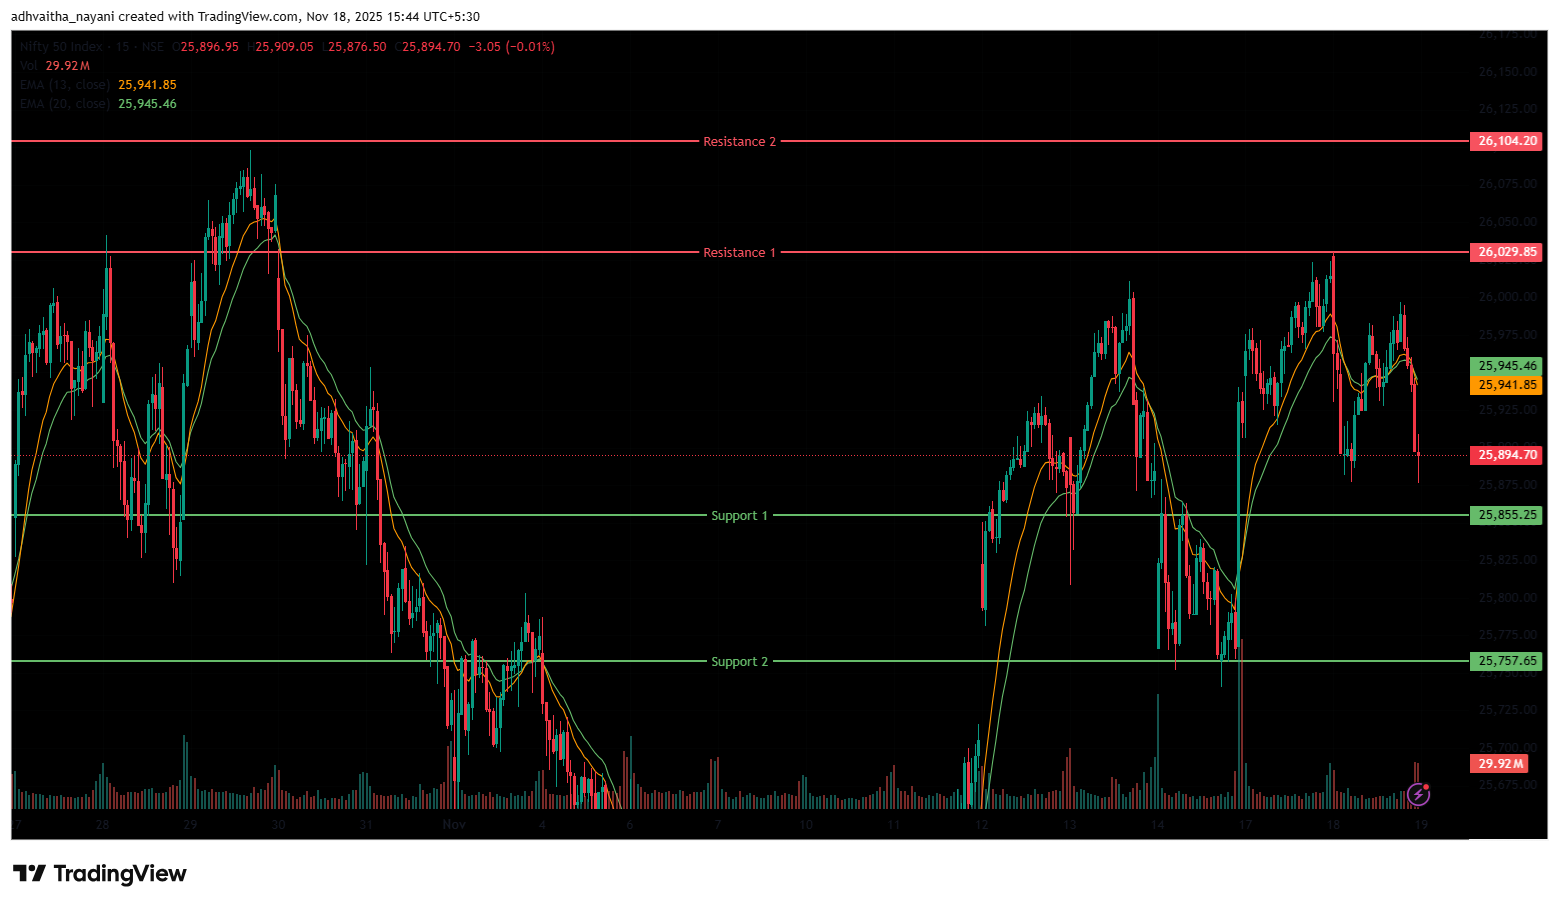
The Nifty 50 Index opened on a muted note at 26,021.80 on Tuesday, up by 8.35 points from Monday’s closing of 26,013.45. The index, though opening above the 26,000 level, failed to maintain the uptrend and broke the 6-day winning streak on Tuesday. Nifty 50 traded on a volatile trend in the morning session and was trading within the range of 25,850 and 25,980. In the afternoon session, the index continued its volatility and settled near the 25,910 level in the red, ending the session on a bearish note.
The Nifty index had reached a day’s high at 26,029.85 and saw a day’s low at 25,876.50. Finally, it had closed at 25,910.05, in the red, below the 26,000 level, down 103.40 points, or 0.40%. In the short term, the Index was above the 13/20 day EMA in the daily time frame, indicating an uptrend.
The index’s nearest resistance level is at 26,029.85 (R1), which is Tuesday’s high, and the index has failed to stay above this level multiple times. The higher resistance level is at 26,104.20 (R2), which is the 52-week high for the index. On the other hand, the closest support is now at 25,855.25 (S1), which was a previous resistance level but is acting as a support. If the index falls below this, the next support level to watch is at 25,757.65 (S2).
Trade Setup:
| Nifty 50 | |
| Resistance 2 | 26,104.20 |
| Resistance 1 | 26,029.85 |
| Closing Price | 25,910.05 |
| Support 1 | 25,855.25 |
| Support 2 | 25,757.65 |
NIFTY 50 Momentum Indicators Analysis
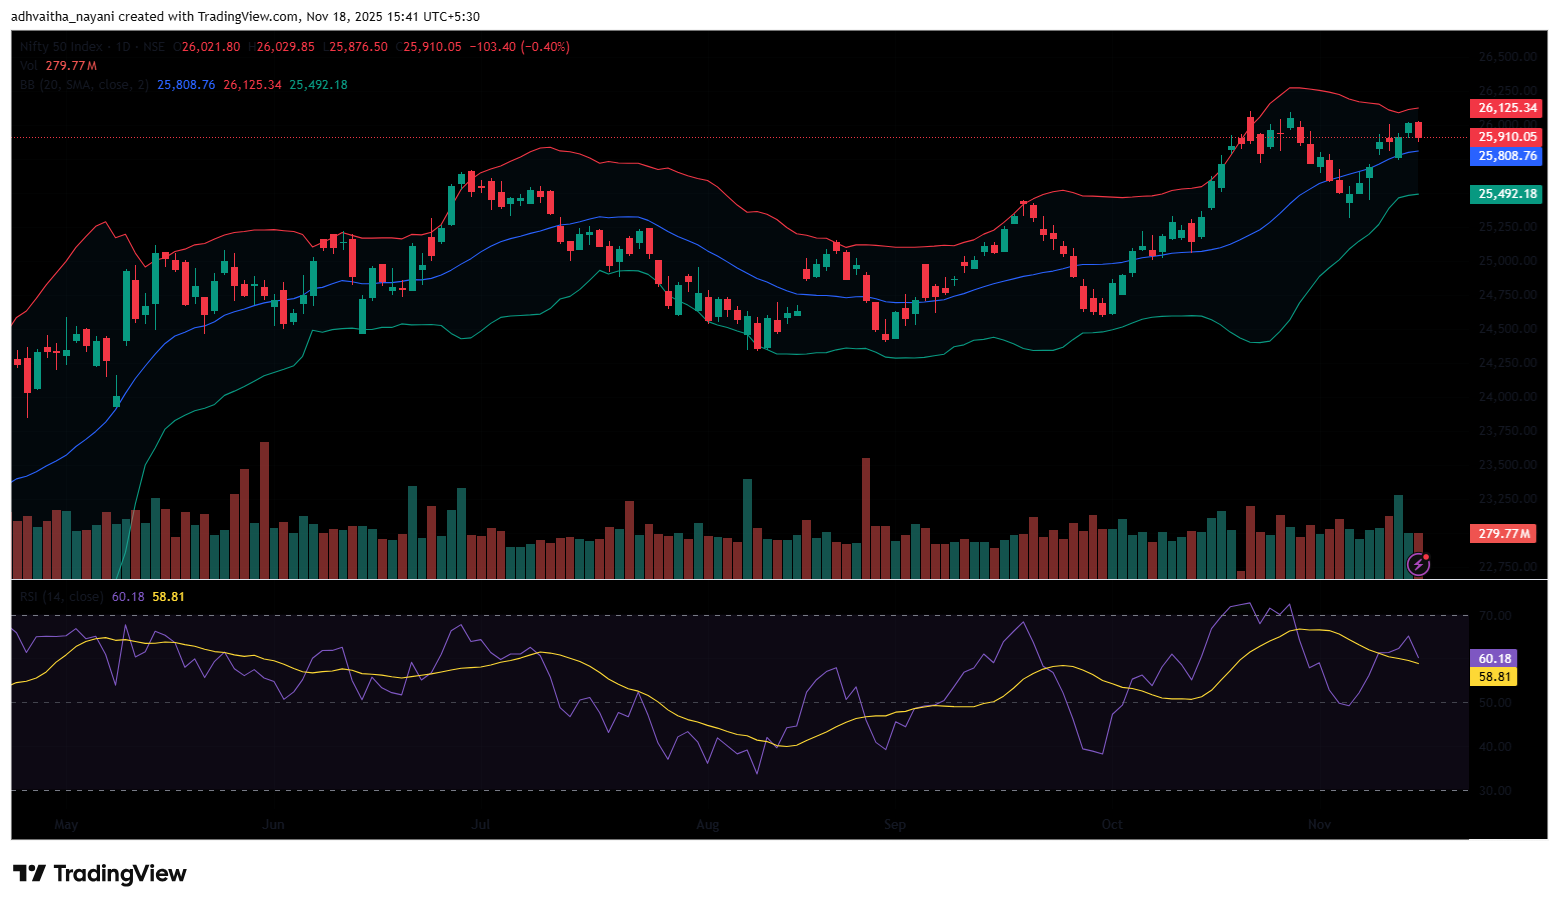
RSI (Daily): The Nifty 50’s RSI stood at 60.18, which is below the overbought zone of 70, indicating bullish sentiment and room to grow higher.
Bollinger Bands (Daily): The index is trading in the upper band of the Bollinger Band range (Simple Moving Average). Its position in the upper range suggests a bullish sentiment in the near term. However, on Tuesday’s session, the Index formed a bearish candle. The index took support near 25,900, and 26,000 acted as a resistance level. A sustained move above the middle band signals a bullish sentiment, while a drop back toward the lower band may reinforce bearish sentiment.
Volume Analysis: Tuesday’s trading session had an average volume of 280 Mn.
Derivatives Data: The options open interest data shows strong put writing around the 25,900 and 25,800 strikes, suggesting that traders are building a potential support base in that area. On the upside, there is notable call OI accumulation at the 25,950 and 26,000 levels, indicating possible resistance there. The Put/Call Ratio (PCR) comes in at 0.88, which is less than 1 and generally reflects mildly bullish or neutral sentiment rather than outright pessimism. Meanwhile, a short build-up (fresh short positions) suggests that some traders are still positioning for a near-term drop. Taken together, these signals point to a mixed outlook: there is both downside protection (via puts) and some resistance pressure (via calls), leaning slightly toward cautious bearishness in the short run.
Bank Nifty Chart & Price Action Analysis
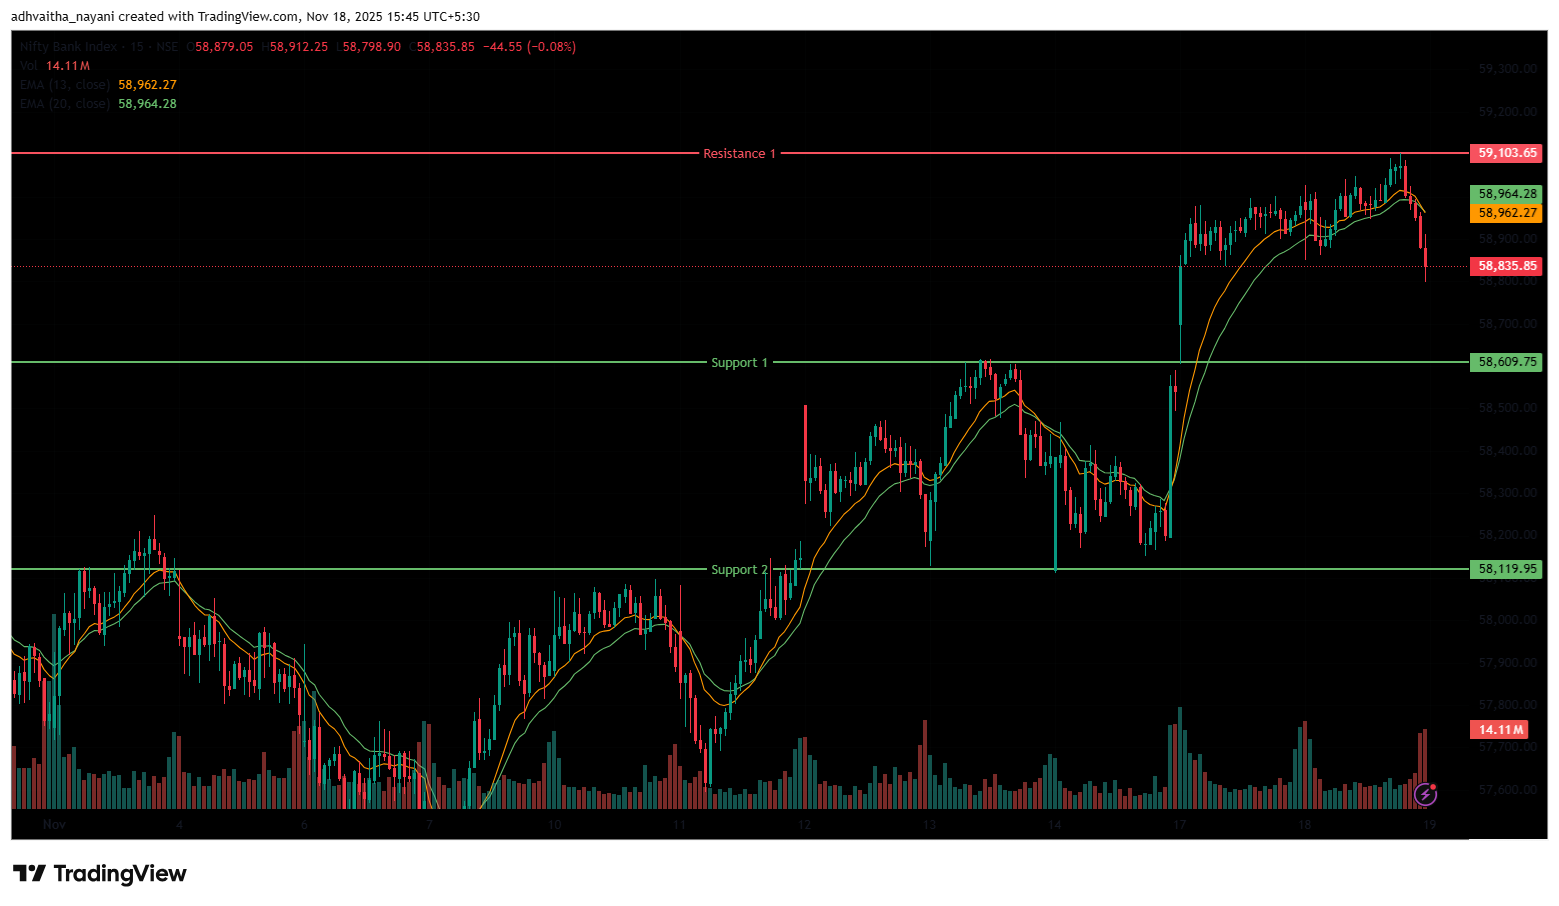
The Bank Nifty Index opened more on a flatter note at 58,990.50 on Tuesday, up by 27.8 points from Monday’s closing of 58,962.70. Bank Nifty index also had an overall volatile trading session on Tuesday, and in the morning session, it traded between the 58,880 and 59,000 levels. In the afternoon session, the index continued to trade near the 59,000 level, marking its 52-week high at 59,103.65, crossing above the 59,100 mark; however, it later recovered from the day’s high and ended the day in the red.
The Bank Nifty index had peaked at 59,103.65 and made a day’s low at 58,798.90. Finally, it had closed in the red at 58,899.25, near the 58,900 level, losing 63.45 points or 0.11%. The Relative Strength Index (RSI) stood at 70 in the overbought zone in the daily time frame. In the short term, the Index was above the 13/20 day EMA in the daily time frame, indicating an uptrend.
The higher resistance level is at 59,103.65 (R1), which is the 52-week high for the index. On the other hand, the closest support is now at 58,609.75 (S1), which was a previous resistance level but has turned into support. If the index falls below this, the next support level to watch is at 58,119.95 (S2).
Trade Setup:
| Bank Nifty | |
| Resistance 1 | 59,103.65 |
| Closing Price | 58,899.25 |
| Support 1 | 58,609.75 |
| Support 2 | 58,119.95 |
BSE Sensex Chart & Price Action Analysis
To view other technical reports, click here
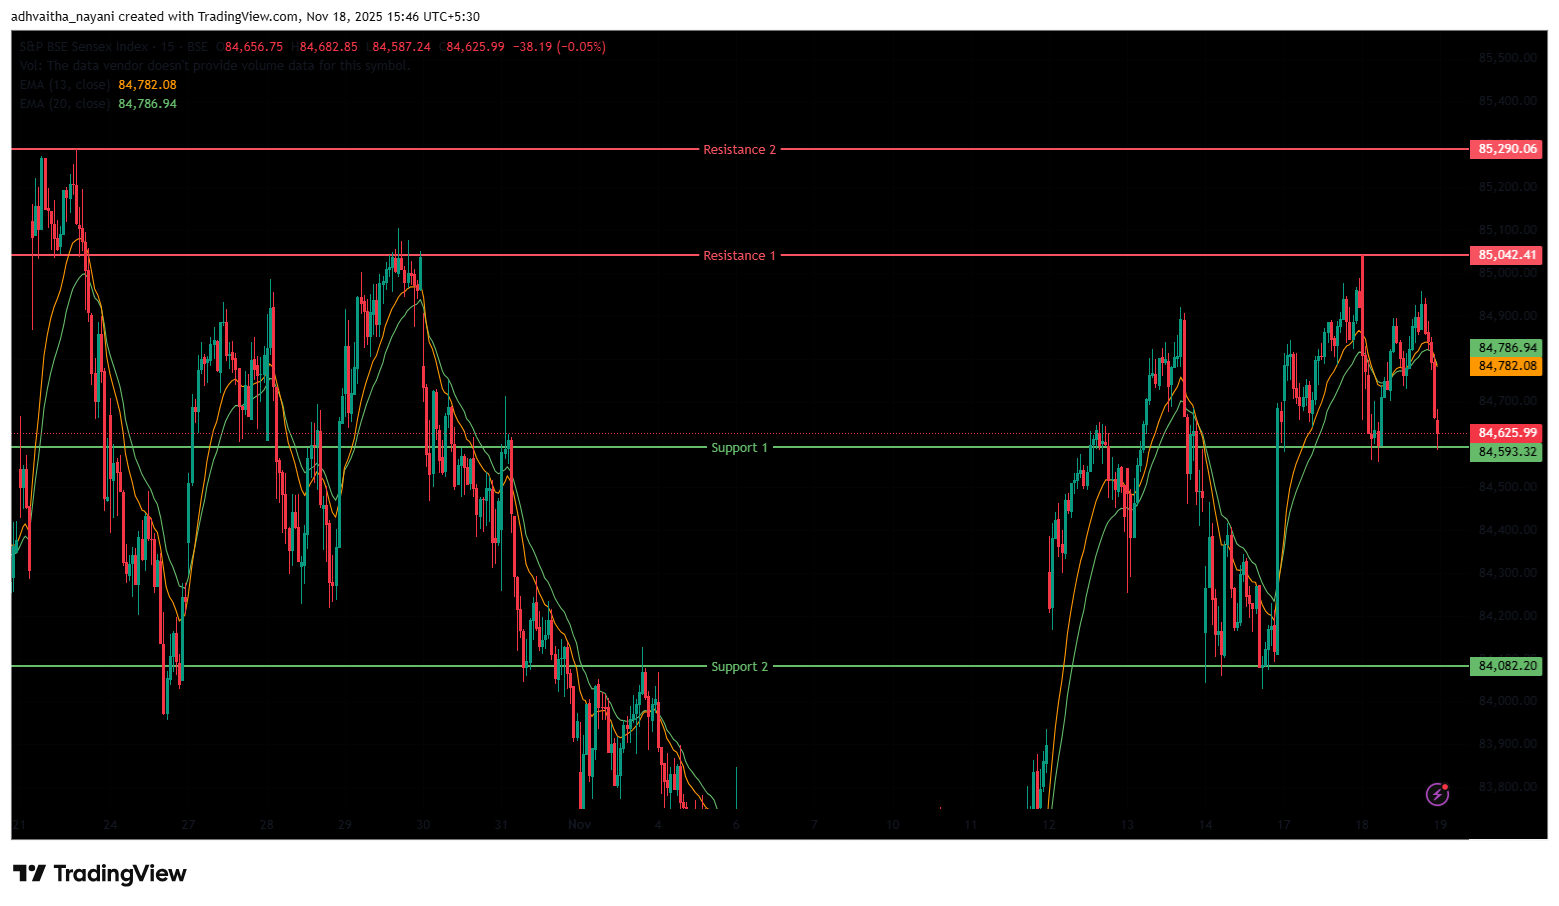
The BSE Sensex Index opened on a slightly positive note at 85,042.37 on Tuesday, up by 91.42 points from Monday’s closing of 84,950.95. The Sensex index continued to trade in a similar volatile pattern as the Nifty 50, and was trading between the range of 84,600 and 84,900 during the morning session. In the afternoon session, the index continued its volatile trend and was trading between the range of 84,650 and 84,950 in the afternoon session.
The BSE Sensex index had peaked at 85,042.42 and made a day’s low at 84,558.36. Finally, it had closed at 84,673.02 in red, losing 277.93 points or 0.33%. The Relative Strength Index (RSI) stood at 61.66, below the overbought zone of 70 in the daily time frame. In the short term, the Index was above the 13/20 day EMA in the daily time frame, indicating an uptrend.
The index faces its immediate resistance at 85,042.41 (R1), which is Tuesday’s high and a previous resistance level. Whereas, its next resistance is at 85,290.06 (R2), a level it has struggled to sustain above and the 52-week high. On the downside, support lies at 84,593.32 (S1), a former resistance level which turned into support, and the next stronger support (S2) is at 84,082.20.
Trade Setup:
| Sensex | |
| Resistance 2 | 84,290.06 |
| Resistance 1 | 85,042.41 |
| Closing Price | 84,673.02 |
| Support 1 | 84,593.32 |
| Support 2 | 84,082.20 |
Market Recap on November 18th, 2025
On Tuesday, the Nifty 50 opened slightly higher at 26,021.8, up by 8.35 points from its previous close of 26,013.45. The index hit an intraday low of 25,876.5 and closed below the 26,000 level at 25,910.05, down -103.40 points, or 0.40%. The index closed above all key moving averages (20/50/100/200-day EMAs) on the daily chart. The BSE Sensex followed the same trajectory, opening on a positive trend at 85,042.37, up 91.42 points from the previous close of 84,950.95.
It closed at 84,673.02, down -277.93 points, or 0.33%. Both indices showed high momentum, with RSI values for Nifty 50 at 60.18 and Sensex at 61.66, below the overbought threshold of 70. The broad indices witnessed a snap in the six-day gains due to the weak global markets, profit booking across sectors, high selling pressure in IT and Metal stocks and Volatility due to weekly F&O expiry.
On Tuesday, all indices show a bearish reaction, with no major indices in positive territory. The Nifty Realty index was the major loser, falling 1.9% or -18.05 points, and standing at 927.30. Stocks such as Sobha Ltd fell 2.9%, followed by DLF Ltd and Lodha Developers Ltd, which decreased by up to 2.4% on Tuesday. The Nifty IT index was also among the biggest losers, falling 1.1% or -400 points, and standing at 35,975.2.
Stocks such as Tech Mahindra Ltd was down 2.1% on Tuesday. While other IT stocks like LTIMindtree Ltd, Infosys Ltd, and Oracle Financial Services Software Ltd also decreased by up to 1.6%. The Nifty Metal index was also among the top losers, falling 1.1% or -552.3 points, and standing at 10,383.7. Asian markets had a negative sentiment on Tuesday. Japan’s Nikkei 225 declined by -1,620.93 points or -3.22%, closing at 48,702.98.
China’s Shanghai Composite decreased by -32.22 points, or -0.81%, to 3,939.81, while Hong Kong’s Hang Seng Index plummeted by -454.25 points, or -1.72%, to close at 25,930.03. On the other hand, South Korea’s KOSPI fell by -135.63 points or -3.32%, closing at 3,953.62. The fall in Asian markets was mainly due to a tech-led slide on Wall Street, pressured ahead of Nvidia’s earnings and rising bond yields in Japan (the highest since July 1999).
India VIX
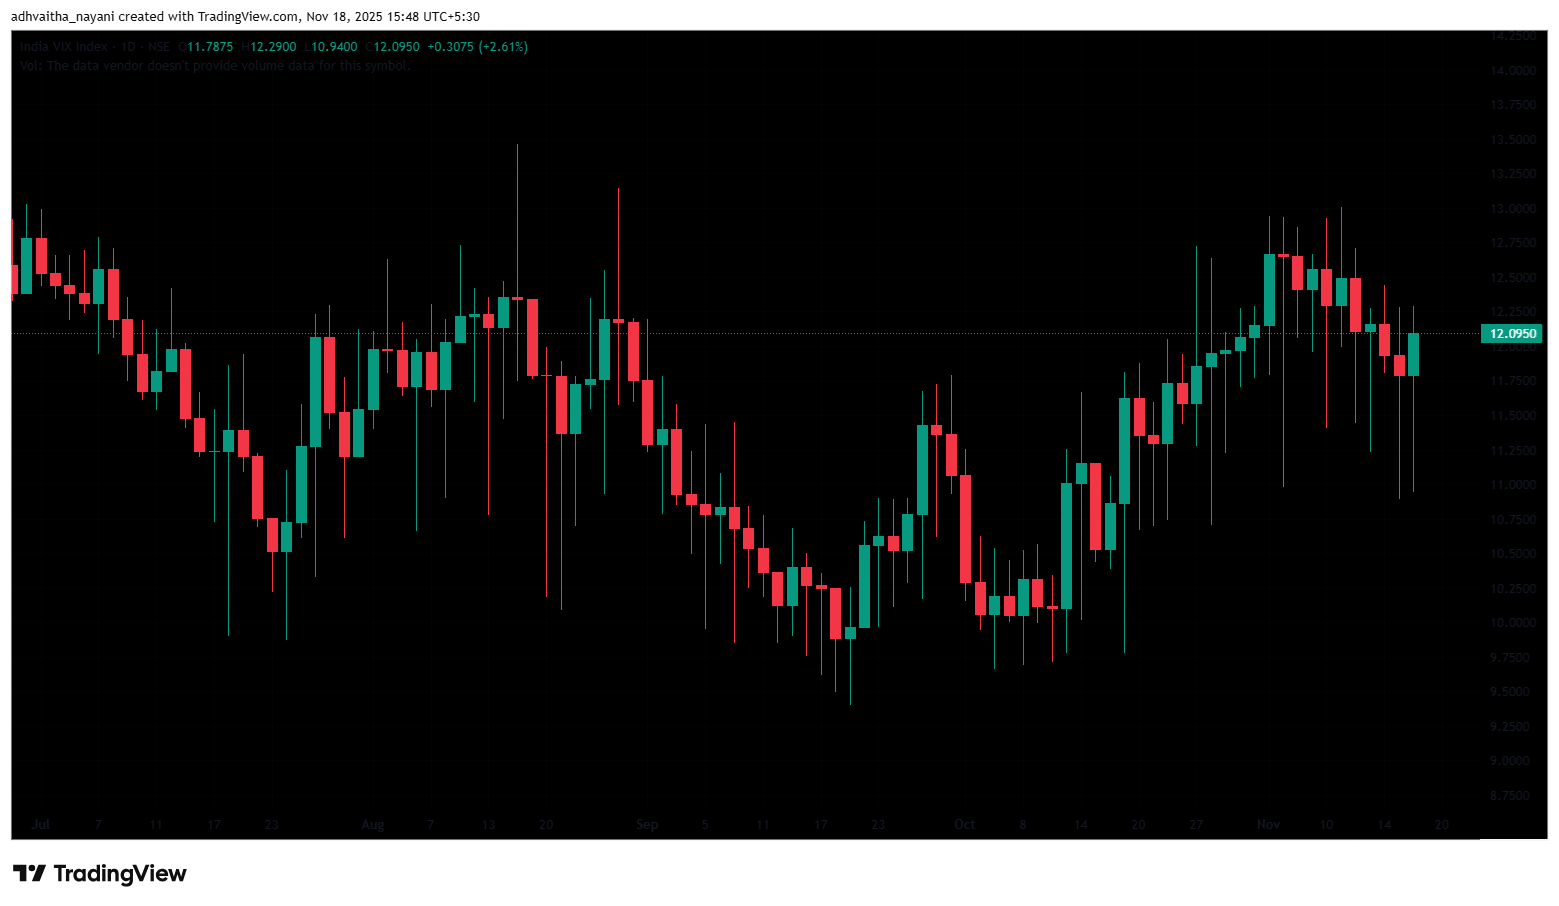
The India VIX increased 0.31 points or 2.61%, from 11.79 to 12.10 during Tuesday’s session. An increase in the India VIX typically indicates higher price volatility in the stock market, and the broader indices ended the session on a volatile note on Tuesday. However, a stable market environment and minimal volatility are anticipated when the India VIX is below 15.
Given the ongoing volatility and mixed sentiments, it’s advisable to avoid aggressive positions and wait for clear directional moves above resistance or below support. Traders should consider these key support and resistance levels when entering long or short positions following the price break from these critical levels. Additionally, traders can combine moving averages to identify more accurate entry and exit points.
Disclaimer

The views and investment tips expressed by investment experts/broking houses/rating agencies on tradebrains.in are their own, and not that of the website or its management. Investing in equities poses a risk of financial losses. Investors must therefore exercise due caution while investing or trading in stocks. Trade Brains Technologies Private Limited or the author are not liable for any losses caused as a result of the decision based on this article. Please consult your investment advisor before investing.
About: Trade Brains Portal is a stock analysis platform. Its trade name is Dailyraven Technologies Private Limited, and its SEBI-registered research analyst registration number is INH000015729.
Investments in securities are subject to market risks. Read all the related documents carefully before investing.
Registration granted by SEBI and certification from NISM in no way guarantee performance of the intermediary or provide any assurance of returns to investors.
