
The overall market sentiment on Thursday was notably positive, driven by easing geopolitical tensions and supportive global cues. Investor confidence received a boost following the US Federal Reserve’s decision to cut interest rates, which signalled a more accommodative monetary stance. This development, combined with improving trade relations between India and the US, reinforced optimism among market participants.

Benchmark indices reflected this upbeat mood, opening strong and sustaining momentum throughout the session. Technical indicators also showed continued strength, with key indices holding above major moving averages, suggesting a bullish undertone. Sector-wise, the mood was largely favourable, with pharma and IT stocks leading the charge.

The healthcare segment stood out amid increased investor interest in defensives, supported by strong performances from several leading companies. The technology space also gained ground, backed by buying in frontline IT names. However, not all sectors shared in the rally. The energy and media indices faced some selling pressure, possibly due to sector-specific concerns or profit booking.
In this overview, we will analyse the key technical levels and trend directions for Nifty and BSE Sensex to monitor in the upcoming trading sessions. All the charts mentioned below are based on the 5-minute timeframe.
Nifty 50
(In this analysis, we have used 20/50/100/200 EMAs, where 20 EMA (Red), 50 EMA (Orange), 100 EMA (Light Blue), and 200 EMA (Dark Blue)).
To view other technical reports, click here
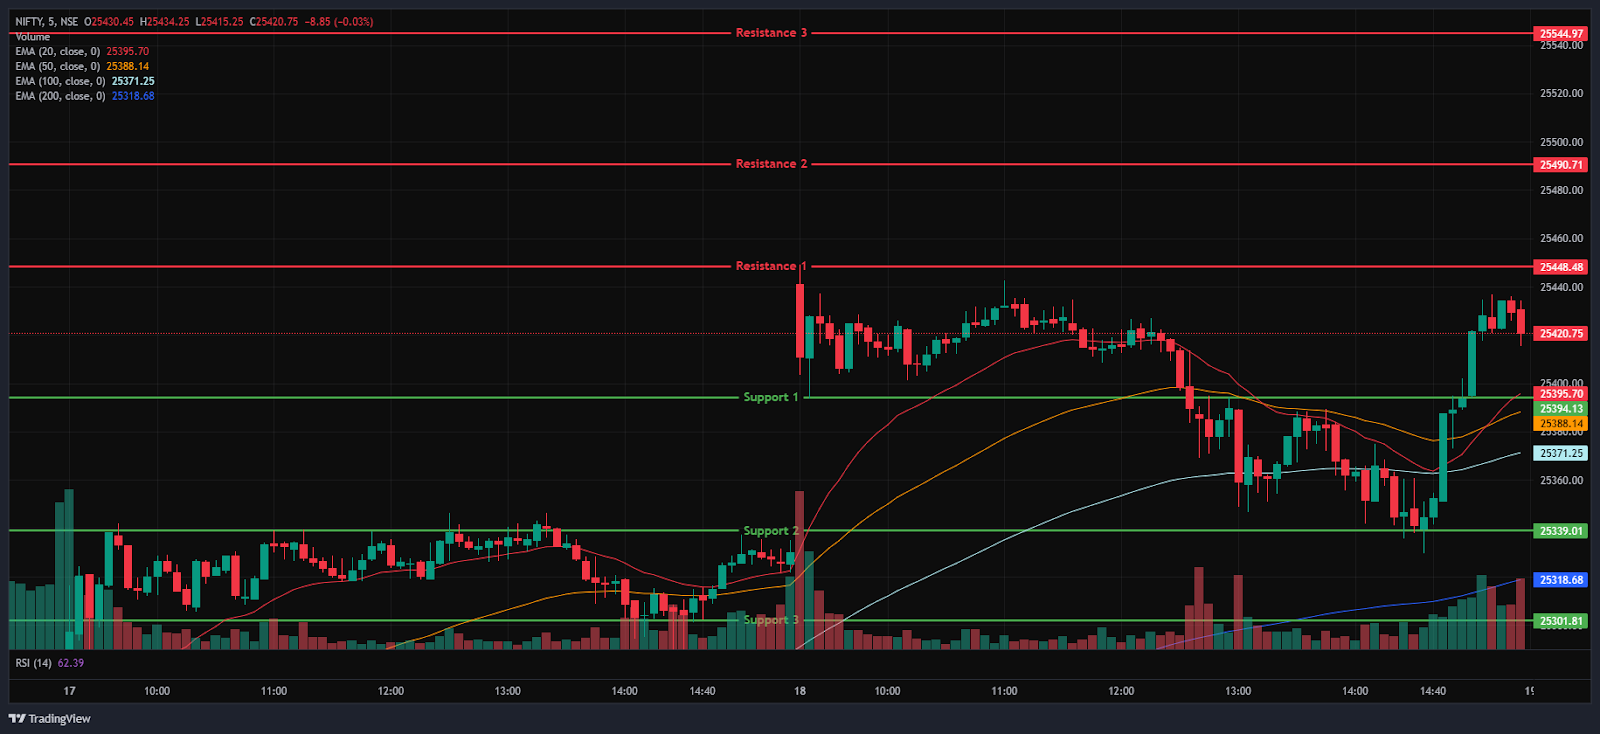
The Nifty 50 Index opened on a positive note at 25,441.05 on Thursday, up by 110.8 points from Wednesday’s closing of 25,330.25. With a gap-up start to the day, the index jumped over the 25,449 mark, reaching its day high in the morning session and trading below its opening level at 25,386. Additionally, the Index stood above the EMAs of 50/100/200 but remained below the 20 EMA in the 15-minute time frame during the morning session and was traded between 25,369 and 25,449.
The index lost its momentum in the afternoon session, reaching its day low at 25,330. Further, the Index recovered from the day’s lowand held above the 25,400 level, trading in green. Overall, the index ended in a bullish state on the Wednesday session. During the afternoon session, the Nifty 50 was traded above all four EMAs of 20/50/100/200 in the 15-minute time frame. Nifty’s immediate resistance levels are R1 (25,448), R2 (25,491), and R3 (25,545), while immediate support levels are S1 (25,394), S2 (25,339), and S3 (25,302).
The Nifty index had reached a day’s high at 25,448.95 and saw a day’s low at 25,329.75. Finally, it had closed at 25,423.60, in green above the 25,400 level, gaining 93.35 points, or 0.37%. The Nifty 50 closed above all four EMAs of 20/50/100/200 EMAs in the daily time frame.
Momentum Indicators
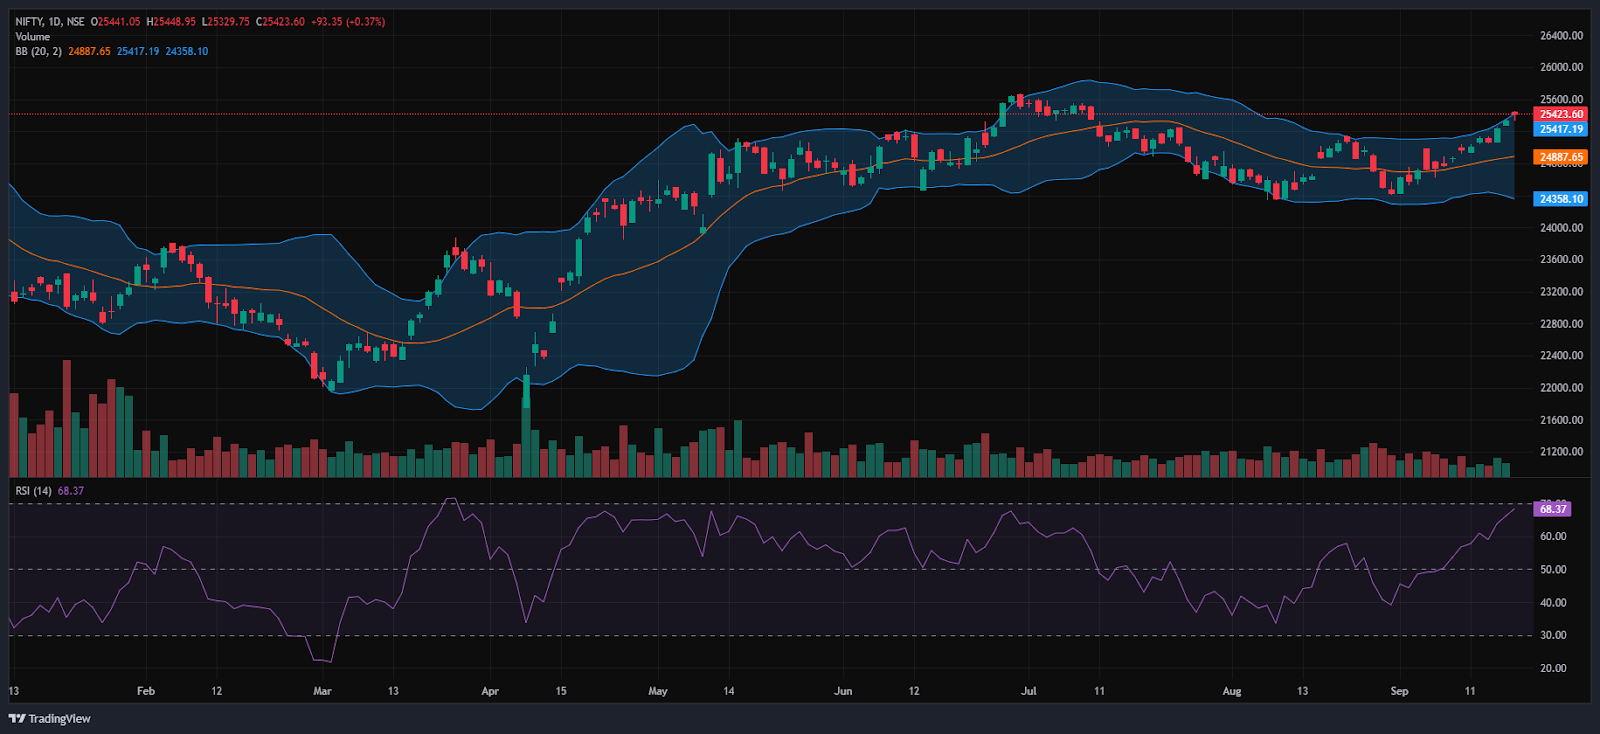
RSI (Daily): The Nifty 50’s RSI stood at 68.37, which is well below the overbought zone of 70, indicating a bullish sentiment.
Bollinger Bands (Daily): The index is trading in the upper band of its Bollinger Band range above the middle band (Simple Moving Average). Its position in the upper range, along with solid resistance around the 25,450 level in Thursday’s session, and the Index forming a Hanging man pattern at the upper band of a Bollinger Band is a potential bearish reversal signal. A sustained move above the middle band signals a bullish sentiment, while a drop back toward the lower band may reinforce bearish sentiment.
Volume Analysis: Thursday’s trading session average volumes stood at 272.19 Mn.
Derivatives Data: Options OI indicates strong Put writing at 25,400, following 25,300, establishing it as a firm support zone. On the upside, a significant Call OI buildup at 25,500 and 25,600 suggests a potential resistance supply. PCR (Put/Call Ratio) stands at 1.0933 (>1), leaning towards mild bearishness and the Short Buildup signals traders are expecting more downside, with an overall bearish outlook for the next trading session.
Bank Nifty
(In this analysis, we have used 20/50/100/200 EMAs, where 20 EMA (Red), 50 EMA (Orange), 100 EMA (Light Blue), and 200 EMA (Dark Blue)).
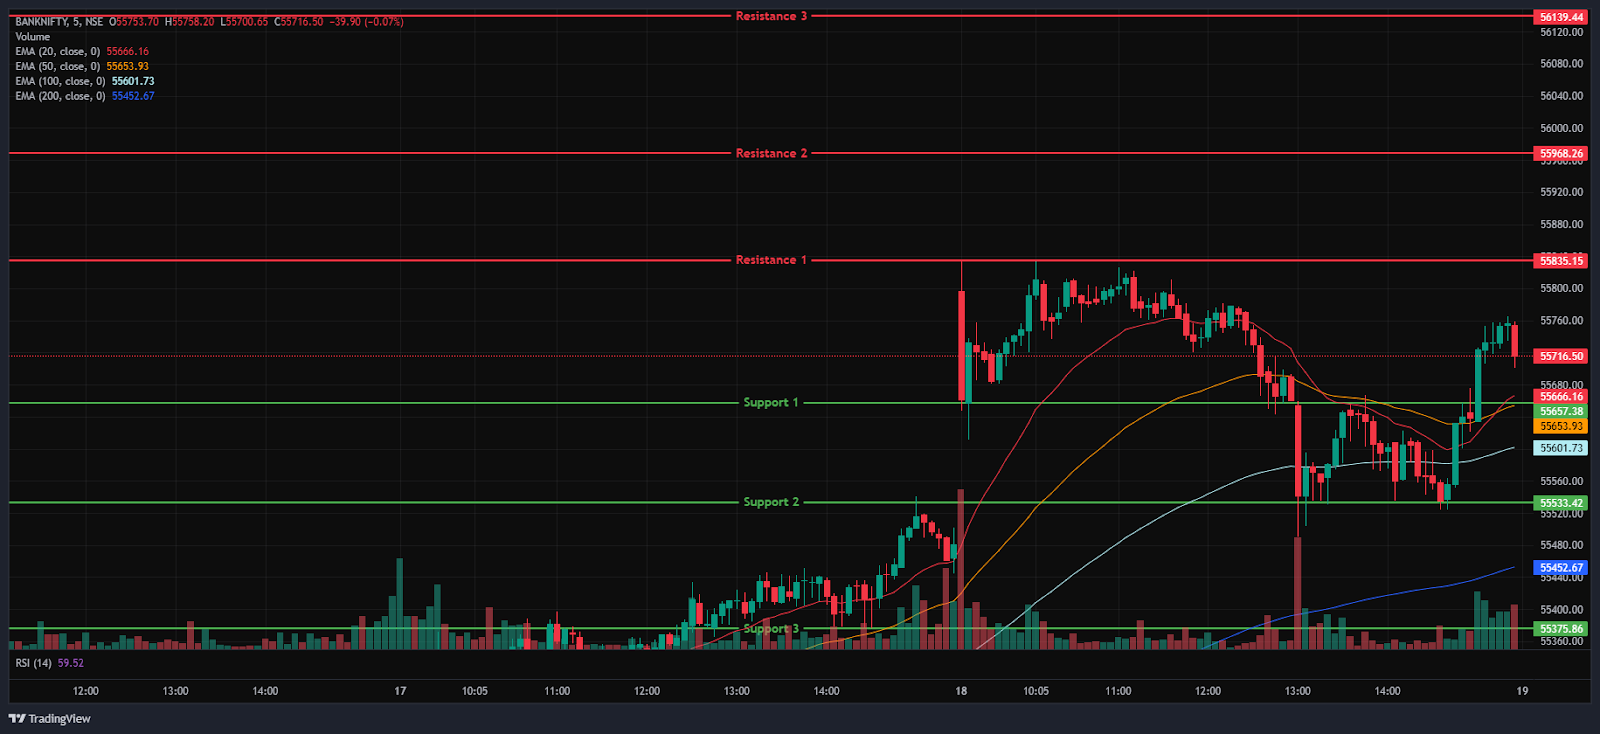
The Bank Nifty Index started the session on a positive note at 55,797.10 on Thursday, up by 303.8 points from Wednesday’s closing of 55,493.30. The index started the day on a gap-up and made its day high at 55,835 and was trading below its opening level of 55,649. In addition, the index was trading between the 55,611 and 55,835 levels in the morning session and was above all four EMAs of 20/100/50/200 in the 15-minute time frame.
The Index lost its momentum and fell as low as making the day’s low at 55,491 in the afternoon session but later recovered from day low and held above the 55,700 mark, was trading in green. During the afternoon session, Bank Nifty closed above all four EMAs of 20/50/100/200 in the 15-minute time frame. Bank Nifty immediate resistance levels are R1 (55,835), R2 (55,968), and R3 (56,139), while immediate support levels are S1 (55,657), S2 (55,533), and S3 (55,376).
The Bank Nifty index had peaked at 55,835.25 and made a day’s low at 55,490.90. Finally, it had closed in green at 55,727.45, traded above the 55,700 level, gaining 234.15 points or 0.42%. The Relative Strength Index (RSI) stood at 62.67 well below the overbought zone of 70 in the daily time frame, and Bank Nifty closed above all four EMAs of 20/50/100/200 in the daily time frame.
Sensex
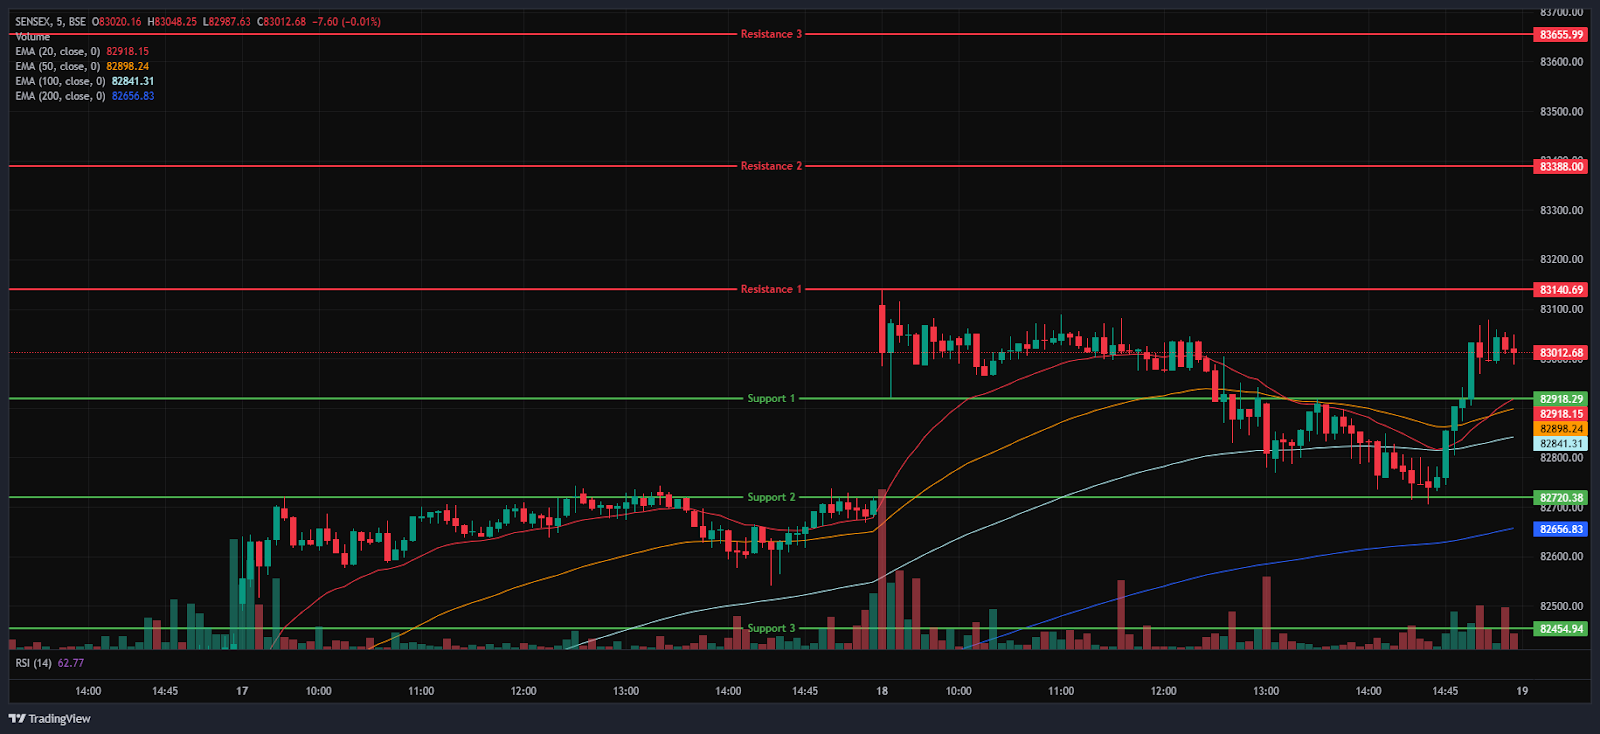
(In this analysis, we have used 20/50/100/200 EMAs, where 20 EMA (Red), 50 EMA (Orange), 100 EMA (Light Blue), and 200 EMA (Dark Blue)).
To view other technical reports, click here
The BSE Sensex Index opened on a positive note at 83,108.92 on Thursday, up by 415.21 points from Wednesday’s closing of 82,693.71. The Index reached its day high at 83,141 after a gap-up start to the morning session. Additionally, the Index failed to hold the level, falling to 82,829 and trading below its opening level at 82,878. The Index was trading between 82,830 and 83,140 throughout the morning session’s 15-minute time frame, above the 50/100/200 EMAs but below the 20 EMA.
The Index dropped further, hitting a day low of 82,700. However, in the afternoon session, the Index bounced back from its day low and remained above the 83,000 mark, maintaining its overall bullish trend and trading above all four EMAs of 20/50/100/200 in the 15-minute time frame. BSE Sensex immediate resistance levels are R1 (83,141), R2 (83,388), and R3 (83,656), while immediate support levels are S1 (82,918), S2 (82,720), and S3 (82,455).
The BSE Sensex index had peaked at 83,141.21 and made a day’s low at 82,704.92. Finally, it had closed at 83,013.96 in green, gaining 320.25 points or 0.39%. The Relative Strength Index (RSI) stood at 67.93 (below the overbought zone of 70) in the daily time frame, and the BSE Sensex closed above all four EMAs of 20/50/100/200 in the daily time frame.
India VIX
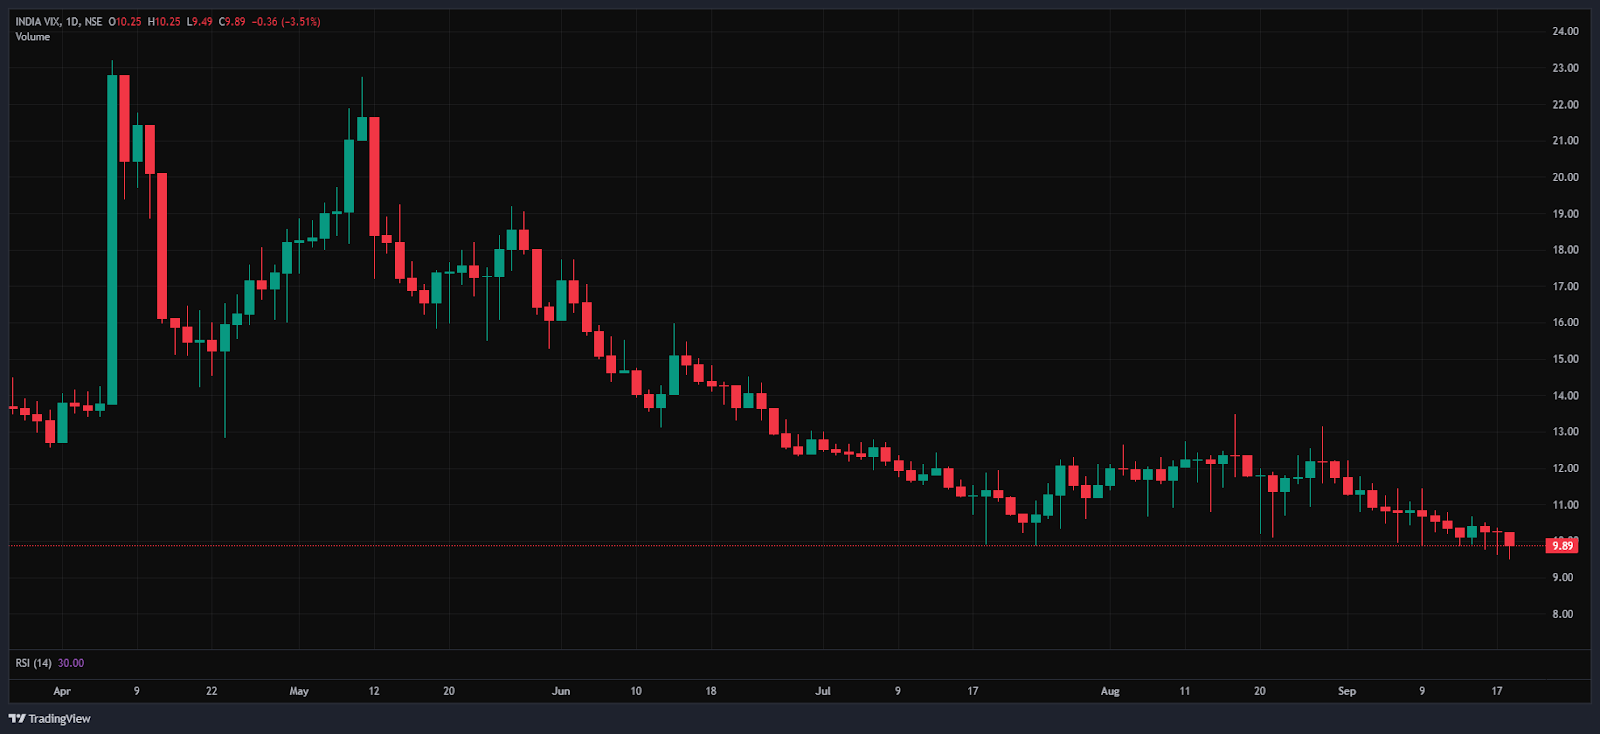
The India VIX decreased by 0.36 points or 3.54%, from 10.25 to 9.88 during Thursday’s session. A decrease in the India VIX typically indicates lower price volatility in the stock market, suggesting a more stable market environment. However, a stable market environment and minimal volatility are anticipated when the India vix is below 15.
Market Recap on the 18th of September 2025
On Thursday, the Nifty 50 opened on a strong note above the 25,400 mark at 25,441.05, rising 110.8 points from its previous close of 25,330.25. It touched an intraday high of 25,448.95 before ending the session at 25,423.60, up 93.35 points, or 0.37%. From a technical standpoint, the index continued to trade above all four key exponential moving averages (20/50/100/200-day) on the daily chart. The BSE Sensex also exhibited a positive trajectory, opening at 83,108.92, up 415.21 points from its previous close of 82,693.71.
It mirrored Nifty 50’s movement and settled above the 83,000 level at 83,013.96, registering a gain of 320.25 points, or 0.39%. Momentum indicators reflected moderate strength, with the RSI for the Nifty 50 at 68.37 and for the Sensex at 67.93, both nearing the overbought threshold of 70. The Bank Nifty Index also ended in positive territory, rising 234.15 points, or 0.42%, to close at 55,727.45.
Investor sentiment remained upbeat, supported by easing trade tensions between India and the US, along with the 25-basis-point interest rate cut announced by the US Federal Reserve, both of which fueled the market’s upward momentum.
Most sectoral indices ended in the green on Thursday. The Nifty Pharma Index stood out as the top performer, jumping 333 points, or 1.5%, to close at 22,574.35. Biocon Ltd led the rally with a 4.0% gain. Other notable gainers in the index included Laurus Labs Ltd, Glenmark Pharmaceuticals Ltd, and Natco Pharma Ltd, each rising by up to 3.3%.
The Nifty Healthcare Index also advanced, climbing 195.6 points, or 1.3%, to settle at 14,855.15. Top performers included Biocon Ltd, Laurus Labs Ltd, Glenmark Pharmaceuticals Ltd, and Aurobindo Pharma Ltd. The Nifty IT Index posted solid gains as well, closing at 36,750.25, up 303.10 points, or 0.8%. Tech majors like LTIMindtree Ltd, Coforge Ltd., Infosys Ltd., and Wipro Ltd registered gains of up to 1.9%.
On the flip side, the Nifty Energy Index was the biggest laggard, ending the session at 35,442.10, down 125.95 points, or 0.4%. Hitachi Energy India Ltd declined 3.6%, while Reliance Power Ltd, Aegis Logistics Ltd, and Coal India Ltd fell by up to 2.9%. The Nifty Media Index also edged lower, slipping 4.85 points, or 0.3%, to close at 1,627.65. Stocks like Dish TV India Ltd, Tips Music Ltd, Network 18 Media & Investments Ltd, and PVR Inox Ltd dropped by up to 1.9%.
Asian markets displayed a mixed trend on Thursday. China’s Shanghai Composite Index closed lower at 3,831.66, down 44.68 points, or 1.17%. Similarly, Hong Kong’s Hang Seng Index dropped 346.39 points, or 1.30%, to end at 26,562. On the other hand, South Korea’s KOSPI Index rose 47.90 points, or 1.38%, to close at 3,461.30. Japan’s Nikkei 225 Index also posted gains, adding 591.62 points, or 1.30%, to finish at 45,382. As of 5:03 p.m. IST, US Dow Jones Futures were trading at 46,320.32, up 316 points, or 0.69%.
Trade Setup Summary
The Nifty 50 opened on a positive note at 25,441.05 on Thursday and ended the session in the green above the 25,400 level at 25,423.60. A break below 25,394 could trigger further selling towards 25,339, while breaking the next resistance level of 25,448 could trigger bullishness towards the 25,491 level.
Bank Nifty started the session on a positive note at 55,797.10 and ended the session in the green at 55,727.45, above the 55,700 level. A break below 55,657 could trigger further selling towards 55,533, while breaking the next resistance level of 55,835 could trigger bullishness towards the 55,968 level.
Sensex also opened on a positive note at 83,108.92 and ended the session in the green at 83,013.96, above the 83,000 level. A break below 82,918 could trigger further selling towards 82,720, while breaking the next resistance level of 83,141 could lead towards the 83,388 level.
Given the ongoing volatility and mixed sentiments, it’s advisable to avoid aggressive positions and wait for clear directional moves above resistance or below support. Traders should consider these key support and resistance levels when entering long or short positions following the price break from these critical levels. Additionally, traders can combine moving averages to identify more accurate entry and exit points.
Disclaimer

The views and investment tips expressed by investment experts/broking houses/rating agencies on tradebrains.in are their own, and not that of the website or its management. Investing in equities poses a risk of financial losses. Investors must therefore exercise due caution while investing or trading in stocks. Trade Brains Technologies Private Limited or the author are not liable for any losses caused as a result of the decision based on this article. Please consult your investment advisor before investing.
About: Trade Brains Portal is a stock analysis platform. Its trade name is Dailyraven Technologies Private Limited, and its SEBI-registered research analyst registration number is INH000015729.
Investments in securities are subject to market risks. Read all the related documents carefully before investing.
Registration granted by SEBI and certification from NISM in no way guarantee performance of the intermediary or provide any assurance of returns to investors.
