The Nifty 50 started the day on a positive note with a gap-up opening, reflecting early optimism among investors. However, the initial enthusiasm faded as the session progressed, leading to a decline by the close.
Despite this pullback, the technical indicators suggested that the index remained in a relatively strong position, showing resilience amid the market fluctuations.
Sector-wise, the market displayed a mixed sentiment. Public sector banks showed strong buying interest, lifting the PSU Bank index with some major stocks rallying significantly.
On the other hand, private banks faced selling pressure, weighing on the private bank index. Defence stocks also attracted buying, contributing to gains in that segment, indicating selective optimism in specific sectors amid broader cautiousness.
In this overview, we will analyze the key technical levels and trend directions for Nifty and BSE Sensex to monitor in the upcoming trading sessions. All the charts mentioned below are based on the 5-minute timeframe.
NIFTY 50 Chart & Price Action Analysis
(In this analysis, we have used 20/50/100/200 EMAs, where 20 EMA (Red), 50 EMA (Orange), 100 EMA (Light Blue), 200 EMA (Dark Blue)).
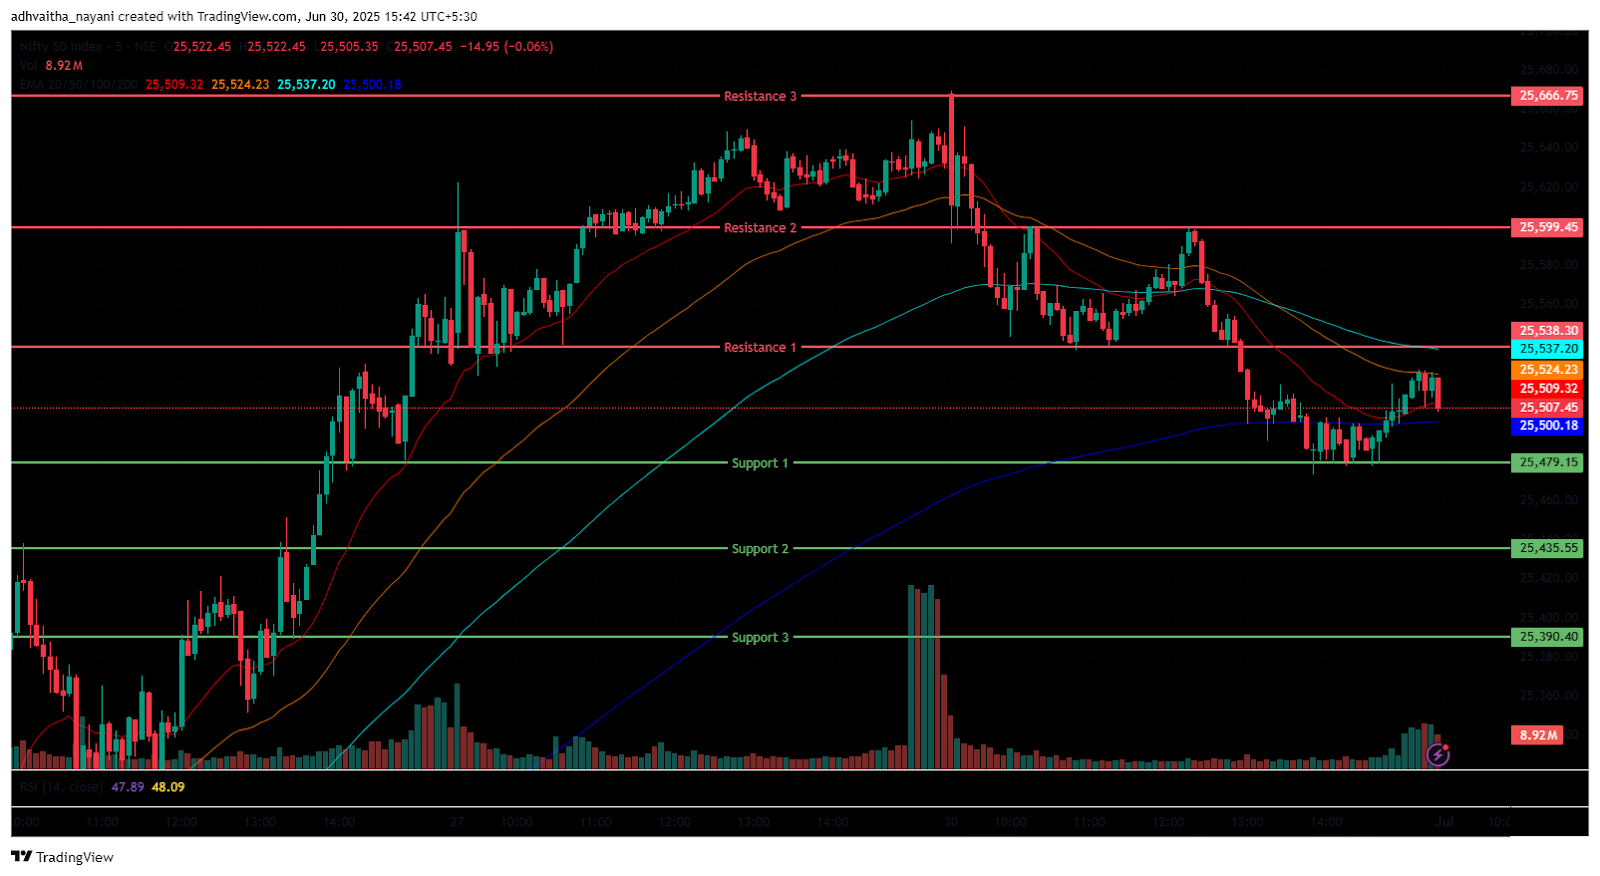
The Nifty 50 Index opened on a slightly positive note at 25,662 on Monday, up by 24 points from Friday’s closing of 25,638. The Nifty Index traded in the red in the morning session, slightly consolidating around the 25,550 level. It was trading below the opening level, gradually declining to the 25,500 range from 25,650, and was above 50/100/200 EMAs in the 15-minute time frame in the morning session but below the 20-day EMA. In the afternoon session, the Nifty Index reached its day’s low at 25,473, consolidating at the 25,500 range, and closed at 25,517. It stayed above 100/200 EMAs but below the 20/50 EMAs in the 15-minute time frame.
Nifty’s immediate resistance levels are R1 (25,538), R2 (25,599), and R3 (25,667), while immediate support levels are S1 (25,479), S2 (25,435), and S3 (25,390). The Nifty index had reached a day’s high at 25,669, but closed in red below the 25,600 mark, and saw a day’s low at 25,473. Finally, it had closed at 25,517, losing 121 points or 0.47%. The Relative Strength Index (RSI) stood at 63.84 (below the overbought zone of 70) in the daily time frame, and Nifty 50 closed above the four 20/50/100/200 EMAs in the daily time frame.
Bank Nifty Chart & Price Action Analysis
(In this analysis, we have used 20/50/100/200 EMAs, where 20 EMA (Red), 50 EMA (Orange), 100 EMA (Light Blue), 200 EMA (Dark Blue)).
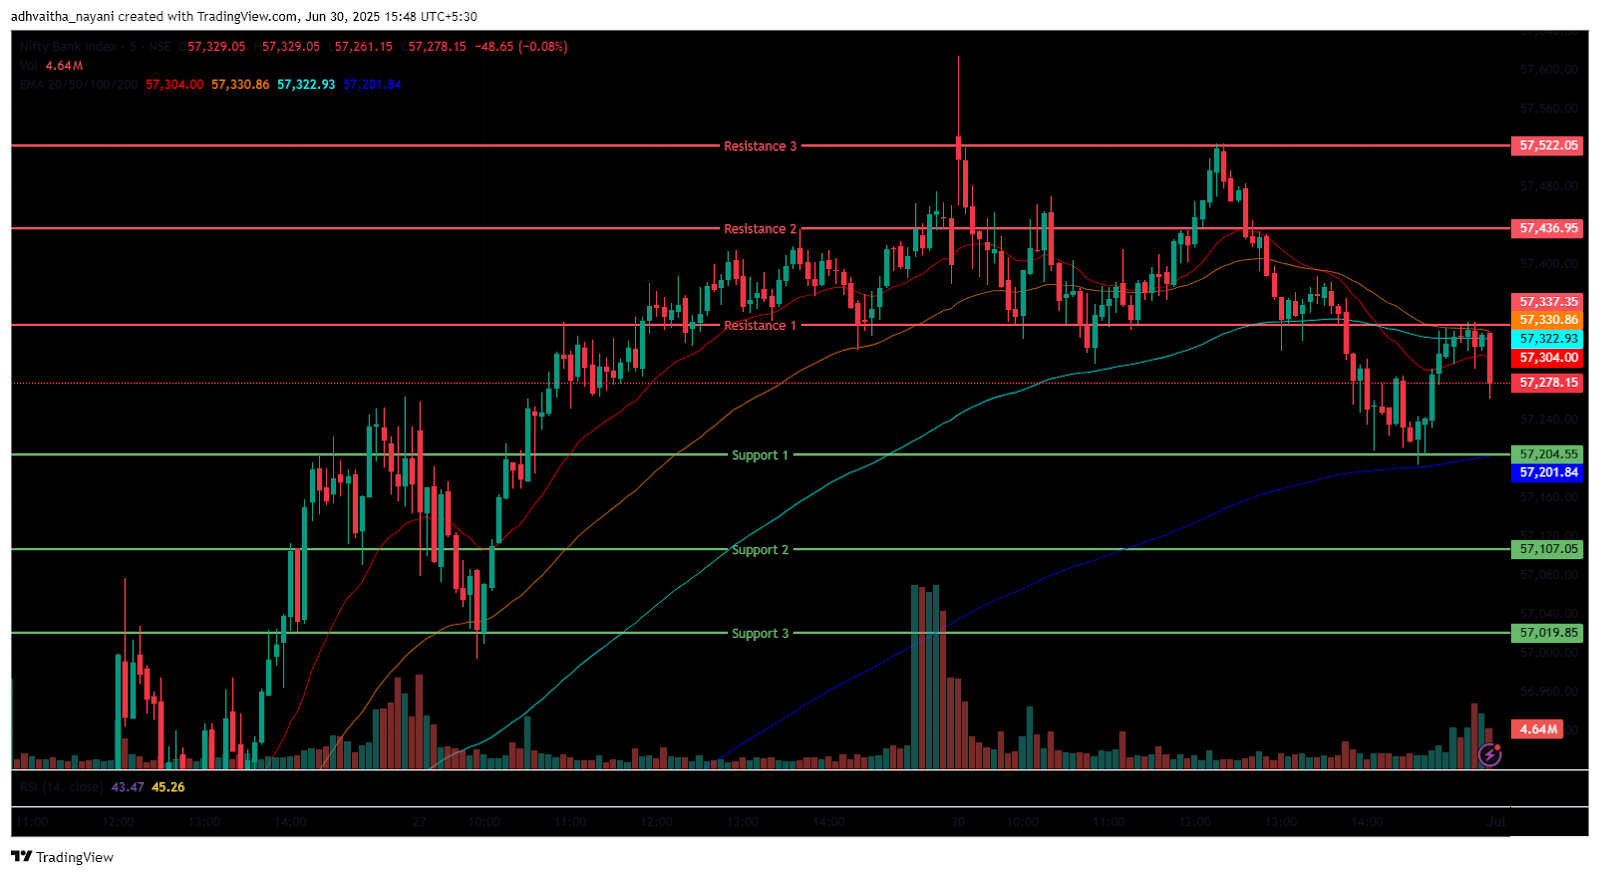
The Bank Nifty Index also followed a similar trend, opening at 57,530. It was trading below the opening level at the 57,370 level in the morning session, in red, but above all four 20/50/100/200 EMAs in the 15-minute time frame. In the afternoon session, the Bank Nifty declined further, reaching its day’s low at 57,194 and closed around 57,313 while staying above 50/100/200-day EMAs but below the 20 EMA in the 15-minute time frame.
Bank Nifty immediate resistance levels are R1 (57,337), R2 (57,437), and R3 (57,522), while immediate support levels are S1 (57,204), S2 (57,107), and S3 (56,020). The Bank Nifty index had peaked at 57,615 and had a day’s low at 57,194. Finally, it had closed at 57,312.75, down by 131 points or 0.23%. The Relative Strength Index (RSI) stood at 65.3 (below the overbought zone of 70) in the daily time frame, and Bank Nifty was above the 20/50/100/200 EMAs in the daily time frame.
BSE Sensex Chart & Price Action Analysis
(In this analysis, we have used 20/50/100/200 EMAs, where 20 EMA (Red), 50 EMA (Orange), 100 EMA (Light Blue), 200 EMA (Dark Blue)).
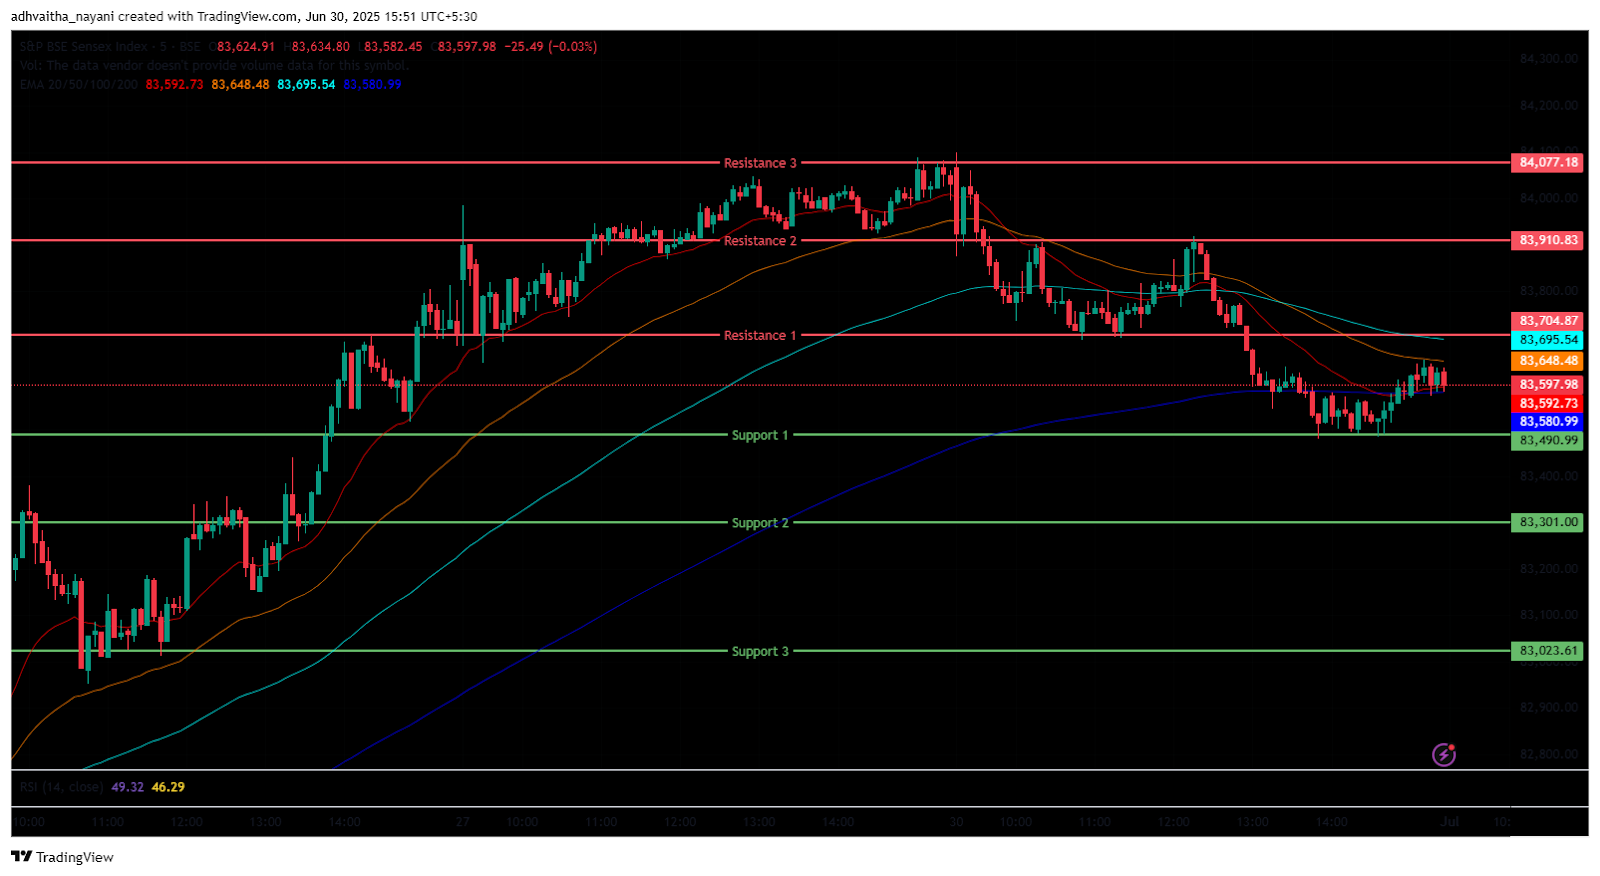
The BSE Sensex Index followed the same trend, opening at 84,027. It was trading below the opening level at 83,750 range in the morning session, in red, and above 50/100/200 EMAs in the 15-minute time frame but below the 20 EMA. In the afternoon session, the BSE Sensex reached its day’s low at 83,482 and closed around 83,606 while staying above 100/200 EMAs but below the 20/50 EMAs in the 15-minute time frame.
BSE Sensex immediate resistance levels are R1 (83,705), R2 (83,911), and R3 (84,077), while immediate support levels are S1 (83,491), S2 (83,301), and S3 (83,024). The BSE Sensex index had peaked at 84,099 and had a day’s low at 83,482. Finally, it had closed at 83,606, down by 452 points or 0.54%. The Relative Strength Index (RSI) stood at 62.5 (below the overbought zone of 70) in the daily time frame, and BSE Sensex was above the 20/50/100/200 EMAs in the daily time frame.
Market Recap June 30th, 2025
The Nifty 50 opened higher at 25,661.65, marking an increase of 23.85 points or 0.09% from the previous close of 25,637.80. However, the index slipped by 120.75 points, or 0.47%, during the session, reaching a morning high of 25,669.35 before closing at 25,517.05. The RSI stood at 63.84, staying below the overbought threshold of 70, and the index closed above all its 20-, 50-, 100-, and 200-day exponential moving averages (EMAs) on the daily chart. The Sensex ended lower as well, closing at 83,606.46, down 452.44 points or 0.54%, with an RSI of 62.51.
The Nifty PSU Bank index was among the best performers, finishing at 7,202.40, up 186.90 points or 2.66%. Top contributors included Bank of Maharashtra, which jumped 5.2%, along with Punjab National Bank and Bank of Baroda, each gaining over 3%. Other gainers such as Union Bank of India, Canara Bank, and Punjab & Sind Bank rose more than 2%.
The Nifty India Defence Index also posted gains, rising 82.05 points or 0.93% to close at 8,870.40. Notable performers within the index included Zen Technologies, Bharat Dynamics, Data Patterns (India), and Mazagon Dock Shipbuilders, all climbing more than 2%.
Conversely, the Nifty Private Bank Index declined by 251.50 points, or 0.88%, closing at 28,254.60. Major stocks like Axis Bank fell 2.1%, while Kotak Mahindra Bank and ICICI Bank dropped over 1% each.
Asian markets presented mixed outcomes on Monday. Hong Kong’s Hang Seng index decreased by 211.87 points, or 0.88%, ending at 24,072.28. South Korea’s Kospi rose by 15.76 points, or 0.52%, closing at 3,071.70. Japan’s Nikkei 225 added 336.60 points, or 0.83%, settling at 40,487.39, marking its strongest monthly showing since February 2024. Shanghai’s Composite Index also advanced, gaining 20.20 points or 0.59% to finish at 3,444.43. By 5:00 p.m., Dow Jones Futures were trading higher by 271.03 points, or 0.62%, at 44,090.30 on the US stock exchange.
India VIX
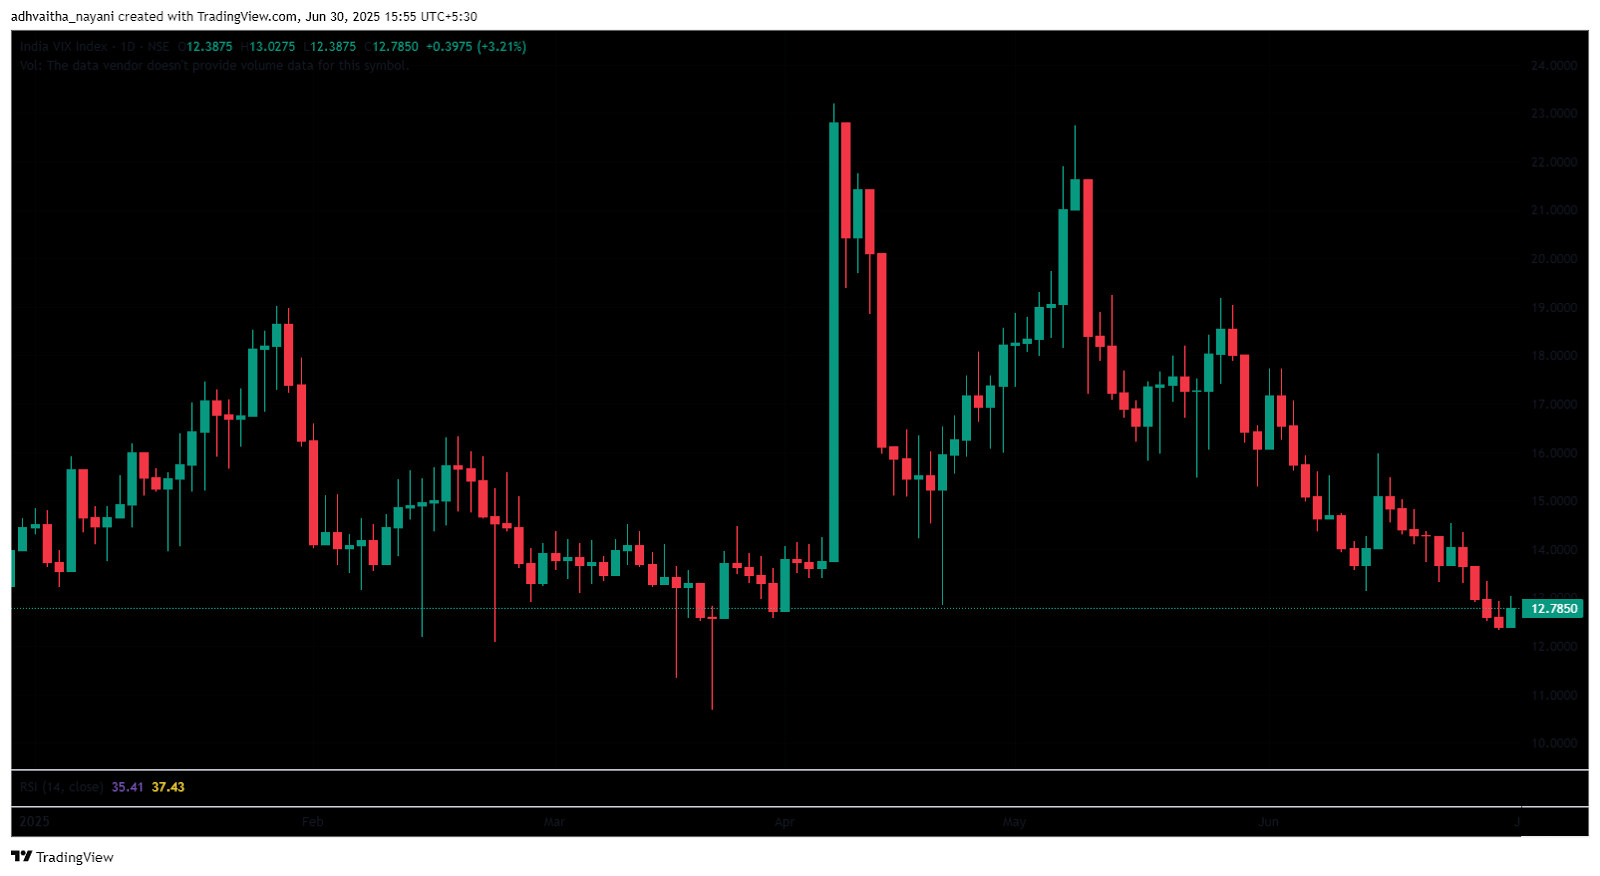
The India VIX increased from 12.39 to 12.79 on Monday, up by 0.40 points or 3.21%. The increase in the index shows a rise in market volatility.
Trade Setup Summary
The Nifty 50 opened on a positive note on Monday but continued to decline throughout the morning session, trading in the 25,550 range, and closed at 25,517, peaking at 25,669. A break below 25,479 could trigger further selling towards 25,435, while a break above 25,538 could trigger bullishness towards 25,599.
Bank Nifty opened on a similar trend, closing on a negative note and breaking below the 57,500 level. A break below 57,205 could trigger further selling towards 57,107, while a break above 57,337 could trigger bullishness towards 57,437.
Sensex opened on a similar trend, closing on a weaker note, and was below the 84,000 level. A break below 83,491 could trigger further selling towards 83,301, while breaking the next resistance level of 83,705 could lead towards the 83,911 level.
Given the ongoing volatility and mixed sentiments, it’s advisable to avoid aggressive positions and wait for clear directional moves above resistance or below support. Traders should consider these key support and resistance levels when entering long or short positions following the price break from these critical levels. Additionally, traders can combine moving averages to identify more accurate entry and exit points.
Disclaimer

The views and investment tips expressed by investment experts/broking houses/rating agencies on tradebrains.in are their own, and not that of the website or its management. Investing in equities poses a risk of financial losses. Investors must therefore exercise due caution while investing or trading in stocks. Trade Brains Technologies Private Limited or the author are not liable for any losses caused as a result of the decision based on this article. Please consult your investment advisor before investing.
About: Trade Brains Portal is a stock analysis platform. Its trade name is Dailyraven Technologies Private Limited, and its SEBI-registered research analyst registration number is INH000015729.
Investments in securities are subject to market risks. Read all the related documents carefully before investing.
Registration granted by SEBI and certification from NISM in no way guarantee performance of the intermediary or provide any assurance of returns to investors.
