
Indian markets remained mostly flat and showed a bearish trend throughout Thursday’s trading session. The benchmark indices continued to hover in a narrow range, as the ongoing geopolitical tensions kept investors on high alert. The US Federal Reserve kept the interest rates unchanged for the fourth consecutive time but cautioned that Donald Trump’s trade policies could pose an inflationary risk.
Thursday being the Nifty 50’s weekly expiry, profit booking could be observed. The 24,800 mark remains a significant level for the index. BSE Sensex also mirrored the sentiment and remained volatile throughout the day, whereas the Bank Nifty continued to decline, with major stocks like Canara Bank, Punjab National Bank, and Bank of Baroda dragging the index down. The small-cap and mid-cap indices also continued to fall for the third consecutive session.
Overall, the Indian equity market experienced a range-bound with a negative bias, driven by concerns over the potential US involvement in the Middle East conflict. In this overview, we will analyze the key technical levels and trend directions for Nifty, Bank Nifty, and BSE Sensex to monitor in the upcoming trading sessions. All the charts mentioned below are based on the 5-minute timeframe.
NIFTY 50 Chart & Price Action Analysis
(In this analysis, we have used 20/50/100/200 EMAs, where 20 EMA (Red), 50 EMA (Orange), 100 EMA (Light Blue), 200 EMA (Dark Blue)).
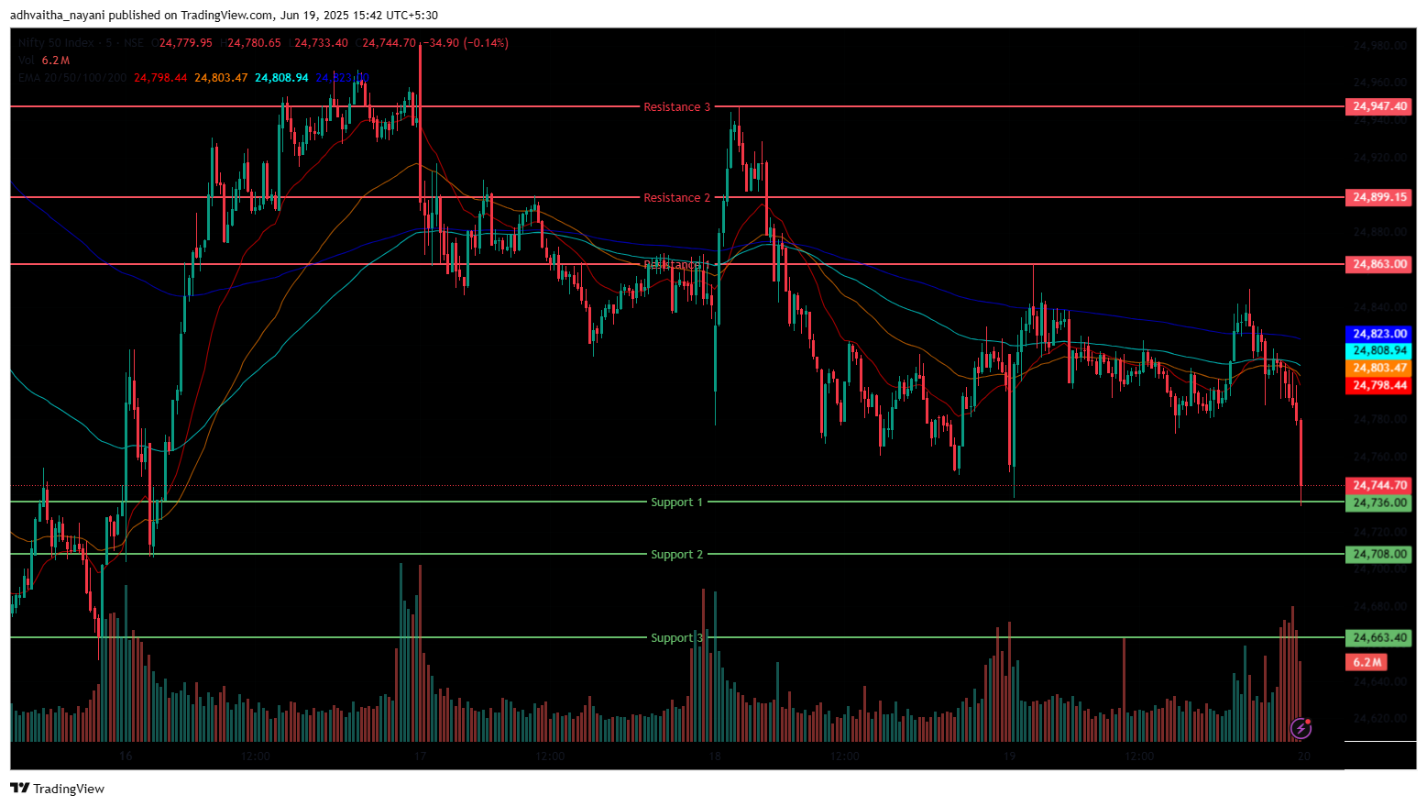
The Nifty 50 Index had opened on a flat note at 24,803.25 on Thursday, down by 8.8 points from Wednesday’s closing of 24,812.05. It was trading slightly below the opening level, around the 24,792.60 range, in the morning session and remained below in all four 20/50/100/200-day EMAs. In the afternoon session, the Nifty Index dragged down in red reached 24,744.70 and stayed below the 20/50/100/200-day EMAs in the 15-minute time frame. Nifty’s immediate resistance levels are R1 (24,863), R2 (24,899), and R3 (24,947), while immediate support levels are S1 (24,736), S2 (24,708), and S3 (24,663).
The Nifty index reached a day’s high at 24,863.10, below the 25,000 mark, and saw a day’s low at 24,733.40. Finally, it had closed at 24,793.25, down in the red, losing -18.8 points or -0.076%. The Relative Strength Index (RSI) stood at 51.65 (well below the overbought zone of 70) in the daily time frame, and Nifty 50 closed above the 50/100/200 EMAs but below the 20-day EMAs in the daily time frame.
Bank Nifty Chart & Price Action Analysis

(In this analysis, we have used 20/50/100/200 EMAs, where 20 EMA (Red), 50 EMA (Orange), 100 EMA (Light Blue), 200 EMA (Dark Blue)).
The Bank Nifty Index also opened higher at 55,784.85, above the previous day’s closing price of 55,475.45. It was trading below the opening level at the 55,578.35 range in the morning session and remained below all four 20/50/100/200-day EMAs. While in the afternoon session, Bank Nifty dragged down and closed in red at 55,497.05 and was below all four 20/50/100/200-day EMAs in the 15-minute time frame. Bank Nifty immediate resistance levels are R1 (55,703), R2 (55,806), and R3 (55,917), while immediate support levels are S1 (55,476), S2 (55,396), and S3 (55,162).
The Bank Nifty index had peaked at 55,942.45 and had a day’s low at 55,475.45. The Bank Nifty ended in red and closed above the day’s low at 55,577.45, down by -251.30 points or 0.45%. The Relative Strength Index (RSI) had stood at 50.66 (well below the overbought zone of 70) in the daily time frame, and Bank Nifty closed above all four 20/50/100/200 EMAs in the daily time frame.
BSE Sensex Chart & Price Action Analysis
(In this analysis, we have used 20/50/100/200 EMAs, where 20 EMA (Red), 50 EMA (Orange), 100 EMA (Light Blue), 200 EMA (Dark Blue)).
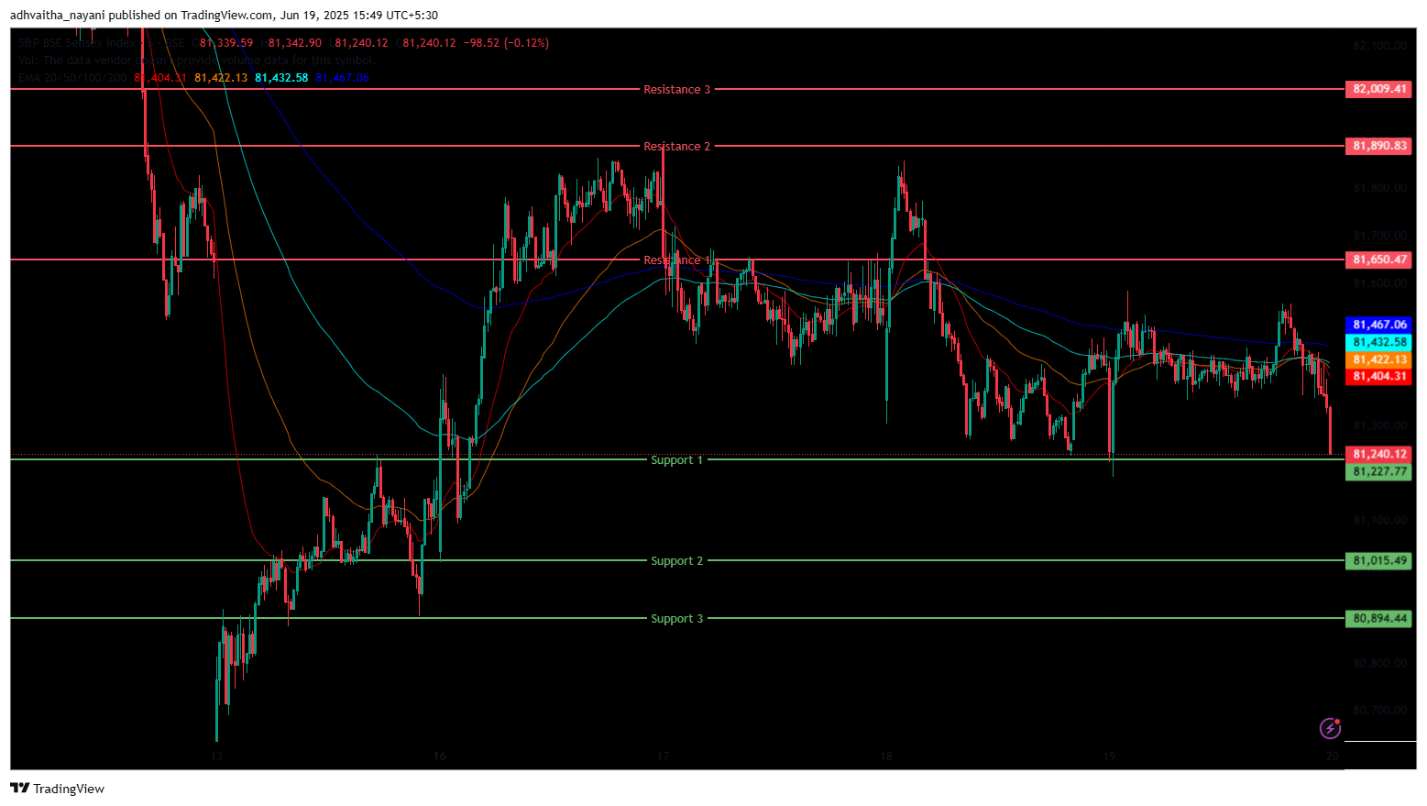
The BSE Sensex Index had opened at 81,403.94, which was below the previous day’s closing price of 81,444.66. It was trading slightly above the opening level at 81,391.67 in the morning session and remained below in all four 20/50/100/200-day EMAs. In the afternoon session, the BSE Sensex rebounded but dragged down and closed in red above the 81,240.12 level from the day’s low, below all four 20/50/100/200 EMAs in the 15-minute time frame.
BSE Sensex immediate resistance levels are R1 (81,650), R2 (81,891), and R3 (82,009), while immediate support levels are S1 (81,228), S2 (81,015), and S3 (80,894).
The BSE Sensex index peaked at 81,583.94 and had a day’s low at 81,191.04. Finally, it had slightly rebounded from the day’s low and closed at 81,361.87, down by -82.79 points or -0.10%. The Relative Strength Index (RSI) stood at 50.50 (well below the overbought zone of 70) in the daily time frame, and BSE Sensex closed above the 50/100/200 EMAs but below the 20-day EMAs in the daily time frame.
Market Recap June 19th, 2025
Indian markets remained largely flat and exhibited a bearish trend throughout Thursday’s trading session. The benchmark indices continued to hover in a narrow range, as persistent geopolitical uncertainties kept investors cautious and on high alert. The Nifty 50 opened at 24,803.25 and touched an intraday low of 24,733.40 before closing at 24,793.25, down by -18.80 points or -0.08%. The index dipped below its 20-day EMA while remaining above the 50, 100, and 200-day EMAs on the daily chart. Its RSI stood at 51.65. Similarly, the BSE Sensex opened at 81,403.94, touched a low of 81,191.04, and ended the day at 81,361.87, down by -82.79 points or -0.10%. It also closed below the 20-day EMA but stayed above the longer-term EMAs, with an RSI of 50.50.
Most sectoral indices ended in the red. The Nifty PSU Bank index was one of the major laggards, closing at 6,734.30, down -140.35 points or -2.04%. This marked its third consecutive day of losses, bringing it below the 20-day EMA and near the 50-day EMA. All constituent stocks in the index declined, with Central Bank of India, Bank of India, Punjab & Sind Bank, UCO Bank, and Indian Overseas Bank all falling over 3%, dragging the index lower.
The Nifty Small Cap 250 index also ranked among the top losers, closing at 16,813.05, down -330.55 points or -1.93%. This too marked its third straight day of decline, with the index breaching the 20-day EMA but still holding above the 50, 100, and 200-day EMAs. Major drags included Cyient Ltd., Reliance Power Ltd., and Amber Enterprises, each falling over 4%.
Asian markets mirrored the bearish sentiment amid ongoing tensions between Iran and Israel on Thursday. The US Federal Reserve maintained interest rates for the fourth consecutive time but cautioned that Donald Trump’s trade policies could pose an inflationary risk.
Hong Kong’s Hang Seng index fell -1.99% or -472.95 points, to close at 23,237.74. Japan’s Nikkei 225 declined -396.81 points or -1.02%, closing at 38,488.34. The Shenzhen index, however, gained 24.16 points or 0.24% to reach 10,175.59. China’s Shanghai index slipped -26.70 points or -0.79% to settle at 3,362.11. South Korea’s Kospi index edged up 5.55 points or 0.19%, closing at 2,977.74. In the US, Dow Jones Futures also reflected the global risk-off mood, dropping -173.60 points or -0.42% to 41,996 on Thursday.
India VIX

The India VIX decreased from 14.28 to 14.25. The index continued to ease from the recent high of 15.98, which was marked on Friday, thus indicating lessened market volatility.
Trade Setup Summary
The Nifty opened Thursday at 24,803.25, which was slightly lower than the closing price of 24,812.05. The Index stayed within the 24,786-24,830 range from the beginning to the end of the session. S1 (24,736), S2 (24,708), and S3 (24,663) are the immediate support levels; the main resistance and support levels to watch for in tomorrow’s session are R1 (24,863), R2 (24,899), and R3 (24,947).
Thursday’s Bank Nifty session was volatile; the index dropped -251 points, or -0.45%, to close at 55,577.45, below the closing price of 55,828.75 the day before. S1 (55,476), S2 (55,396), and S3 (55,162) are the immediate support levels; the main resistance and support levels to watch for in tomorrow’s session are R1 (55,703), R2 (55,806), and R3 (55,917).
At 81,361.87, the Sensex index likewise closed in red. The index was steady between 81,380 and 81,557. S1 (81,228), S2 (81,015), and S3 (80,894) are the immediate support levels; the main resistance and support levels to watch for in tomorrow’s session are R1 (81,650), R2 (81,891), and R3 (82,009).
Traders should consider these key support and resistance levels to enter long or short positions following the price break from the key levels. Also, traders can combine moving averages for more accurate entry and exit points.
Disclaimer

The views and investment tips expressed by investment experts/broking houses/rating agencies on tradebrains.in are their own, and not that of the website or its management. Investing in equities poses a risk of financial losses. Investors must therefore exercise due caution while investing or trading in stocks. Trade Brains Technologies Private Limited or the author are not liable for any losses caused as a result of the decision based on this article. Please consult your investment advisor before investing.
