The Indian equity markets closed the week on a strong and optimistic note, with major indices like the Nifty 50 and Sensex not only reversing their muted openings. Investor sentiment was buoyed by strong technical indicators, including sustained movement above key moving averages and an upward momentum that was reflected in rising RSI levels nearing the overbought zone. Positive quarterly earnings, particularly in banking and FMCG sectors, along with steady foreign and domestic institutional inflows, added to the bullish undertone. Additionally, optimism around India-US trade talks and expectations of a US Federal Reserve rate cut provided a favourable global backdrop that supported the uptrend.
Sector-wise, the market displayed a mixed reaction. Defensive sectors like FMCG, healthcare, and consumer durables outperformed, reflecting a risk-on sentiment among investors. These gains were offset to some extent by weakness in IT and media stocks, which came under pressure following earnings and negative cues. While most indices closed in the green, the drag from tech stocks hinted at selective profit booking. Global markets, particularly in Asia, remained under pressure due to bearish trends, but Indian equities appeared relatively resilient, driven by domestic fundamentals and continued investor confidence.
In this overview, we will analyse the key technical levels and trend directions for Nifty and BSE Sensex to monitor in the upcoming trading sessions. All the charts mentioned below are based on the 5-minute timeframe.
Nifty 50
(In this analysis, we have used 20/50/100/200 EMAs, where 20 EMA (Red), 50 EMA (Orange), 100 EMA (Light Blue), and 200 EMA (Dark Blue)).
To view other technical reports, click here
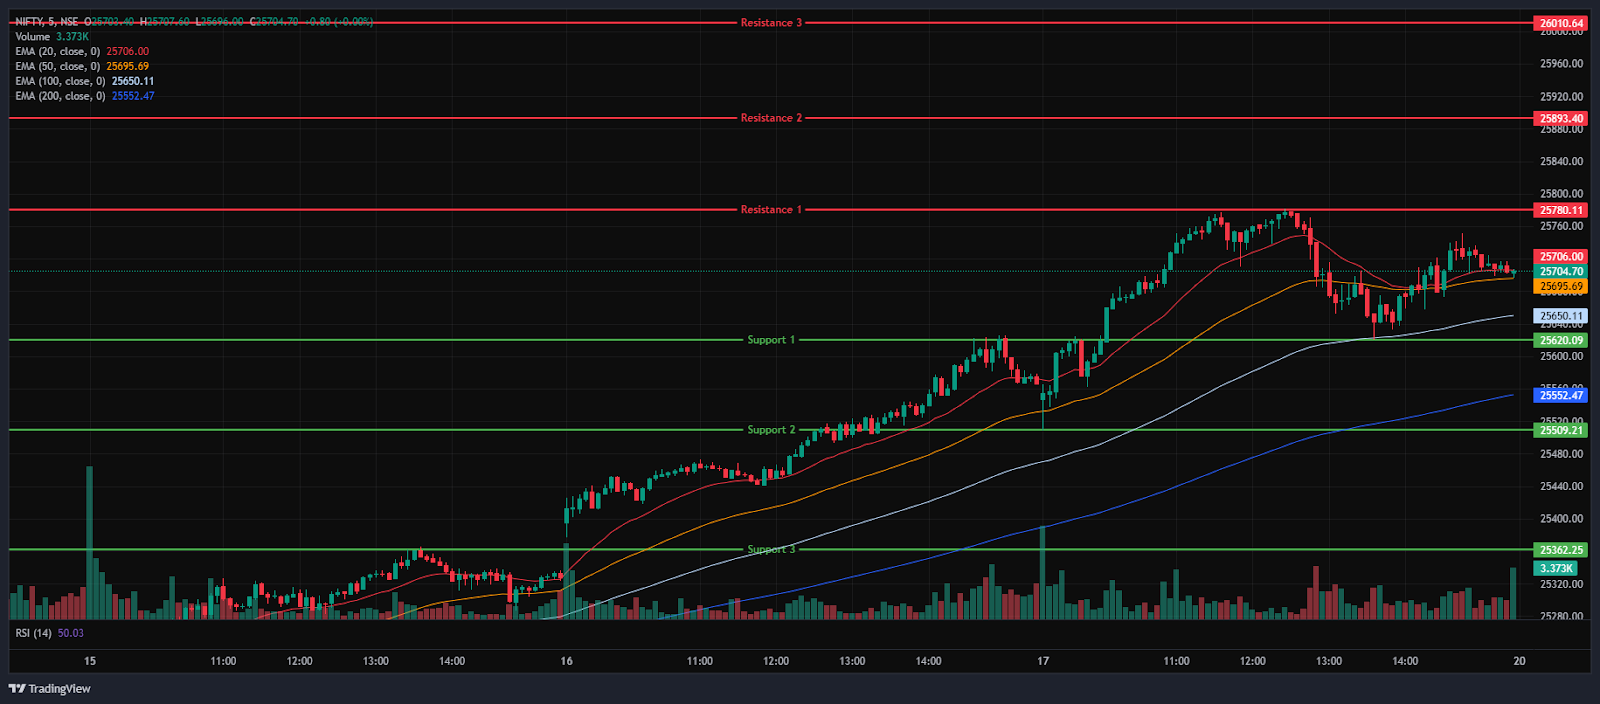
The Nifty 50 Index opened on a negative note at 25,546.85 on Friday, down by 38.45 points from Thursday’s closing of 25,585.30. With a bearish start to the day. However, the index had an overall bullish morning session and surged as high as 25,781, marking its day’s high in the morning session, trading in the 25,500 to 25,800 range. Additionally, the Index stood above all four EMAs of 20/50/100/200 in the 15-minute time frame during the morning session.
Further, the index declined and settled above the 25,700 level and was trading in the range of 25,600 and 25,800. During the afternoon session, the Nifty 50 closed above all four EMAs of 20/50/100/200 in the 15-minute time frame. The Nifty’s immediate resistance levels are R1 (25,780), R2 (25,893), and R3 (26,011), while immediate support levels are S1 (25,620), S2 (25,509), and S3 (25,362).
The Nifty index had reached a day’s high at 25,781.50 and saw a day’s low at 25,508.60. Finally, it had closed at 25,709.85, in green above the 25,700 level, gaining 124.55 points, or 0.49%. The Nifty 50 closed above all four EMAs of 20/50/100/200 in the daily time frame.
Momentum Indicators
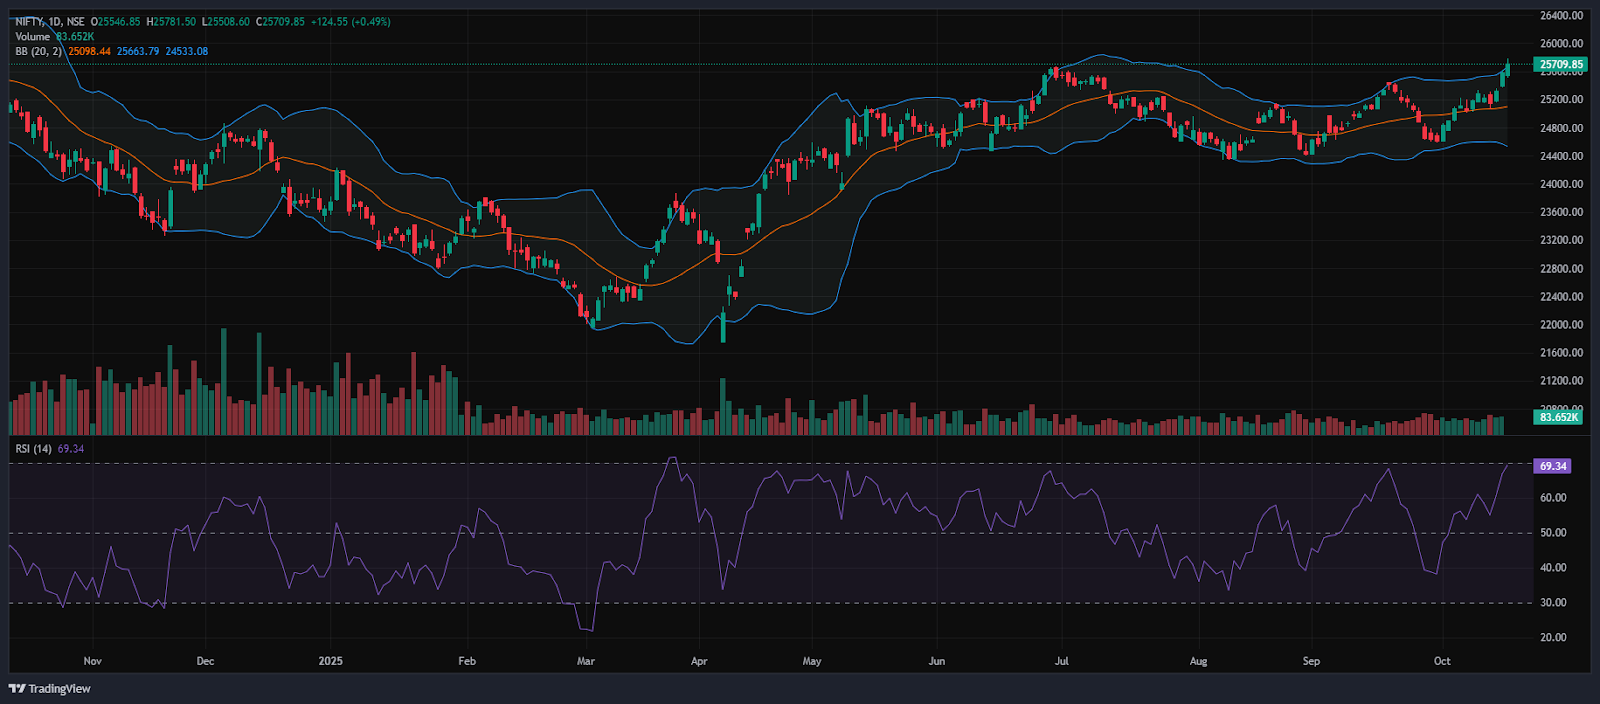
RSI (Daily): The Nifty 50’s RSI stood at 69.34, which is nearing the overbought zone of 70, indicating a bullish sentiment and potential reversal.
Bollinger Bands (Daily): The index is trading in the upper band of the Bollinger Band range above the middle band (Simple Moving Average). Its position in the upper range indicates a bullish sentiment, and the Index took support near the 25,508 and 25,781 acted as a resistance level. A sustained move above the middle band signals a bullish sentiment, while a drop back toward the lower band may reinforce bearish sentiment.
Volume Analysis: Friday’s trading session had above-average volumes, which stood at 422.06 Mn.
Derivatives Data: Options OI indicates strong Put writing at 25,700, followed by 25,600, establishing it as a firm support zone. On the upside, a significant Call OI buildup at 25,800 and 25,900 suggests a potential resistance supply. PCR (Put/Call Ratio) stands at 1.2 (>1), leaning towards bearish sentiment, and the long unwinding signals a Strong bearish signal, with an overall bearish outlook for the next trading session.
Bank Nifty
(In this analysis, we have used 20/50/100/200 EMAs, where 20 EMA (Red), 50 EMA (Orange), 100 EMA (Light Blue), and 200 EMA (Dark Blue)).
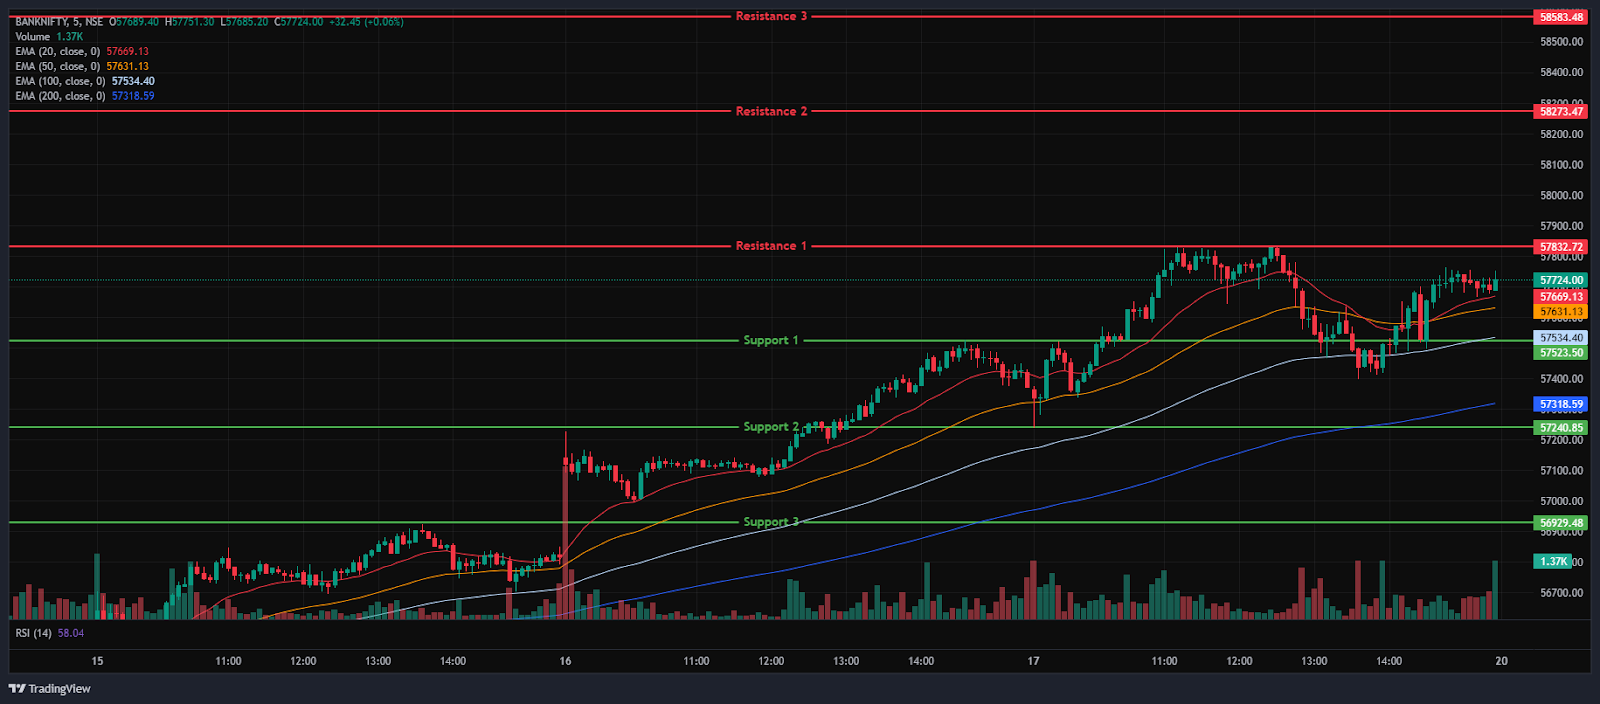
The Bank Nifty Index started the session on a negative at 57,362.90 on Friday, down 59.65 points from Thursday’s closing of 57,422.55. The index was trading between the range of 57,200 and 57,850 in the morning session and surged as high as 57,830, trading at its all-time high in the morning session. In addition, the index was trading above all four EMAs of 20/50/100/200 in the 15-minute time frame. In the afternoon session, the Index declined and settled above the 57,700 mark.
Further, the Index was trading in the range of 57,350 and 57,800, and ended in green above its opening level. During the afternoon session, Bank Nifty closed above all four EMAs of 20/50/100/200 in the 15-minute time frame. The Bank Nifty’s immediate resistance levels are R1 (57,833), R2 (58,273), and R3 (58,583), while immediate support levels are S1 (57,523), S2 (57,241), and S3 (56,929).
The Bank Nifty index had peaked at 57,830.20 and made a day’s low at 57,238.65. Finally, it had closed in green at 57,713.35, closing above the 57,700 level, gaining 290.80 points or 0.51%. The Relative Strength Index (RSI) stood at 74.66, entered the overbought zone of 70 in the daily time frame, and Bank Nifty closed above all four EMAs of 20/50/100/200 in the daily time frame.
Sensex
(In this analysis, we have used 20/50/100/200 EMAs, where 20 EMA (Red), 50 EMA (Orange), 100 EMA (Light Blue), and 200 EMA (Dark Blue)).
To view other technical reports, click here
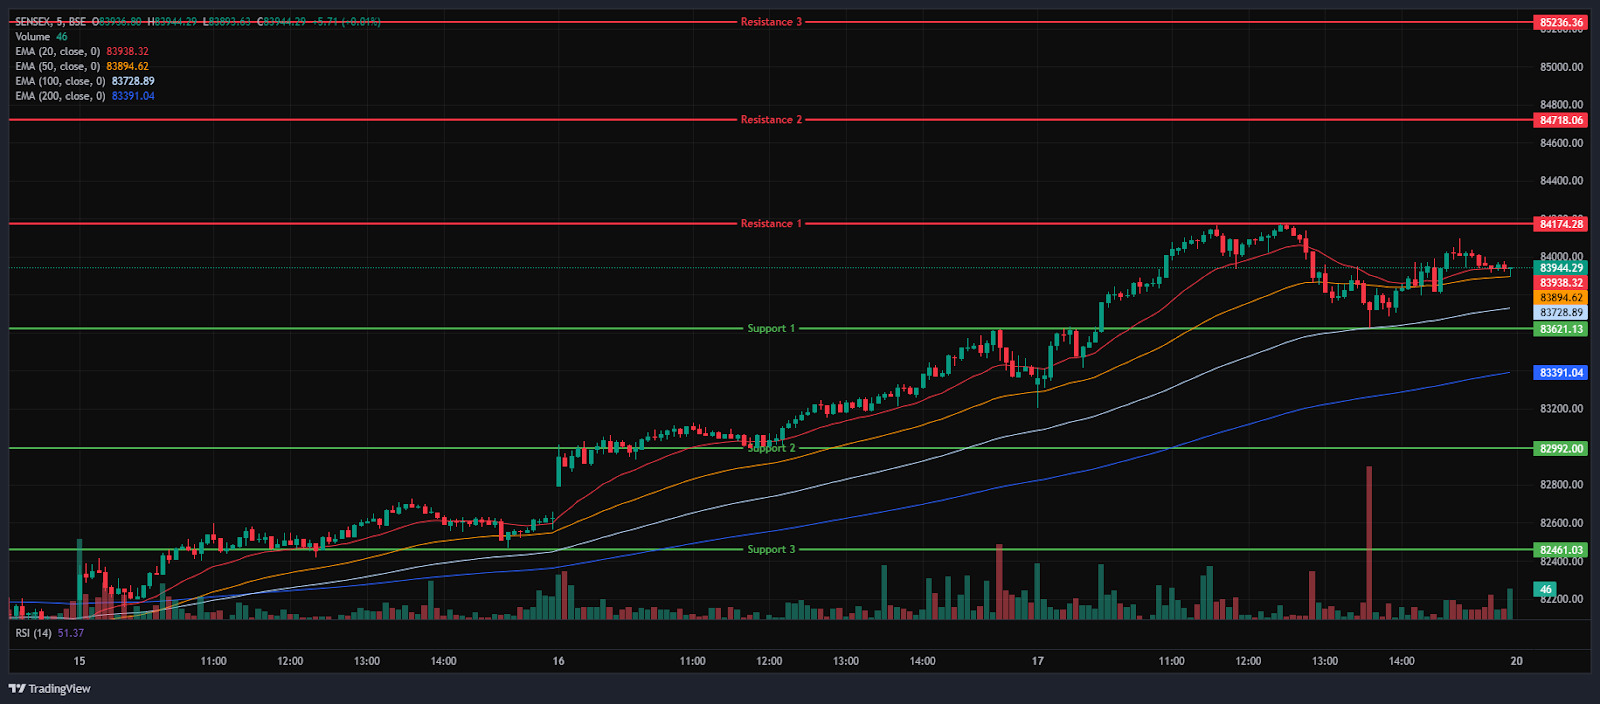
The BSE Sensex Index also opened on a negative note at 83,331.78 on Friday, down by 135.88 points from Thursday’s closing of 83,467.66. The index started its session on a bearish note and was trading in the 83,200 and 84,200 range throughout the morning session and was above all four EMAs of 20/50/100/200 in the 15-minute time frame.
In the afternoon session, the Index declined and settled above the 83,900 level. The Index was trading around 83,600 and 84,150, maintaining its overall bullish trend and closing above the EMAs of 20/50/100/200 in the 15-minute time frame. The BSE Sensex immediate resistance levels are R1 (83,621), R2 (82,992), and R3 (82,461), while immediate support levels are S1 (84,174), S2 (84,718), and S3 (85,236).
The BSE Sensex index had peaked at 84,172.24 and made a day’s low at 83,206.08. Finally, it had closed at 83,952.19 in green, gaining 484.53 points or 0.58%. The Relative Strength Index (RSI) stood at 69.54, entering towards the overbought zone of 70 in the daily time frame, and the BSE Sensex closed above all four EMAs of 20/50/100/200 in the daily time frame.
India VIX
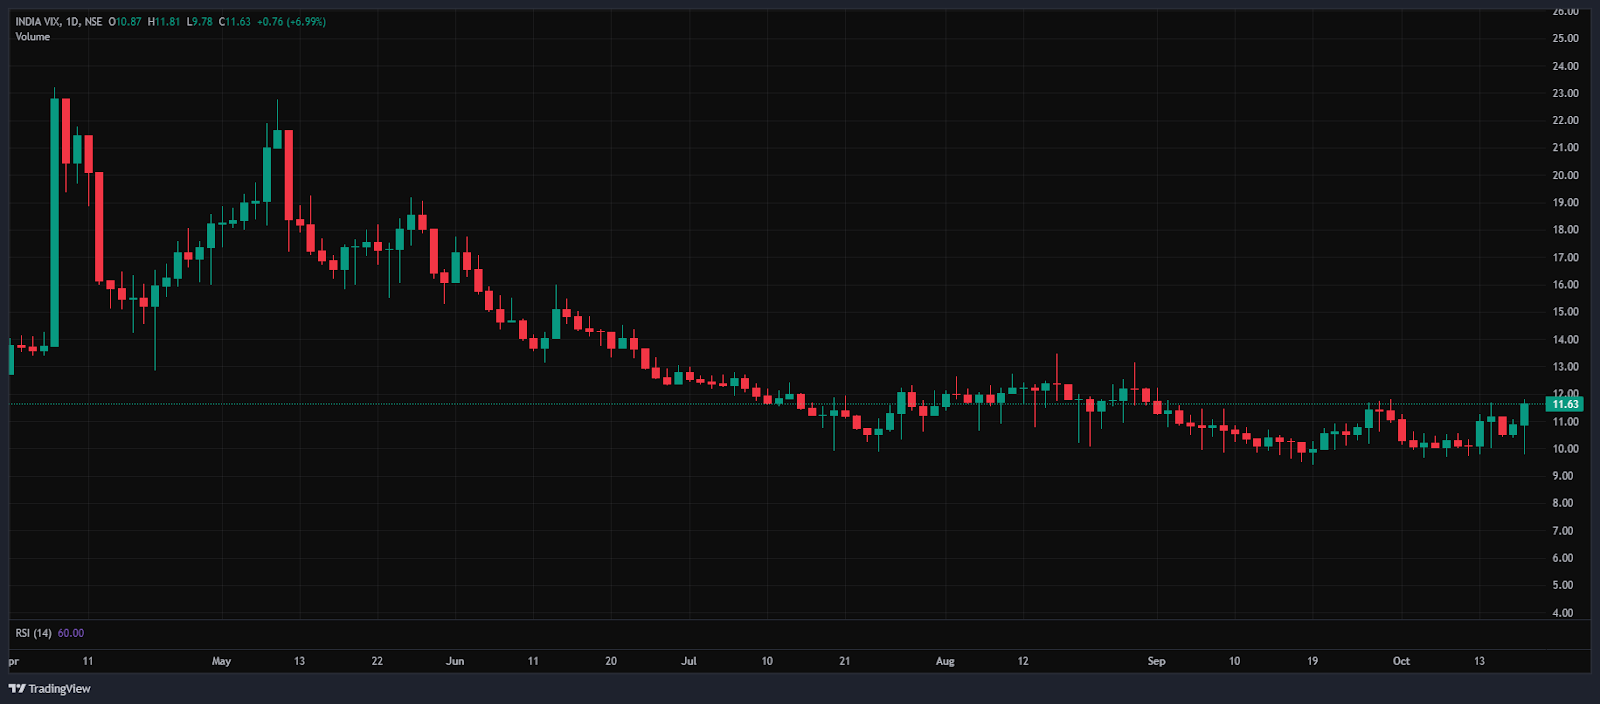
The India VIX increased by 0.80 points or 7.36%, from 10.86 to 11.66 during Friday’s session. An increase in the India VIX typically indicates higher price volatility in the stock market, suggesting a less stable market environment. However, a stable market environment and minimal volatility are anticipated when the India VIX is below 15.
Market Recap – 17th October 2025
On Friday, the Nifty 50 began the session on a subdued note at 25,546.85, down by 38.45 points from its previous close of 25,585.3. However, the index quickly picked up momentum, climbing steadily to reach a new 52-week high of 25,781.5, surpassing the 25,750 mark, before settling at 25,709.85 a gain of 124.55 points or 0.49%. Technically, the index remained firmly above all its major moving averages (20/50/100/200-day EMAs) on the daily chart, underscoring solid support levels.
The BSE Sensex displayed a similar trajectory, opening lower at 83,331.78, a decline of 135.8 points from the previous close of 83,467.6. It too rebounded strongly, touching a 52-week high of 84,172.24 and closing the session at 83,952.19, gaining 484.53 points or 0.58%. Both benchmarks showed robust momentum, with the RSI for the Nifty 50 at 69.34 and for the Sensex at 69.54, approaching the overbought level of 70.
The Bank Nifty Index also closed in the green, adding 290.8 points or 0.51%, to settle at 57,713.35, after touching a fresh 52-week high of 57,830.2. The upward move was driven by favourable Q2 earnings, continued foreign inflows (FIIs net bought shares worth Rs 997.29 crore and DIIs purchased shares amounting to Rs 4,076.2 crore on Thursday), improved investor confidence from anticipated India-US trade discussions, and supportive global cues amid expectations of a US Federal Reserve rate cut.
Most sectoral indices ended the session in positive territory on Friday. The Nifty FMCG Index emerged as the top performer, marking its third consecutive day of gains, rising by 1.37% or 762.5 points to 56,616.4. Notable gainers included Radico Khaitan Ltd, Emami Ltd, ITC Ltd, and Hindustan Unilever Ltd, with individual gains of up to 3.7%. The Nifty Healthcare Index also recorded a strong performance, increasing by 0.76% or 111.7 points, to close at 14,866.9.
Key stocks were Laurus Labs Ltd, Max Healthcare Institute Ltd, Torrent Pharmaceutical Ltd, and Dr Reddy’s Laboratories Ltd, which saw gains of up to 3.12%. The Nifty Consumer Durable Index extended its upward trend for the third straight session, ending at 39,018.55, up by 0.69% or 266.45 points. Whirlpool of India Ltd jumped 11.84% following the execution of several agreements, while PG Electroplast Ltd and Havells India Ltd also posted notable gains of up to 3.4%.
On the downside, the Nifty IT Index was the biggest laggard, falling by 1.63% or 580.35 points, to close at 34,950.70. Wipro Ltd led the decline with a drop of 5.09% after delivering weak Q2 earnings; Mphasis Ltd, Infosys Ltd, and HCL Tech also declined by up to 3.23%. The Nifty Media Index ended lower at 1,519.60, down 24.10 points or 1.56%. Key underperformers included Tips Music Ltd, Zee Entertainment, Network 18 Media & Investments Ltd, and Saregama India Ltd, which dropped up to 3.91%. The Nifty Metal Index also concluded in the red, closing at 10,199.30 after losing 87.95 points or 0.85%.
Asian markets reflected a generally bearish tone on Friday. Japan’s Nikkei 225 declined by 1.52%, shedding 722.74 points to close at 47,555. Hong Kong’s Hang Seng Index dropped by 2.6% or 656.51 points, to close at 25,232, while China’s Shanghai Composite Index slipped 1.99% or 76.47 points, to 3,839.76. South Korea’s KOSPI Index managed a slight gain of 0.01% or 0.52 points, ending at 3,748.89. As of 5:11 p.m. IST, U.S. Dow Jones Futures were trading lower by 0.13%, down 60 points at 45,895.24.
The broader Indian indices closed the week with notable gains, marking their third consecutive week of advances and reaching fresh 52-week highs. The Nifty 50 posted a weekly gain of 424.50 points or 1.68%, underscoring sustained positive market sentiment.
Trade Setup Summary
The Nifty 50 opened on a negative note at 25,546.85 on Friday but ended the session in the green above the 25,700 level at 25,709.85. A break below 25,620 could trigger further selling towards 25,509, while breaking the nearest resistance level at 25,780 could lead towards the 25,893 level.
Bank Nifty also started the session on a negative note at 57,362.90 but ended the session in the green at 57,713.35 by reaching its all-time high at the 57,830 level. A break below 57,523 could trigger further selling towards 56,241, while breaking the nearest resistance level at 57,833 could lead towards 58,273.
Sensex also opened on a negative note at 83,331.78 but ended the session in the green at 83,952.19, above the 83,900 level. A break below 83,621 could trigger further selling towards 82,992, while breaking the next resistance level of 84,174 could lead towards the 84,718 level.
Given the ongoing volatility and mixed sentiments, it’s advisable to avoid aggressive positions and wait for clear directional moves above resistance or below support. Traders should consider these key support and resistance levels when entering long or short positions following the price break from these critical levels. Additionally, traders can combine moving averages to identify more accurate entry and exit points.
Disclaimer

The views and investment tips expressed by investment experts/broking houses/rating agencies on tradebrains.in are their own, and not that of the website or its management. Investing in equities poses a risk of financial losses. Investors must therefore exercise due caution while investing or trading in stocks. Trade Brains Technologies Private Limited or the author are not liable for any losses caused as a result of the decision based on this article. Please consult your investment advisor before investing.
About: Trade Brains Portal is a stock analysis platform. Its trade name is Dailyraven Technologies Private Limited, and its SEBI-registered research analyst registration number is INH000015729.
Investments in securities are subject to market risks. Read all the related documents carefully before investing.
Registration granted by SEBI and certification from NISM in no way guarantee performance of the intermediary or provide any assurance of returns to investors.
