The market mood in today’s session was broadly upbeat, with both major benchmark indices opening on a positive note, gaining strength through the day, and closing firmly higher. Strong momentum was visible across charts, with each index holding above key moving averages and approaching overbought territory. Buying by foreign institutional investors and supportive global cues, especially the rebound in global technology shares after a strong earnings report from a major chipmaker, further lifted overall sentiment.
Financials, defence, and infrastructure were among the standout gainers, with several prominent stocks in these sectors advancing steadily. On the flip side, select pockets of the market saw pressure. Media stocks led the decline, followed by weakness in public-sector banks and consumer durables, where several names registered noticeable pullbacks. In the broader Asian region, market sentiment leaned positive, with most major indices ending higher despite some softness in China’s Shanghai Composite Index. Overall, the session reflected strong bullish undertones domestically, supported by global optimism and sector-specific strength.
In this overview, we will analyse the key technical levels and trend directions for Nifty and BSE Sensex to monitor in the upcoming trading sessions. All the charts mentioned below are based on the 15-minute timeframe.
NIFTY 50 Chart & Price Action Analysis
To view other technical reports, click here
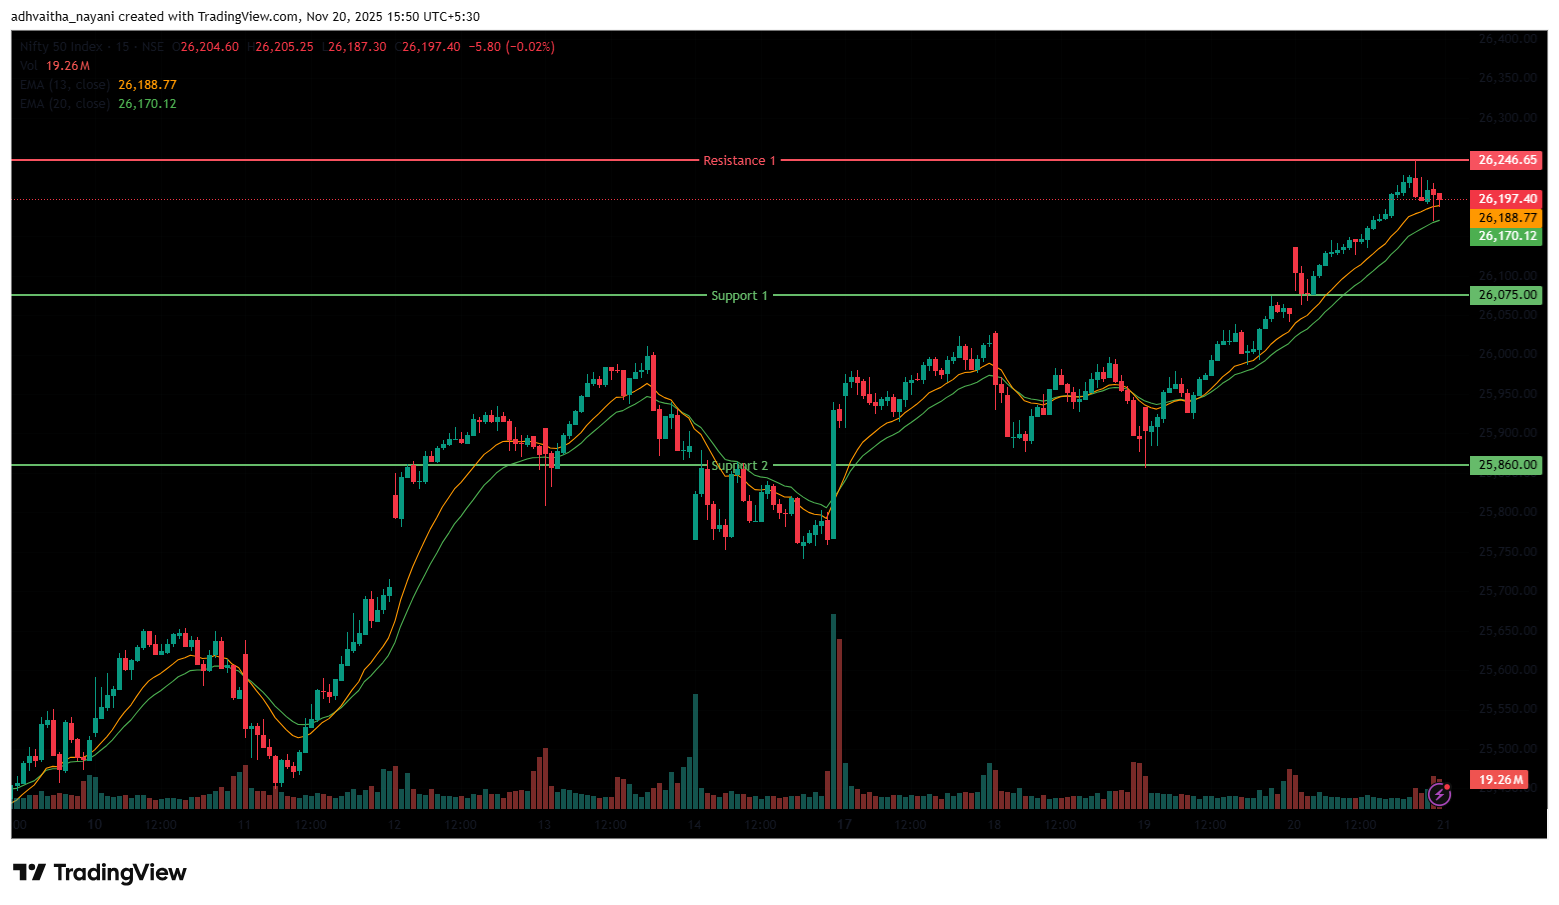
The Nifty 50 Index opened on a positive note at 26,132.10 on Thursday, up by 79.45 points from Wednesday’s closing of 26,052.65. The index opened on a gap-up note and continued its upward momentum in the morning session, trading above the 26,100 level. The Index was trading within the range of 26,100 and 26,150. In the afternoon session, the index continued its surge and reached its peak at 26,246.65 and settled near the 26,200 level, ending the session on a Bullish note.
The Nifty index had reached a day’s high at 26,246.65 and saw a day’s low at 26,063.20. Finally, it had closed at 26,192.15, in the green, above the 26,150 level, up 139.5 points, or 0.54%. In the short term, the Index was above the 13/20 day EMA in the daily time frame, indicating an uptrend.
The Index’s nearest resistance level is at 26,246.65 (R1), which is the 52-week high for the index. On the other hand, the closest support is now at 26,075 (S1), which was a previous resistance level but has turned into support. If the index falls below this, the next strong support level to watch is at 25,860 (S2).
Trade Setup:
| Nifty 50 | |
| Resistance 1 | 26,246.65 |
| Closing Price | 26,192.15 |
| Support 1 | 26,075.00 |
| Support 2 | 25,860.00 |
NIFTY 50 Momentum Indicators Analysis
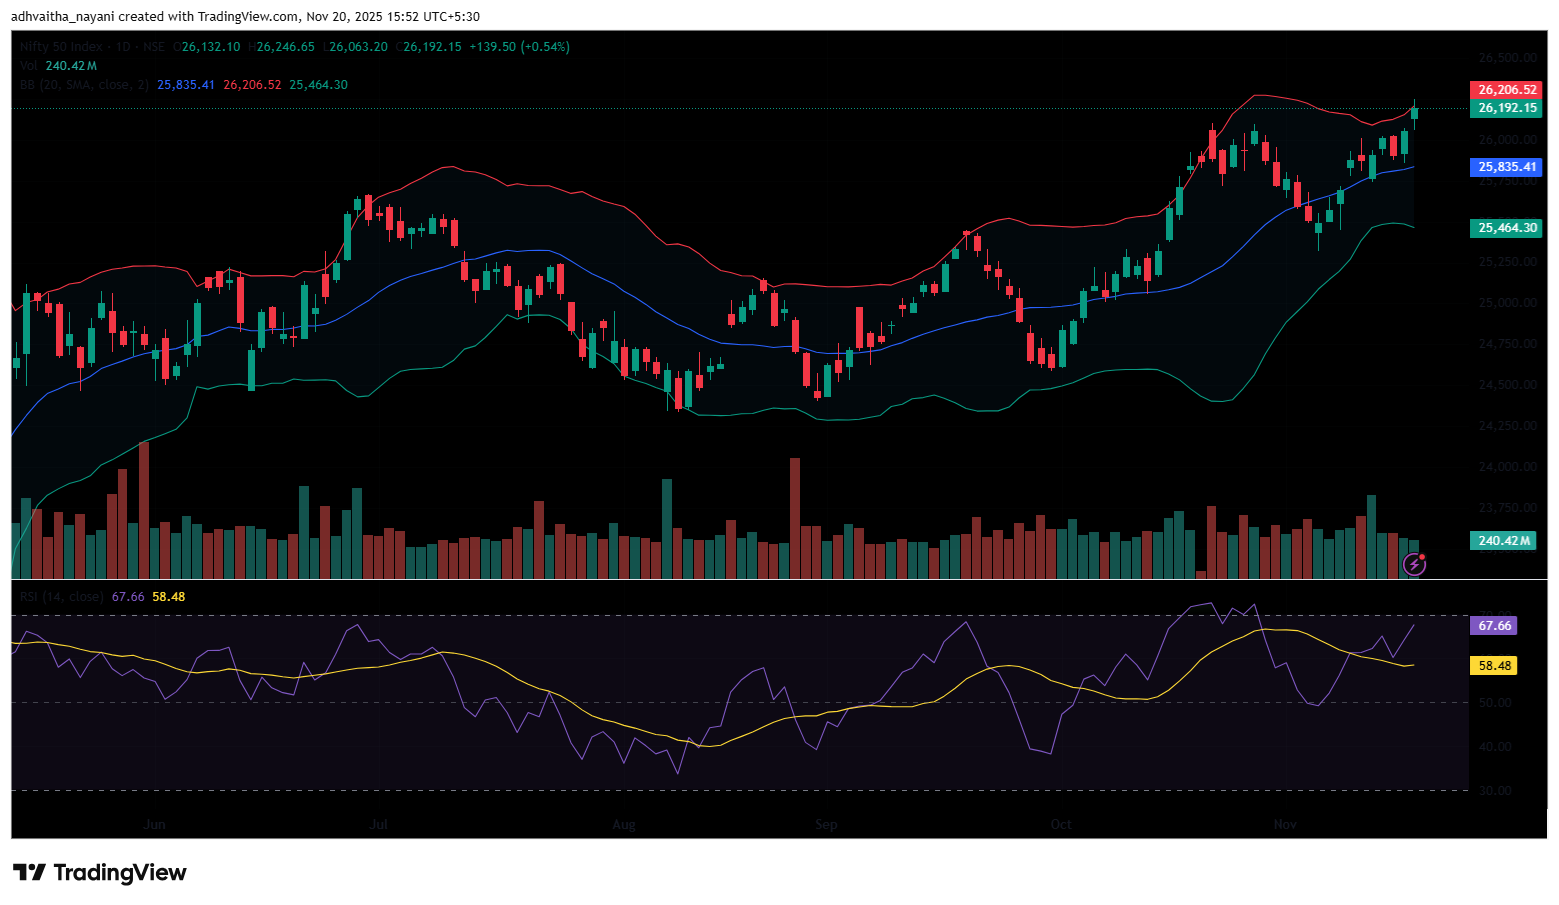
RSI (Daily): The Nifty 50’s RSI stood at 67.66, which is below the overbought zone of 70, indicating bullish sentiment and room to grow higher.
Bollinger Bands (Daily): The index is trading in the upper band of the Bollinger Band range (Simple Moving Average). Its position in the upper range suggests a bullish sentiment and in Thursday’s session, the Index formed a small body candle with equal wicks on both ends and ended on a bullish note. The index took support near 26,063.2, and 26,246.6 acted as a resistance level. A sustained move above the middle band signals a bullish sentiment, while a drop back toward the lower band may reinforce bearish sentiment.
Volume Analysis: Thursday’s trading session had an average volume of 240.43 Mn.
Derivatives Data: Options OI indicates strong Put writing at 26,150, followed by 26,100, establishing a strong support zone. On the upside, a significant Call OI buildup at 26,200 and 26,300 suggests a potential supply of resistance. PCR (Put/Call Ratio) stands at 1.51 (>1), leaning towards bearish sentiment, and the long Buildup indicates that traders are entering the long positions, which signals a bullish outlook, thus overall indicating a mixed outlook for the next trading session.
Bank Nifty Chart & Price Action Analysis
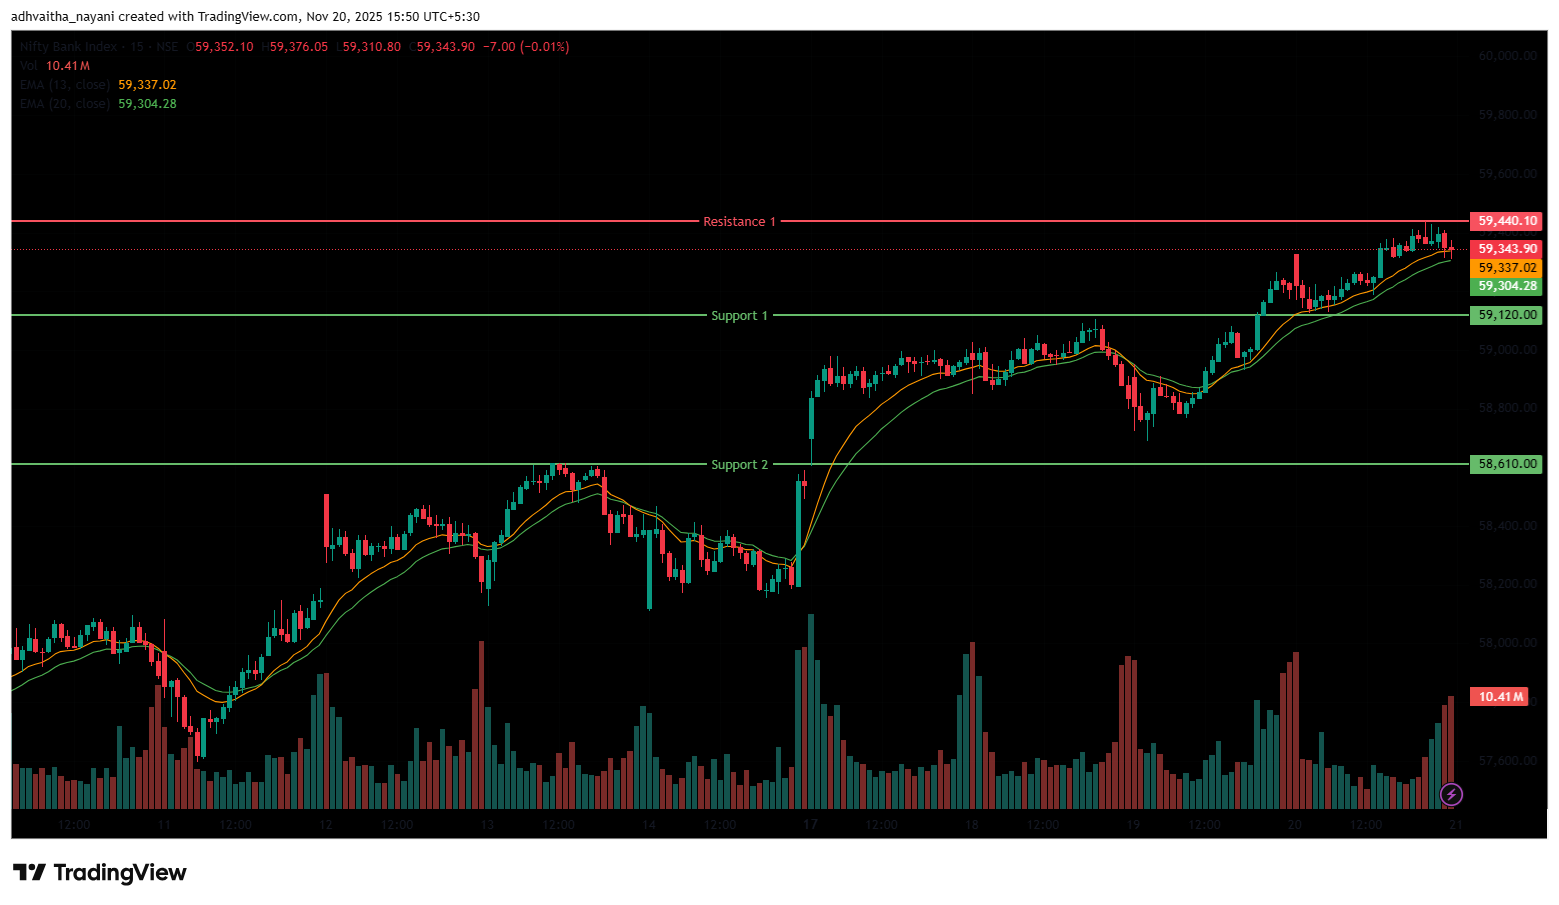
The Bank Nifty Index also opened on a positive note at 59,308.20, above the 59,300 level, on Thursday, which was up by 92.15 points from Wednesday’s closing of 59,216.05. The index was trading within the range of 59,150 and 59,300 in the morning session, following a stronger opening. In the afternoon session, the index continued its rally and reached the day’s peak at the 59,440.10 level, crossing the 59,400 level for the first time and creating an all-time high on Thursday. It traded in the range of 59,300 and 59,400, ending the day near the 59,350 mark.
The Bank Nifty index had peaked at 59,440.10 and made a day’s low at 59,125.25. Finally, it had closed in green at 59,347.70, ending near the 59,350 level, gaining 131.65 points or 0.22%. The Relative Strength Index (RSI) stood at 74, above the overbought zone of 70 in the daily time frame. In the short term, the Index was above the 13/20 day EMA in the daily time frame, indicating an uptrend.
The higher resistance level is at 59,440.10 (R1), which is the all-time high for the index. On the other hand, the closest support is now at 59,120 (S1), which was the previous resistance level but has turned into support. If the index falls below this, the next major support level to watch is at 58,610 (S2).
Trade Setup:
| Bank Nifty | |
| Resistance 1 | 59,440.10 |
| Closing Price | 59,347.70 |
| Support 1 | 59,120.00 |
| Support 2 | 58,610.00 |
BSE Sensex Chart & Price Action Analysis
To view other technical reports, click here
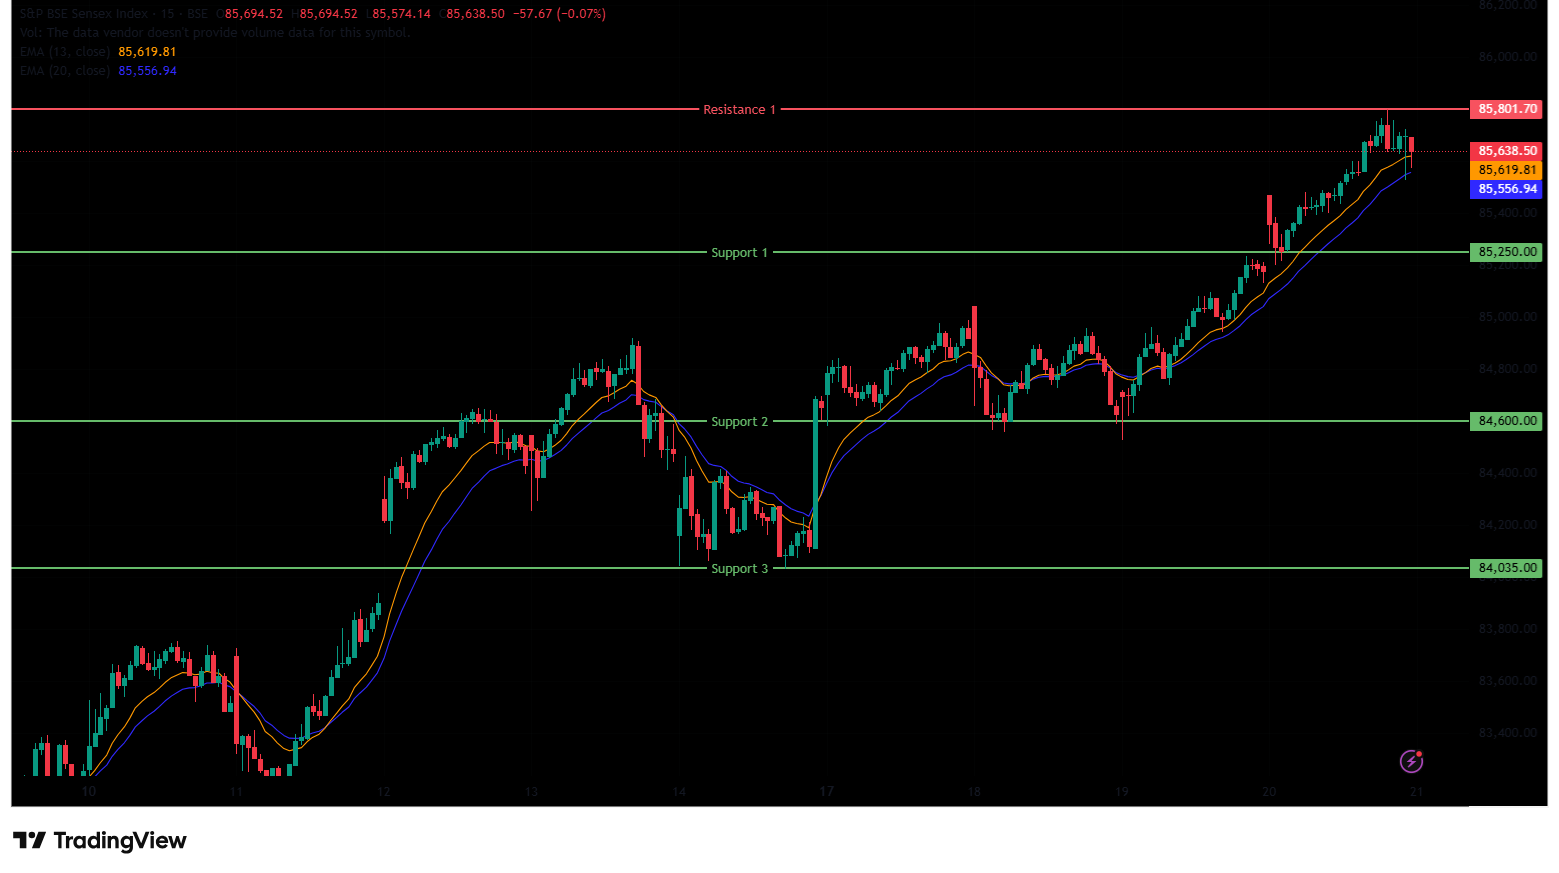
The BSE Sensex Index opened on a positive note at 85,470.92 on Thursday, up by 284.45 points from Wednesday’s closing of 85,186.47. The Sensex index opened on a gap-up note and continued its upward momentum, trading in the range of 85,300 and 85,500 during the morning session. In the afternoon session, the index surged as high as 85,801.70, marking its day’s high and settling above the 85,600 level. The Index was trading between the range of 85,500 and 85,800 during the afternoon session.
The BSE Sensex index had peaked at 85,801.70 and made a day’s low at 85,201.22. Finally, it had closed at 85,632.68 in green, gaining 446.21 points or 0.52%. The Relative Strength Index (RSI) stood at 69.23, near the overbought zone of 70 in the daily time frame. In the short term, the Index was above the 13/20 day EMA in the daily time frame, indicating an uptrend.
The index faces immediate resistance at 85,801.70 (R1), a level near its 52-week high. On the downside, support lies at 85,250 (S1), which was a previous resistance and now acts as support. Whereas, the next support levels (S2) are at 84,600 and (S3) at 84,035.
Trade Setup:
| Sensex | |
| Resistance 1 | 85,801.70 |
| Closing Price | 85,632.68 |
| Support 1 | 85,250.00 |
| Support 2 | 84,600.00 |
| Support 3 | 84,035.00 |
Market Recap on November 20th, 2025
On Thursday, the Nifty 50 opened higher at 26,132.1, up by 79.45 points from its previous close of 26,052.65. The index hit an intraday high of 26,246.65 and closed above the 26,150 level at 26,192.15, up 139.5 points, or 0.54%. The index closed above all key moving averages (20/50/100/200-day EMAs) on the daily chart. The BSE Sensex followed the same trajectory, opening on a positive trend at 85,470.92, up 284.45 points from the previous close of 85,186.47.
It closed at 85,632.68, up 446.21 points, or 0.52%. Both indices showed high momentum, with RSI values for the Nifty 50 at 67.66 and the Sensex at 69.23, nearing the overbought threshold of 70. Both major indices increased today, reaching a 52-week high, as FIIs bought stocks worth Rs 1,580.72 crore on Wednesday. Positive global trends, driven by a sharp rebound in technology shares following Nvidia’s strong earnings, also contributed.
The Nifty Financial Services index was the major gainer, rising 0.8% or 217.65 points, and standing at 27,861.35. Stocks such as Bajaj Finance Ltd rose 2.3%, followed by Bajaj Finserv Ltd and Cholamandalam Investment, which increased by up to 2.2% on Thursday. The Nifty India Defence index was also among the biggest gainers, rising 0.6% or 46.65 points, and standing at 8,296.85.
Stocks such as MTAR Technologies Ltd were up 3.9% on Thursday. While other Defence stocks like Paras Defence, Garden Reach Shipbuilders, and Zen Technologies also increased by up to 3.6%. The Nifty Infrastructure index was also among the top gainers, rising 0.6% or 54.9 points, and standing at 9,692.30.
On the other hand, the Nifty Media index was the major loser, falling -1.54% or -22.75 points, and standing at 1,455.55. Stocks such as Sun TV Network Ltd fell -4.08%, followed by Nazara Technologies Ltd and PVR Inox Ltd, which decreased by up to 3.72% on Thursday. The Nifty PSU Bank index was also among the biggest losers, falling -0.89% or -76.05 points, and standing at 8,500.35.
Stocks such as Punjab & Sind Bank were down -2.97% on Thursday. While other PSU Bank stocks like UCO Bank, Bank of Maharashtra, and Central Bank of India also decreased by up to -2.51%. The Nifty Consumer Durable index was also among the top losers, falling -0.53% or -203.50 points, and standing at 38,382.
Asian markets had a positive sentiment on Thursday. Japan’s Nikkei 225 increased by 1,382.30 points or 2.77%, closing at 49,920.00. While China’s Shanghai Composite decreased by -15.69 points, or -0.40%, to 3,931.05. Hong Kong’s Hang Seng Index increased by 25.35 points, or 0.10%, to close at 25,856.00. South Korea’s KOSPI rose by 75.34 points or 1.88%, closing at 4,004.85.
India VIX
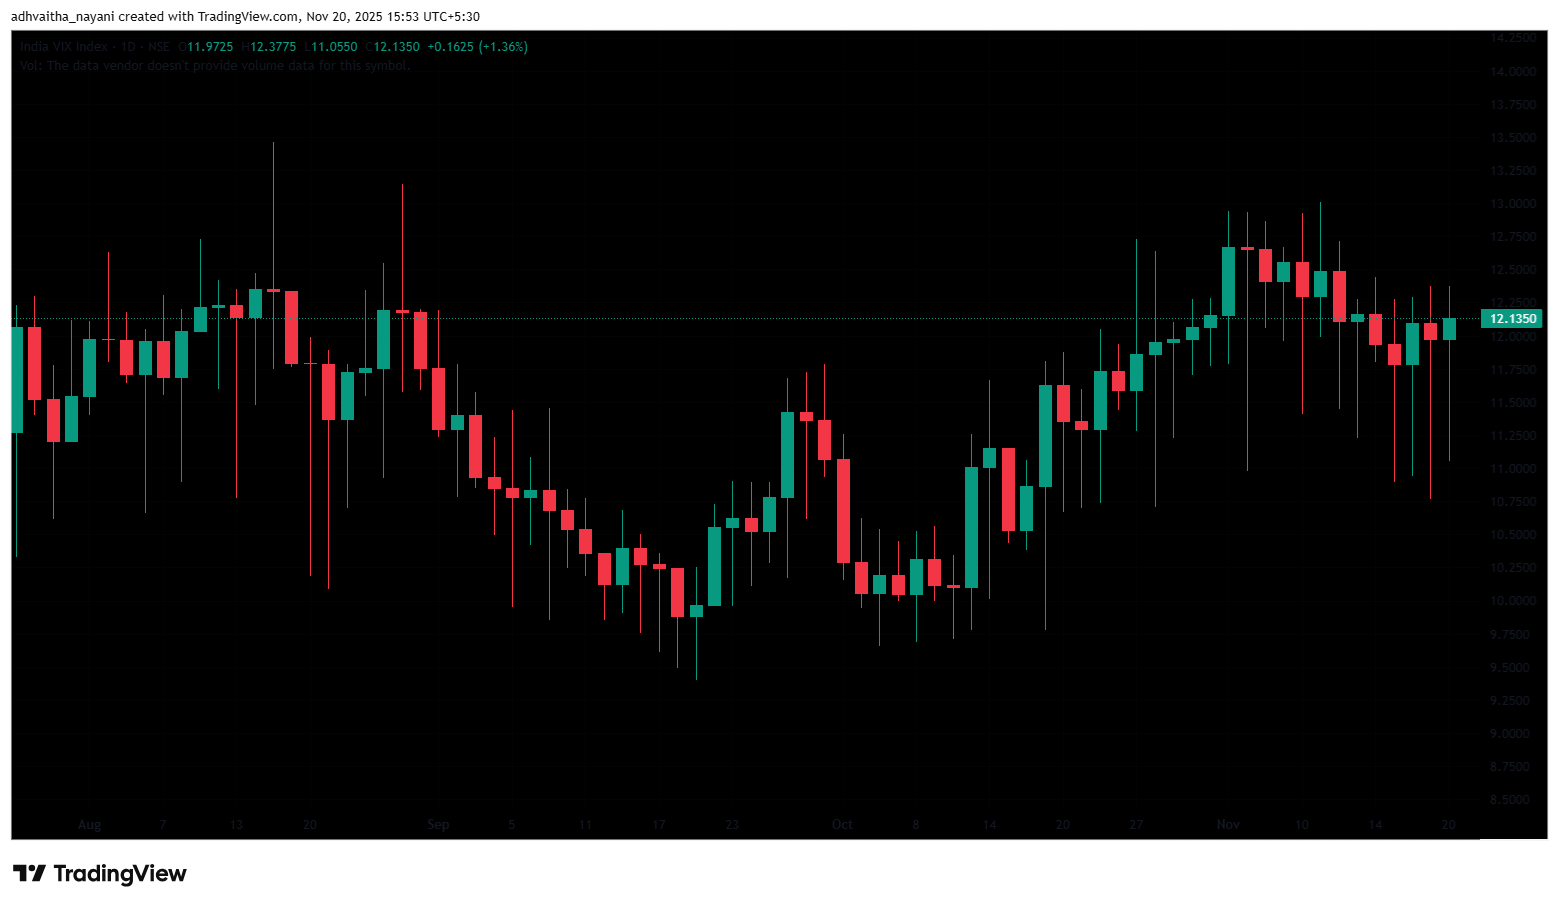
The India VIX rose 0.17 points (1.42%) from 11.97 to 12.14 during Thursday session, indicating a small uptick in expected market volatility. However, overall volatility remains low, since the India VIX is generally considered elevated only when it rises above 15.
Given the ongoing volatility and mixed sentiments, it’s advisable to avoid aggressive positions and wait for clear directional moves above resistance or below support. Traders should consider these key support and resistance levels when entering long or short positions following the price break from these critical levels. Additionally, traders can combine moving averages to identify more accurate entry and exit points.
Disclaimer

About: Trade Brains Portal is a stock analysis platform. Its trade name is Dailyraven Technologies Private Limited, and its SEBI-registered research analyst registration number is INH000015729.
Investments in securities are subject to market risks. Read all the related documents carefully before investing.
Registration granted by SEBI and certification from NISM in no way guarantee performance of the intermediary or provide any assurance of returns to investors.
The views and investment tips expressed by investment experts/broking houses/rating agencies on tradebrains.in are their own, and not that of the website or its management. Investing in equities poses a risk of financial losses. Investors must therefore exercise due caution while investing or trading in stocks. Trade Brains Technologies Private Limited or the author are not liable for any losses caused as a result of the decision based on this article. Please consult your investment advisor before investing.
