The market kicked off the week on a positive note, with key indices maintaining an upward trajectory through the session. Investor sentiment was bolstered by strong earnings from leading private sector banks, which propelled financial and banking stocks higher. Sectoral indices linked to finance, private banking, and services outperformed, reflecting broad-based buying interest across these segments. The overall tone remained bullish, supported by gains in heavyweight stocks within the financial space.
On the downside, the oil & gas sector came under pressure, reacting to fresh geopolitical developments and regulatory changes impacting global crude markets. Public sector banks also saw modest declines, partly offsetting gains in the broader market. Despite these pockets of weakness, the general market outlook remained upbeat, aligned with the positive cues from major Asian markets and U.S. futures trading in the green.
In this overview, we will analyse the key technical levels and trend directions for Nifty and BSE Sensex to monitor in the upcoming trading sessions. All the charts mentioned below are based on the 5-minute timeframe.
Nifty 50
(In this analysis, we have used 20/50/100/200 EMAs, where 20 EMA (Red), 50 EMA (Orange), 100 EMA (Light Blue), and 200 EMA (Dark Blue)).
To view other technical reports, click here
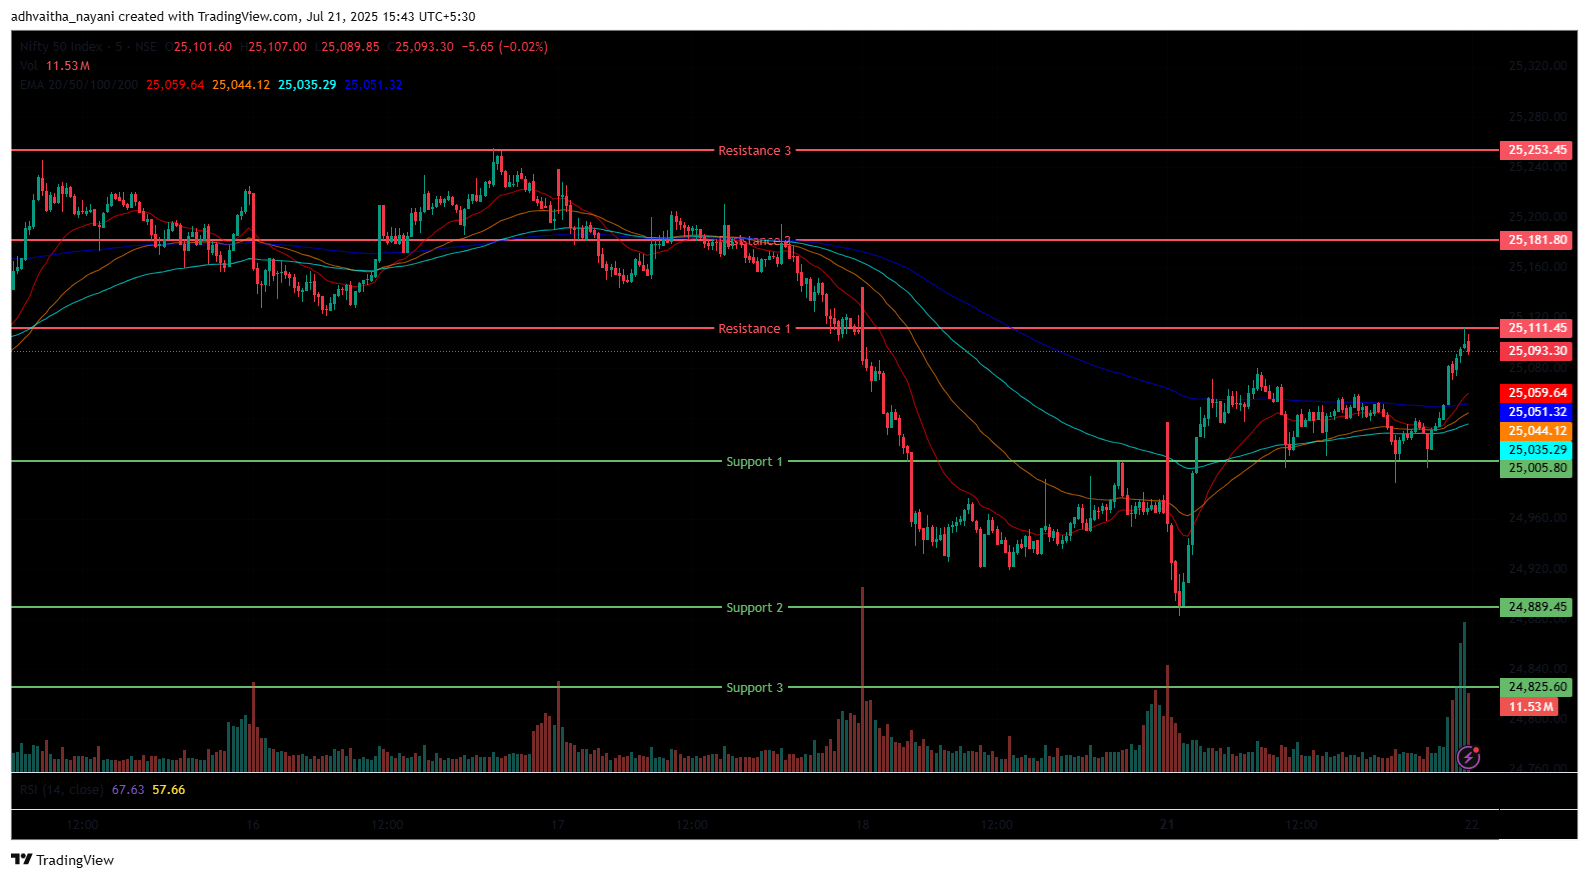
The Nifty 50 Index opened on a positive note at 24,999.00 on Monday, up by +30.6 points from Friday’s closing of 24,968.40. The Nifty Index was volatile and was trading in the range of 24,850 to 25,100 in the morning session. It was trading above its opening level at 25,046 and was below the 100/200 EMAs but above the 20/50 EMAs in the 15-minute time frame and made the day’s low at 24,882.30 in the morning session.
In the afternoon session, the Nifty Index sustained above the 25,000 level and made the day’s high at 25,111.40 in the afternoon session and closed near the day’s high at 25,090.70 in green. During the afternoon session, it closed above the EMAs of 20/50/100 but below the 200 EMAs in the 15-minute time frame in the afternoon session. Nifty’s immediate resistance levels are R1 (25,111), R2 (25,182), and R3 (25,253), while immediate support levels are S1 (25,006), S2 (24,889), and S3 (24,826).
The Nifty index had reached a day’s high at 25,111.40, closed in green above the 25,000 level, and saw a day’s low at 24,882.30. Finally, it had closed above the opening level at 25,090.70, gaining +122.3 points or +0.49%. The Relative Strength Index (RSI) stood at 47.63 (below the overbought zone of 70) in the daily time frame, and Nifty 50 closed above the three 50/100/200 EMAs and remained only below the 20 EMA in the daily time frame.
Bank Nifty
(In this analysis, we have used 20/50/100/200 EMAs, where 20 EMA (Red), 50 EMA (Orange), 100 EMA (Light Blue), and 200 EMA (Dark Blue)).
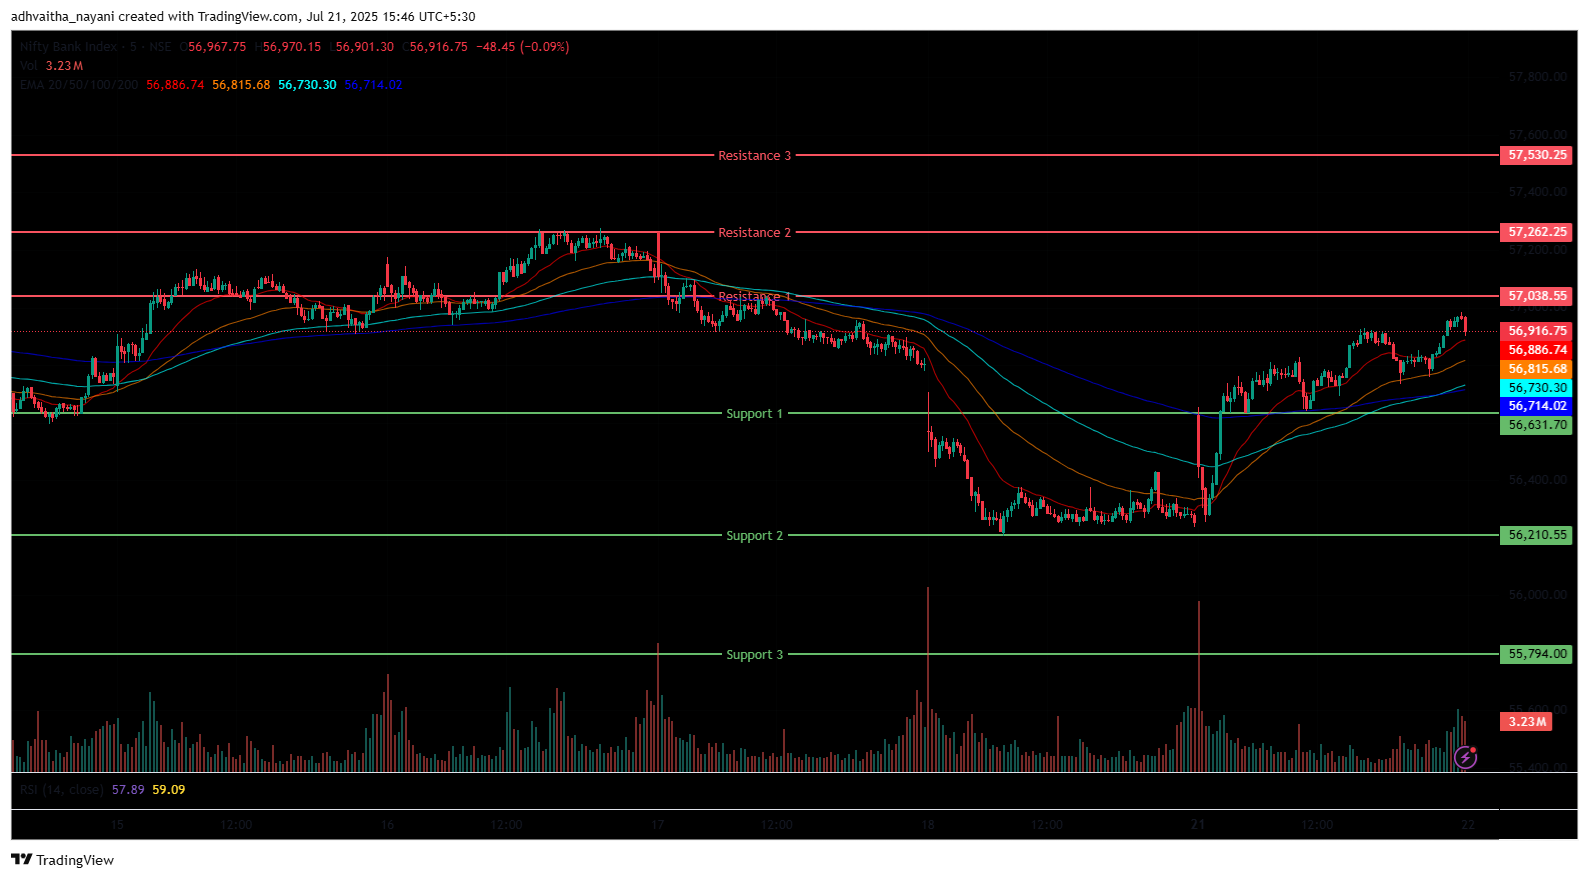
The Bank Nifty Index started the session on a positive note at 56,558.90 on Monday, up by +275.9 points from Friday’s closing of 56,283.00. In the morning session, the index was positive and surged upwards by +232.4 points. It was trading between the range of 56,250 to 56,850 levels and broke the 56,800 level above and was above the 20/50/100 EMAs but below the 200 EMAs in the 15-minute time frame and made the day’s low at 56,255.70 in the morning session.
In the afternoon session, the Bank Nifty sustained above the 56,800 level and made the day’s high at 56,983.45 in the afternoon session. On Monday, the Nifty Bank closed near the day’s high at 56,952.75 in green. During the afternoon session, it closed above all four 20/50/100/200 EMAs in a 15-minute time frame in the afternoon session. Bank Nifty immediate resistance levels are R1 (57,039), R2 (57,262), and R3 (57,530), while immediate support levels are S1 (56,632), S2 (56,211), and S3 (55,794).
The Bank Nifty index had peaked at 56,983.45 and made a day’s low at 56,255.70. Finally, it had closed in green at 56,952.75, gaining +669.75 points or 1.19%. The Relative Strength Index (RSI) stood at 54.1 (below the overbought zone of 70) in the daily time frame, and Bank Nifty was above all four 20/50/100/200 EMAs in the daily time frame.
Sensex
(In this analysis, we have used 20/50/100/200 EMAs, where 20 EMA (Red), 50 EMA (Orange), 100 EMA (Light Blue), and 200 EMA (Dark Blue)).
To view other technical reports, click here
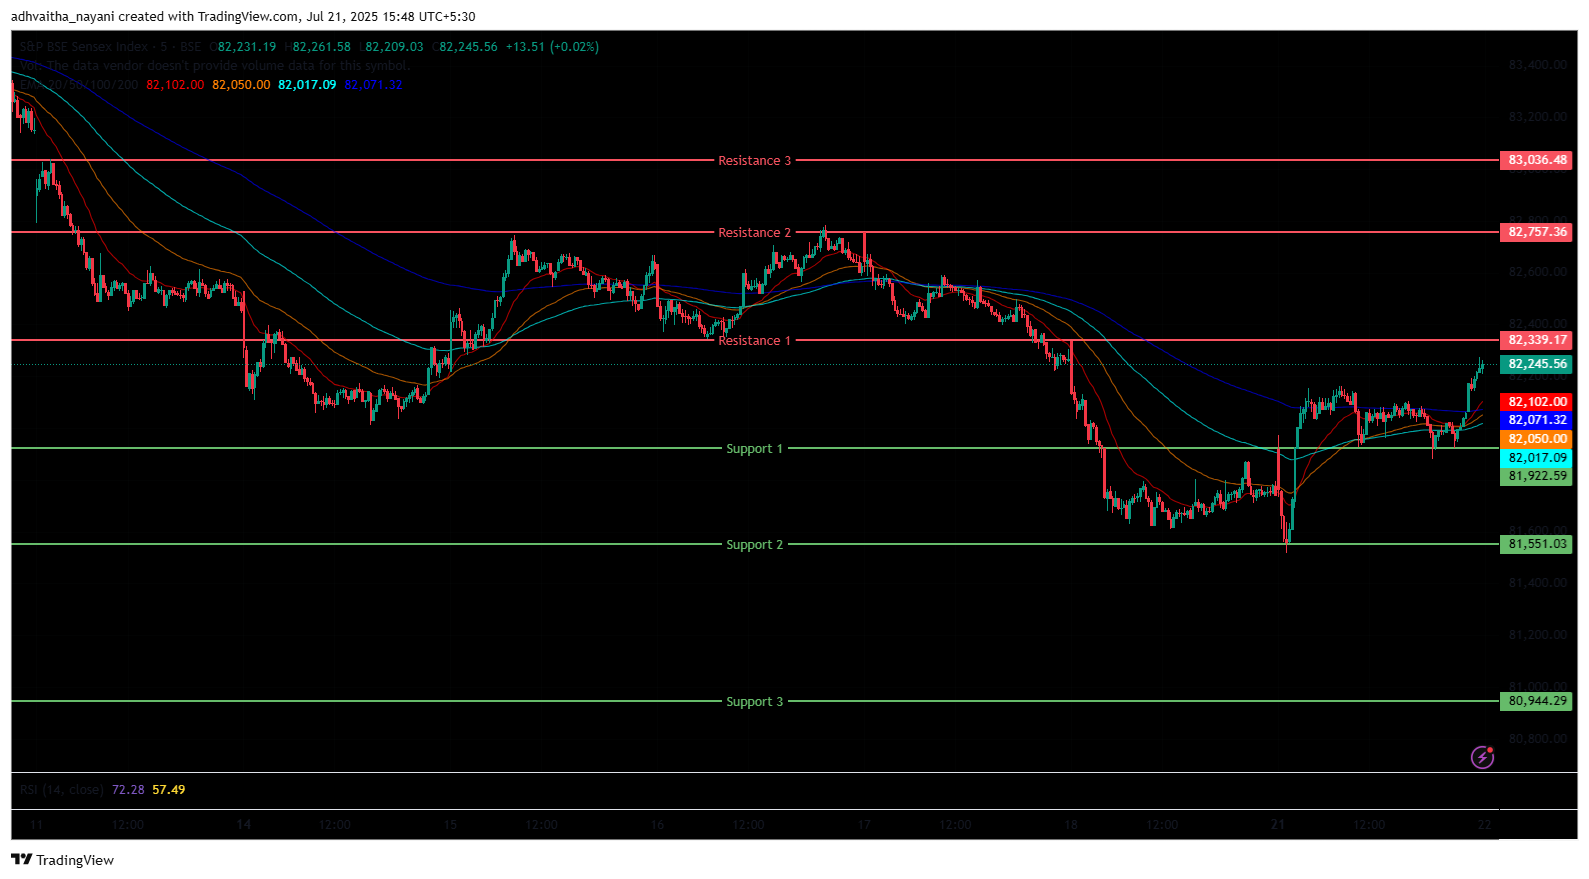
The BSE Sensex Index followed a similar trend as the Nifty 50, opening on a positive note at 81,918.53 on Monday, up by +160.8 points from Friday’s closing of 81,757.73. The Index was volatile in the morning session and surged upwards by +131.63 points and was trading in the range of 81,500 to 82,200 levels. It was trading above the opening level at 82,050 and was trading above the 20/50 but below the 100/200 EMAs in the 15-minute time frame and made a day’s low at 81,518.66 in the morning session. In the afternoon session, the Sensex Index sustained above the 81,900 level and made the day’s high at 82,274.03.
The Sensex closed near the day’s high at 82,200.34 in green. During the afternoon session, it traded above the 20/50/100 but below the 200 EMAs in the 15-minute time frame. BSE Sensex immediate resistance levels are R1 (82,339), R2 (82,757), and R3 (83,036), while immediate support levels are S1 (81,923), S2 (81,551), and S3 (80,944).
The BSE Sensex index had peaked at 82,274.03 and made a day’s low at 81,518.66. Finally, it had closed at 82,200.34, up by +442.62 points or 0.54%. The Relative Strength Index (RSI) stood at 46.82 (below the overbought zone of 70) in the daily time frame, and the BSE Sensex was above the 50/100/200 EMAs but remained below the 20 EMA in the daily time frame.
India VIX
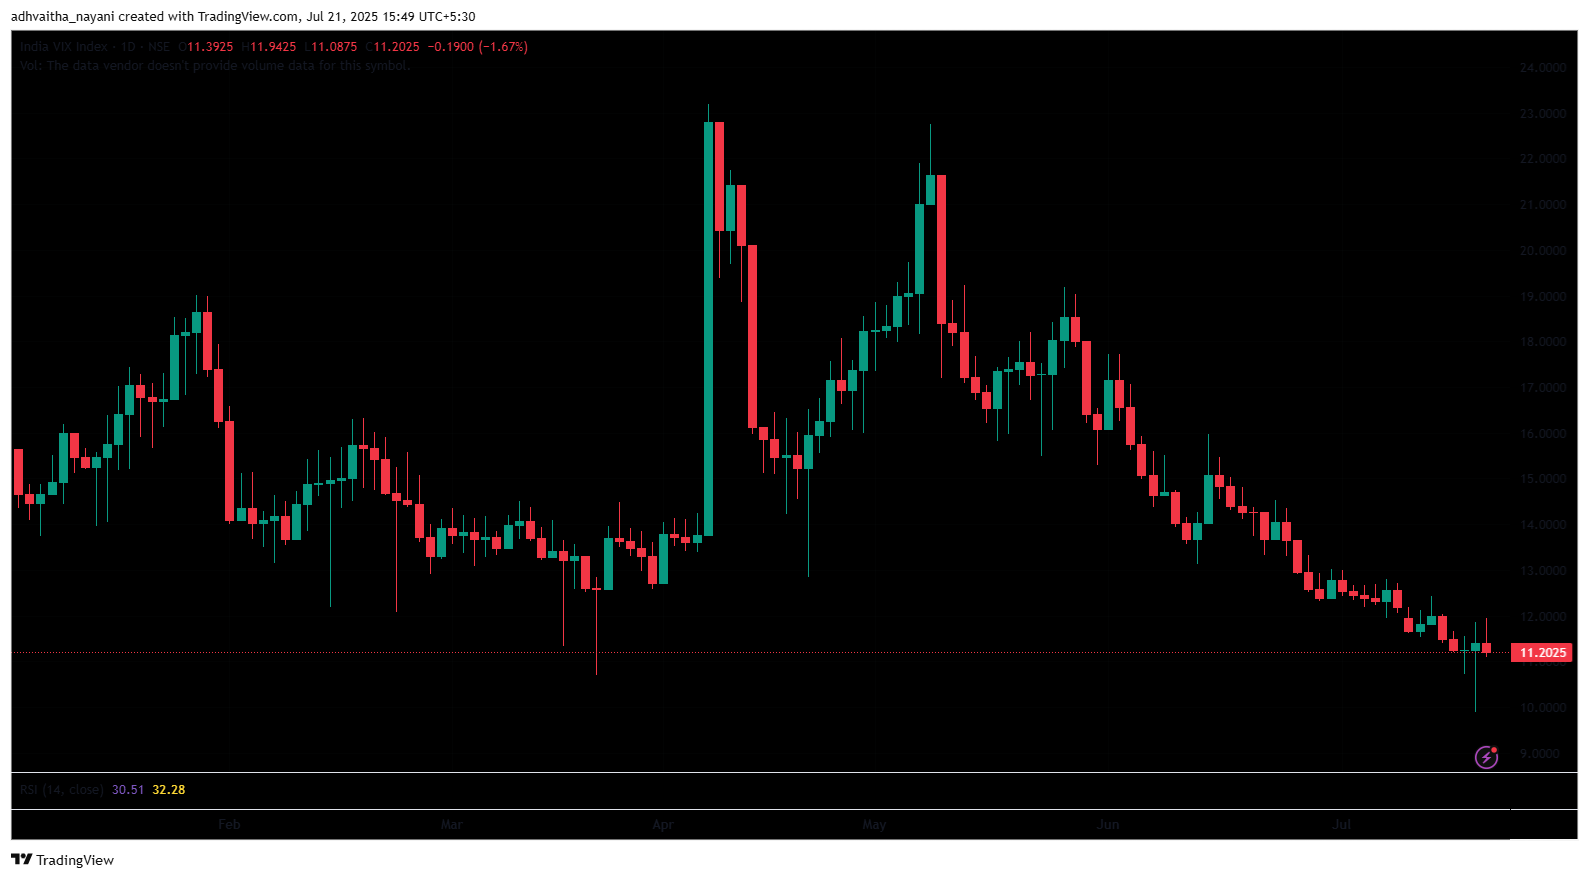
On Monday’s session, the India VIX decreased from 11.39 to 11.20, down by -0.19 points or 1.67%. The decrease in the VIX index shows a calm market and an expectation of lower price fluctuations in the near future.
Market Recap 21st July 2025
The Nifty 50 index opened Monday at 24,999, gaining 31 points over Friday’s close of 24,968. The index maintained an upward trajectory throughout the session, hitting an intraday high of 25,111. On the daily chart, it traded above the 50/100/200-day EMAs, though it remained below the 20 EMA. The RSI stood at 47.63, well below the overbought threshold of 70.
The BSE Sensex mirrored this positive start, opening at 81,918, up 160 points from the previous close of 81,758. The bullish sentiment was largely driven by strong quarterly earnings from major private sector banks. Shares of HDFC Bank and ICICI Bank surged by 2.8% after posting better results. The Bank Nifty index also closed higher at 56,952.75, gaining 669.75 points or 1.2%.
Most sectoral indices ended in the green on Monday, with only a few posting losses. One of the standout performers was the Nifty Finance Index, which closed at 26,990, up 434.75 points or 1.64%. Financial and banking stocks such as ICICI Bank Ltd (up 2.8%), HDFC Bank Ltd (up 2.2%), and ICICI Lombard General Insurance (up 2%) contributed significantly to the index’s rise. The Nifty Private Bank Index also ended higher at 27,888, rising 354.45 points or 1.3%. Similarly, the Nifty Service Index followed suit, closing at 33,129, up 368.10 points or 1.1%. Key contributors to the gains included Eternal, ICICI Bank, and Infoedge, with some stocks advancing up to 4%.
On the flip side, the Nifty Oil & Gas Index declined, closing at 11,643, a drop of 128.80 points or 1.09%. The index was weighed down by major players like Reliance Industries, Gujarat State Petronet, and Gujarat Gas, with Reliance leading the losses, down 3.14%. The decline came in response to the European Union tightening sanctions on the shadow fleet carrying Russian oil and lowering the price cap on Russian crude. The Nifty PSU Bank Index also ended in the red at 7,121.15, down 41.35 points or 0.58%.
Asian markets showed a broadly positive trend. Hong Kong’s Hang Seng Index rose by 168.48 points, or 0.67%, to reach 24,994.14. South Korea’s Kospi ended at 3,210.81, gaining 22.74 points or 0.71%, while the Shanghai Composite Index advanced by 25.31 points or 0.71%, to close at 3,559.79. In the U.S., Dow Jones Futures were trading higher by 87.9 points or 0.2%, at 44,430.09, as of 4:40 p.m. IST.
Trade Setup Summary
The Nifty 50 opened on a positive note on Monday, was more volatile in the morning session, and surged upwards throughout the session and closed at 25,091 broke above the 25,000 level. A break below 25,006 could trigger further selling towards 24,889, while a break above 25,111 could trigger bullishness towards 25,182.
Bank Nifty started the session on a positive note at 56,558.90 and ended in green at 56,952.75, breaking above the 56,900 level. A break below 56,632 could trigger further selling towards 56,211, while a break above 57,039 could trigger bullishness towards 57,262. Sensex opened on a similar trend, opening on a positive note at 81,918.53 and ending at 82,200.34 in green. A break below 81,923 could trigger further selling towards 81,551, while breaking the next resistance level of 82,339 could lead towards the 82,757 level.
Given the ongoing volatility and mixed sentiments, it’s advisable to avoid aggressive positions and wait for clear directional moves above resistance or below support. Traders should consider these key support and resistance levels when entering long or short positions following the price break from these critical levels. Additionally, traders can combine moving averages to identify more accurate entry and exit points.
Disclaimer

The views and investment tips expressed by investment experts/broking houses/rating agencies on tradebrains.in are their own, and not that of the website or its management. Investing in equities poses a risk of financial losses. Investors must therefore exercise due caution while investing or trading in stocks. Trade Brains Technologies Private Limited or the author are not liable for any losses caused as a result of the decision based on this article. Please consult your investment advisor before investing.
About: Trade Brains Portal is a stock analysis platform. Its trade name is Dailyraven Technologies Private Limited, and its SEBI-registered research analyst registration number is INH000015729.
Investments in securities are subject to market risks. Read all the related documents carefully before investing.
Registration granted by SEBI and certification from NISM in no way guarantee performance of the intermediary or provide any assurance of returns to investors.
