Nifty ended on an optimistic note on Friday after losing in the past three sessions, finally closing above the 25,000 mark. Bank Nifty closed above the 56,000 mark, and Sensex was above the 82,000 levels. Despite the ongoing geopolitical tensions, the market managed to register weekly gains, with more than 44 Nifty stocks ending in the green.
In addition, the easing of tensions in the Middle East, the correction of crude oil prices, and foreign investment all contributed to the increase in indices. Additionally, the India VIX fell 4.13 percent to 13.7 on Friday, hitting a weekly low, indicating a decline in investor apprehension and an improvement in market mood.
In the international Asian market, experienced mixed sentiments as China maintained its benchmark rates at their current level, as investors anxiously watched the developments between Israel and Iran. The South Korean Kospi index maintained its upward trend in the Asia-Pacific markets. The US Dow Jones Futures were up 267.37 points, or 0.41% on Friday. The US Fed kept the rates unchanged on Wednesday.
In this overview, we will analyze the key technical levels and trend directions for Nifty, Bank Nifty, and BSE Sensex to monitor in the upcoming trading sessions. All the charts mentioned below are based on the 5-minute timeframe.
NIFTY 50 Chart & Price Action Analysis
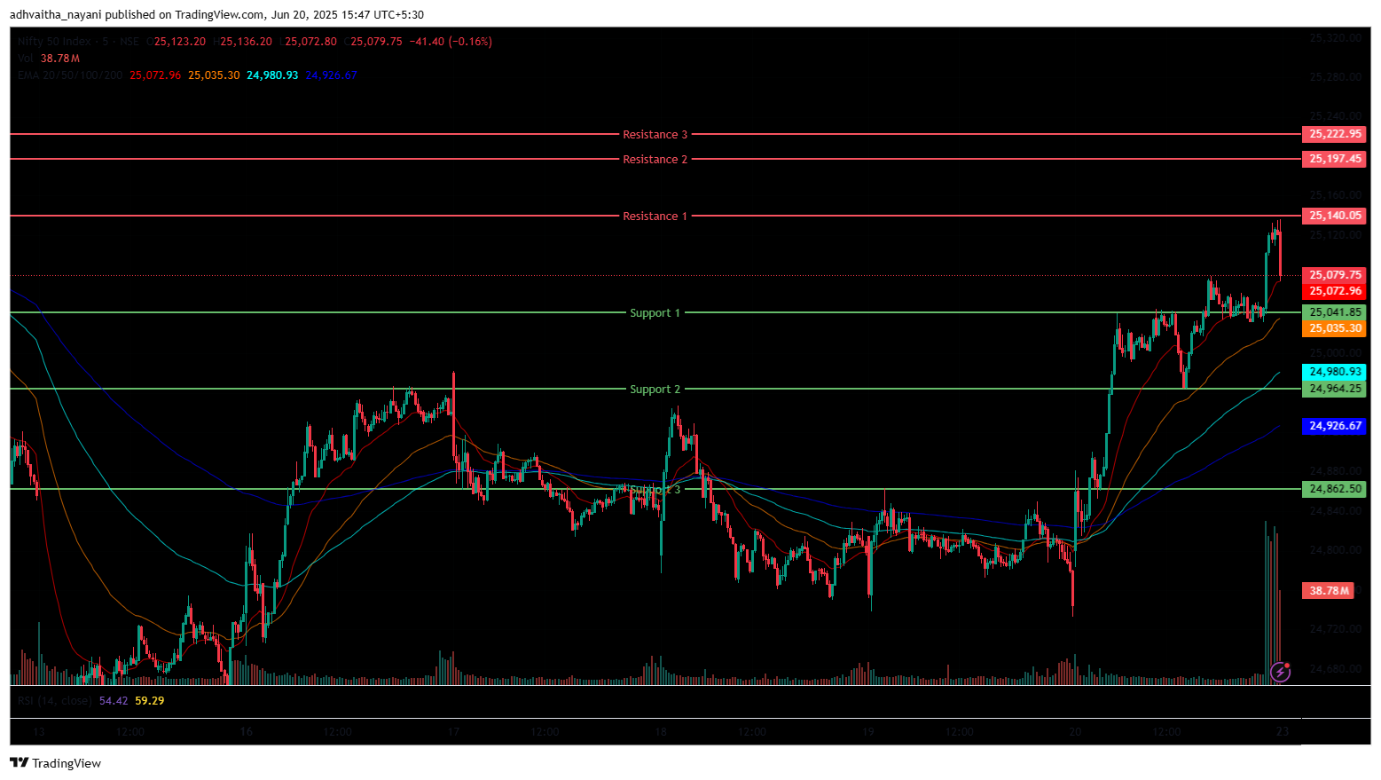
(In this analysis, we have used 20/50/100/200 EMAs, where 20 EMA (Red), 50 EMA (Orange), 100 EMA (Light Blue), 200 EMA (Dark Blue)).
The Nifty 50 Index opened on a flat note at 24,787.65 on Friday, down by 5.6 points from Thursday’s closing of 24,793.25. However, the Nifty Index rebounded strongly in the morning session from the day’s low and closed in green. It was trading above the opening level, around the 25,000.90 range, in the morning session, up 213.25 points and above all four 20/50/100/200 EMAs in the 15-minute time frame. In the afternoon session, the Nifty Index had further moved upside and closed in green, reaching 25,079.75 and staying above the 20/50/100/200-day EMAs in the 15-minute time frame.
Nifty’s immediate resistance levels are R1 (25,140), R2 (25,197), and R3 (25,223), while immediate support levels are S1 (25,042), S2 (24,964), and S3 (24,863). The Nifty index had reached a day’s high at 25,136.20, closed above the 25,000 mark, and saw a day’s low at 24,783.65. Finally, it had closed at 25,112.40, in green, gaining +319.15 points or 1.29%. The Relative Strength Index (RSI) stood at 59.05 (well below the overbought zone of 70) in the daily time frame, and Nifty 50 closed above the four 20/50/100/200 EMAs in the daily time frame.
Bank Nifty Chart & Price Action Analysis
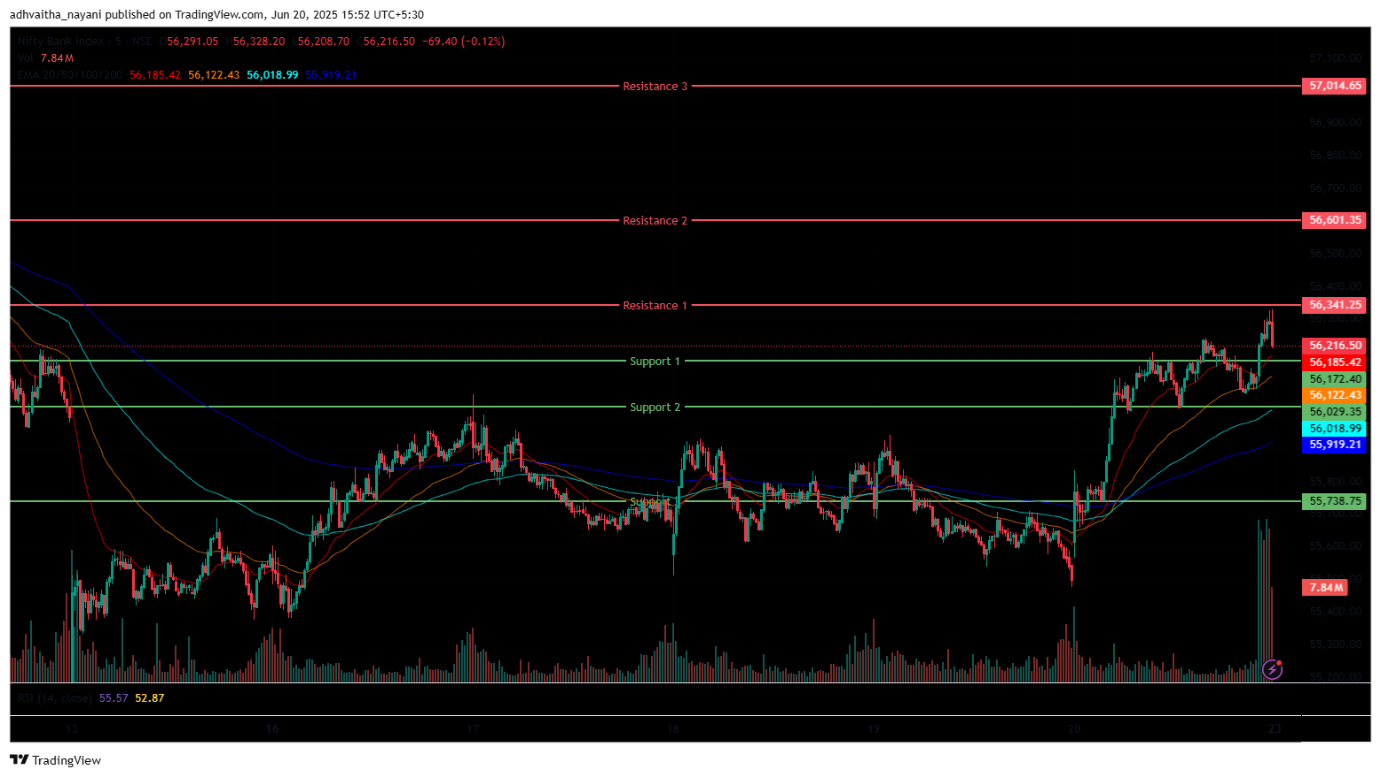
(In this analysis, we have used 20/50/100/200 EMAs, where 20 EMA (Red), 50 EMA (Orange), 100 EMA (Light Blue), 200 EMA (Dark Blue)).
The Bank Nifty Index had also opened on a flat note at 55,566.70. It was trading above the opening level at the 56,117.50 range in the morning session in green and closed above all four 20/50/100/200 EMAs in the 15-minute time frame. While in the afternoon session, Bank Nifty continued the upward trend was closed at 56,216.50, which was above all four 20/50/100/200-day EMAs in the 15-minute time frame. Bank Nifty immediate resistance levels are R1 (56,341), R2 (56,601), and R3 (57,015), while immediate support levels are S1 (56,172), S2 (56,029), and S3 (55,739).
The Bank Nifty index had peaked at 56,328.20 and had a day’s low at 55,566.40. The Bank Nifty ended in green and closed above the day’s low at 56,215.35, up by +637.90 points or 1.15%. The Relative Strength Index (RSI) stood at 57.77 (well below the overbought zone of 70) in the daily time frame, and Bank Nifty closed above all four 20/50/100/200 EMAs in the daily time frame.
BSE Sensex Chart & Price Action Analysis
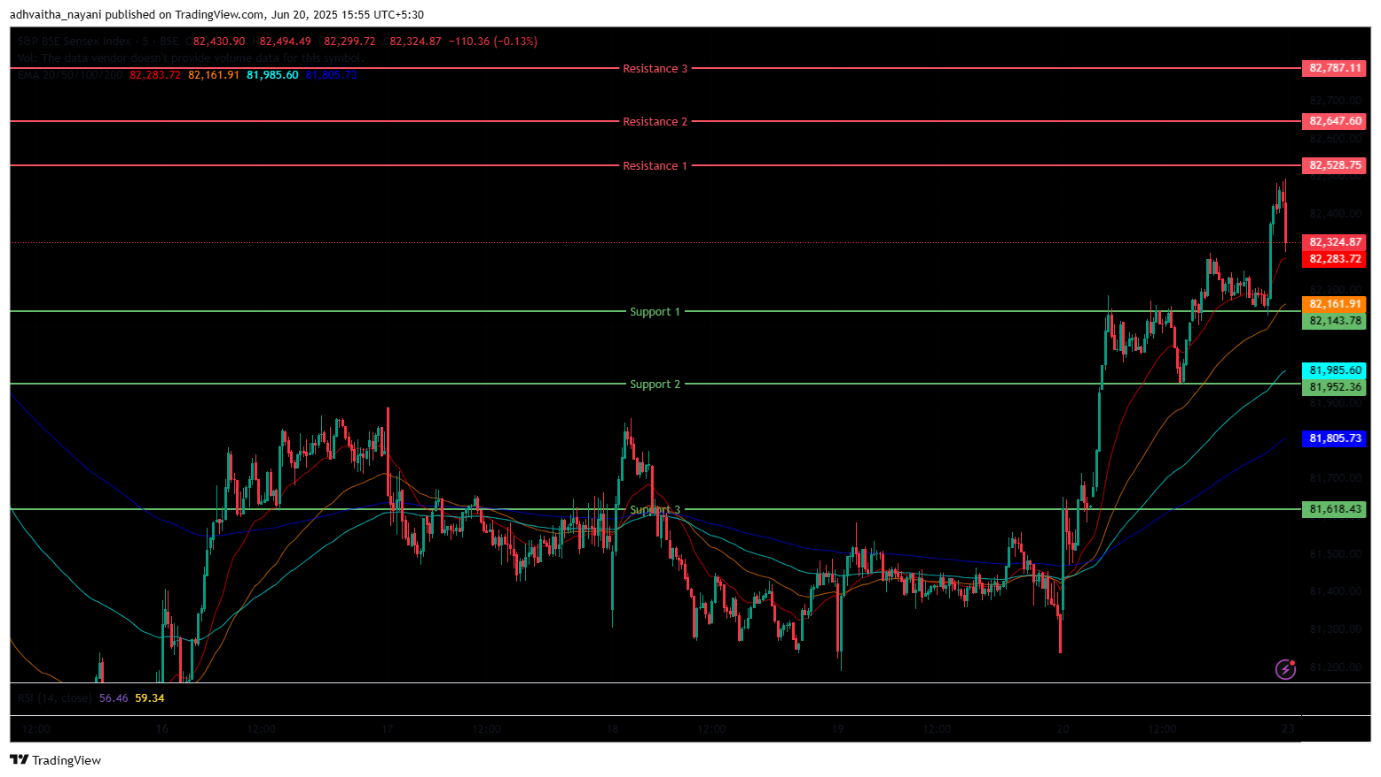
(In this analysis, we have used 20/50/100/200 EMAs, where 20 EMA (Red), 50 EMA (Orange), 100 EMA (Light Blue), 200 EMA (Dark Blue)).
The BSE Sensex Index had opened on a flat note at 81,354.85. It was trading above the opening level at 82,068.49 in the morning session, in green and above all four 20/50/100/200 EMAs in the 15-minute time frame. In the afternoon session, the BSE Sensex continued in green and closed around 82,323.37 and above all four 20/50/100/200 EMAs in the 15-minute time frame.
BSE Sensex immediate resistance levels are R1 (82,529), R2 (82,648), and R3 (82,787), while immediate support levels are S1 (82,144), S2 (81,952), and S3 (81,618). The BSE Sensex index had peaked at 82,494.49 and had a day’s low at 81,323.20. Finally, it had strongly rebounded from the start and closed at 82,408.17 in green, up by +1,046.30 points or 1.29%. The Relative Strength Index (RSI) stood at 65.58 (well below the overbought zone of 70) in the daily time frame, and BSE Sensex was above the 20/50/100/200 EMAs in the daily time frame.
Market Recap June 20th, 2025
Markets on Friday opened with the Nifty at 24,787.65, rising to a day’s high of 25,136.20 and closing at 25,112.40. The Nifty 50 ended the day up 1.29%, or 319.15 points. The BSE Sensex had begun at 81,354.85 and closed at 82,408.17, gaining 1,046.30 points, also up 1.29%. Both indices closed above their 20, 50, 100, and 200-day EMAs. The Nifty 50’s RSI stood at 59.09, while the BSE Sensex’s RSI was at 58.29, both well below the overbought threshold of 70. The gains were driven by easing tensions in the Middle East, a correction in crude oil prices, and renewed foreign investor buying. Additionally, India VIX fell 4.13% to 13.7, hitting a weekly low on Friday, signaling reduced investor anxiety and improved market sentiment.
All major indices ended in the green. The Nifty Realty index was among the top performers, closing at 1,013.65, up 20.90 points or 2.11%. Notable gainers in this index included Macrotech Developers, Phoenix Mills Ltd., and Prestige Estates Projects, all of which rose more than 2% on the day. The Nifty Infrastructure index also posted solid gains, climbing 1.73% to close at 9,130.55. Among the key contributors were Max Healthcare Institution, Indus Towers Ltd., and CG Power & Industrial Solutions, each advancing over 3%.
The Nifty PSU Bank index rose by 110.45 points, or 1.64%, to close at 6,844.75, with Union Bank of India, Canara Bank, and Indian Overseas Bank leading the sector with gains exceeding 2%. Asian markets showed mixed sentiment. While China kept its benchmark rates steady, investors remained watchful of developments between Israel and Iran. In the Asia-Pacific region, South Korea’s Kospi index continued its upward momentum, climbing 1.48%, or 44.10 points, to close at 3,021.84 a three-year high. The Hong Kong Hang Seng index rose 1.24%, or 292.74 points, to finish at 23,530.48. Japan’s Nikkei 225 slipped by 85.11 points, or 0.22%, to close at 38,403.23, while the Shanghai index edged down 2.21 points, or 0.07%, ending the day at 3,359.90. In the US, Dow Jones Futures climbed 267.37 points, or 0.63%, to close at 42,444.03.
Over the week, the Nifty 50 gained 1.59%. Despite the gains, investor sentiment remained cautious due to ongoing geopolitical tensions, fluctuations in crude oil prices, and the US Federal Reserve’s decision to keep interest rates unchanged.
India VIX
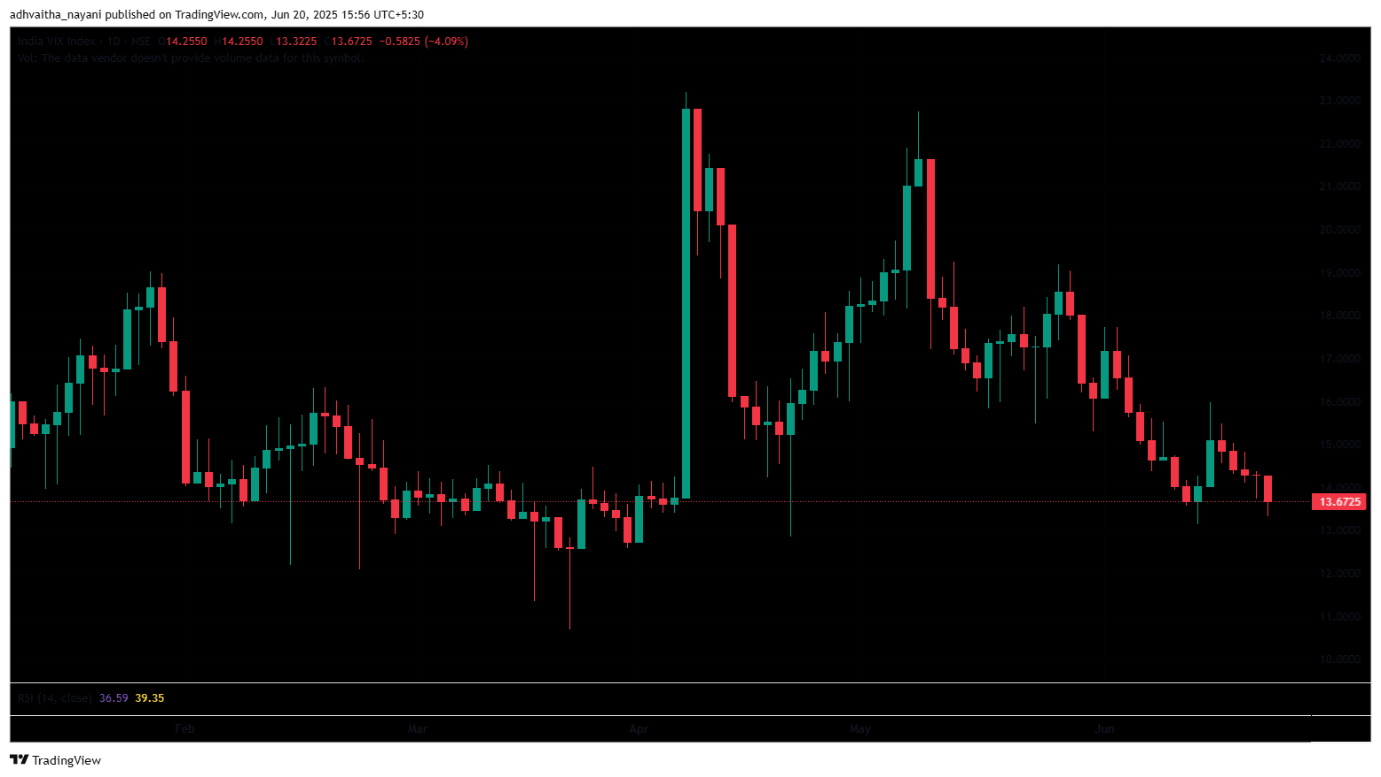
The India VIX decreased from 14.25 to 13.67. The index continued to ease from the recent high of 15.98, which was marked on 13th June 2025, thus indicating lessened market volatility.
Trade Setup Summary
The Nifty 50 opened on a positive note on Friday and maintained its uptick throughout the trading session, breaking above the 25,000 mark, and closed at 25,112, peaking at 25,136. The index ended in the green despite the ongoing geopolitical tensions with the Iran-Israel war. A break below 25,042 could trigger further selling towards 24,964.
Bank Nifty opened on a similar note and tested the levels of 56,029, which stands as a key support level. In the afternoon session, Bank Nifty surged to a day’s high at 56,328 and closed slightly below at 56,253. All major banking stocks were in the green, with heavyweights including HDFC Bank, ICICI Bank, Axis Bank, etc, pulling the index upwards. A break below 56,172 could trigger further selling towards 56,029. Sensex opened on a similar trend, closing on a positive note and breaking the 82,000 level. A break below 82,144 could trigger further selling towards 81,952.
Given the ongoing volatility and mixed sentiments, it’s advisable to avoid aggressive positions and wait for clear directional moves above resistance or below support. Traders should consider these key support and resistance levels when entering long or short positions following the price break from these critical levels. Additionally, traders can combine moving averages to identify more accurate entry and exit points.
Disclaimer

The views and investment tips expressed by investment experts/broking houses/rating agencies on tradebrains.in are their own, and not that of the website or its management. Investing in equities poses a risk of financial losses. Investors must therefore exercise due caution while investing or trading in stocks. Trade Brains Technologies Private Limited or the author are not liable for any losses caused as a result of the decision based on this article. Please consult your investment advisor before investing.
About: Trade Brains Portal is a stock analysis platform. Its trade name is Dailyraven Technologies Private Limited, and its SEBI-registered research analyst registration number is INH000015729.
Investments in securities are subject to market risks. Read all the related documents carefully before investing.
Registration granted by SEBI and certification from NISM in no way guarantee performance of the intermediary or provide any assurance of returns to investors.
