Equity markets ended the week on a softer note, with both the Nifty 50 and the Sensex opening lower and slipping further through the session. Despite showing resilience by holding above key moving averages, the benchmarks came under steady selling pressure and closed near the day’s lows. Momentum indicators remained comfortably below overbought levels, suggesting that the recent moderation was more of a pause than a reversal in the broader trend.
Across sectors, most indices finished in negative territory, reflecting widespread weakness. FMCG stocks were the rare bright spot, managing modest gains even as metal, defence, and realty counters saw notable declines. Global cues were largely subdued as well, with major Asian markets retreating sharply, though U.S. futures hinted at some optimism. For the week, the headline indices still managed marginal gains, supported in part by sustained domestic participation, underscored by the continued rise in demat account openings amid strong interest in new listings.
In this overview, we will analyse the key technical levels and trend directions for Nifty and BSE Sensex to monitor in the upcoming trading sessions. All the charts mentioned below are based on the 15-minute timeframe.
NIFTY 50 Chart & Price Action Analysis

To view other technical reports, click here
The Nifty 50 Index opened on a negative note at 26,109.55 on Friday, down by 82.6 points from Thursday’s closing of 26,192.15. The index opened on a gap-down note and dragged down to the 26,056 level in the morning session, trading below the 26,100 level. The Index was trading within the range of 26,050 and 26,200. In the afternoon session, the index formed a rangebound and reached its day low at 26,052.20 and settled near the 26,050 level, ending the session on a Bearish note.
The Nifty index had reached a day’s high at 26,179.20 and saw a day’s low at 26,052.20. Finally, it had closed at 26,068.15, in the red, below the 26,100 level, down 124 points, or 0.47%. In the short term, the Index was above the 13/20 day EMA in the daily time frame.
The Index’s nearest resistance levels are at 26,170.2 (R1) and 26,246.65 (R2), which is the 52-week high for the index. On the other hand, the closest support is now at 26,052.45 (S1) and 25,855.25 (S2), which was a previous resistance level but has turned into support. If the index falls below this, the next strong support level to watch is at 25,741.52 (S3).
Trade Setup:
| Nifty 50 | |
| Resistance 2 | 26,246.65 |
| Resistance 1 | 26,170.20 |
| Closing Price | 26,068.15 |
| Support 1 | 26,052.45 |
| Support 2 | 25,855.25 |
| Support 3 | 25,741.52 |
NIFTY 50 Momentum Indicators Analysis

RSI (Daily): The Nifty 50’s RSI stood at 61.95, which is below the overbought zone of 70, indicating bullish sentiment and room to grow higher.
Bollinger Bands (Daily): The index is trading in the upper band of the Bollinger Band range (Simple Moving Average). Its position in the upper range suggests a bullish sentiment and in Friday’s session, the Index formed a shooting star candlestick pattern in the daily time frame, which indicates a bearish reversal signal. The index took support near 26,052.2, and 26,179.2 acted as a resistance level. A sustained move above the middle band signals a bullish sentiment, while a drop back toward the lower band may reinforce bearish sentiment.
Volume Analysis: Friday’s trading session had an average volume of 235.58 Mn.
Derivatives Data: Options OI indicates strong Put writing at 26,050, followed by 26,000, establishing a strong support zone. On the upside, a significant Call OI buildup at 26,100 and 26,200 suggests a potential supply of resistance. PCR (Put/Call Ratio) stands at 1 (=1), leaning towards neutral sentiment, and the Short Buildup indicates a strong bearish sentiment, thus overall indicating a neutral to bearish outlook for the next trading session.
Bank Nifty Chart & Price Action Analysis
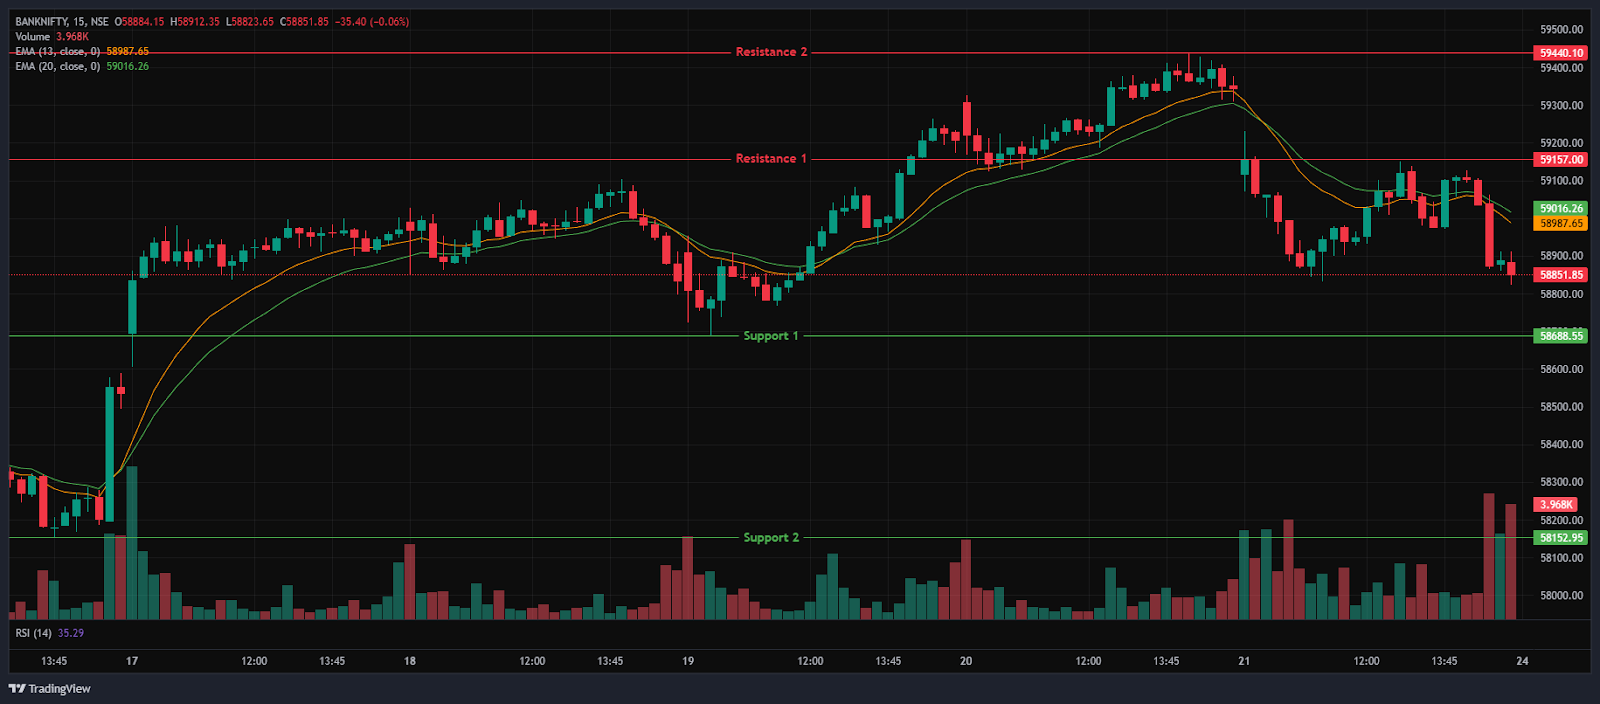
The Bank Nifty Index also opened on a negative note at 59,116.70 on Friday, which was down by 231 points from Thursday’s closing of 59,347.70. The index was trading within the range of 58,800 and 59,250 in the morning session, following a gap-down note. In the afternoon session, the index formed a rangebound and reached the day’s low at the 58,823.65 level and settled below the 58,850 level. It traded in the range of 58,800 and 59,150, ending the day near the 58,850 mark.
The Bank Nifty index had peaked at 59,232.15 and made a day’s low at 58,823.65. Finally, it had closed in red at 58,867.70, ending near the 58,850 level, losing 480 points or 0.81%. The Relative Strength Index (RSI) stood at 63.68, below the overbought zone of 70 in the daily time frame. In the short term, the Index was above the 13/20 day EMA in the daily time frame.
The nearest resistance level is at 59,157 (R1) and a higher resistance level is at 59,440.10 (R2), which is the all-time high for the index. On the other hand, the closest support is now at 58,688.55 (S1), which was the previous resistance level but has turned into support. If the index falls below this, the next major support level to watch is at 58,152.95 (S2).
Trade Setup:
| Bank Nifty | |
| Resistance 2 | 59,440.10 |
| Resistance 1 | 59,157.00 |
| Closing Price | 58,867.70 |
| Support 1 | 58,688.55 |
| Support 2 | 58,152.95 |
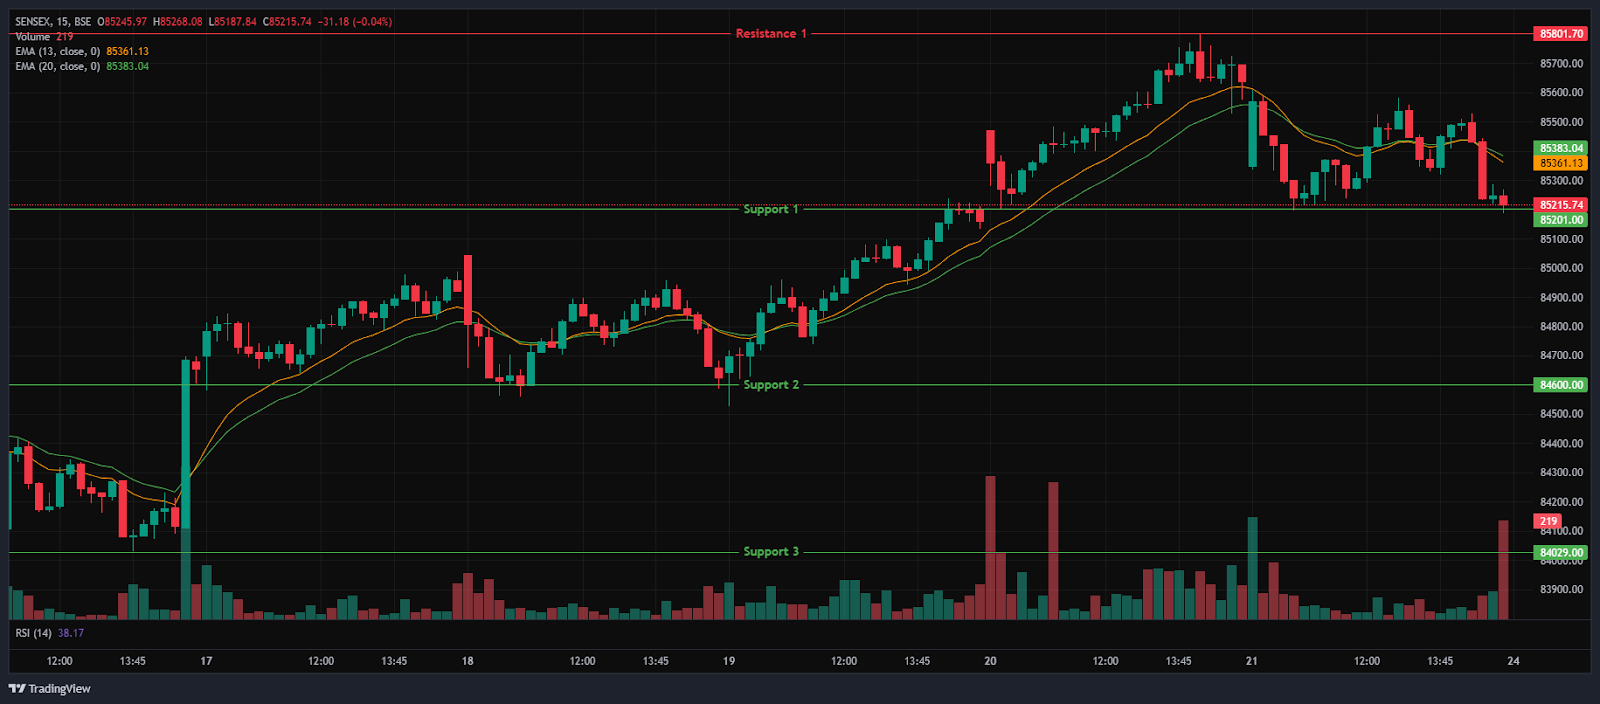
BSE Sensex Chart & Price Action Analysis
To view other technical reports, click here
The BSE Sensex Index opened on a negative note at 85,347.40 on Friday, down by 285.28 points from Thursday’s closing of 85,632.68. The Sensex index opened on a gap-down note and dragged down to the 85,195 level, trading in the range of 85,150 and 85,650 during the morning session. In the afternoon session, the index fell as low as 85,187.84, marking its day’s low and settling above the 85,200 level. The Index was trading between the range of 85,150 and 85,600 during the afternoon session.
The BSE Sensex index had peaked at 85,609.40 and made a day’s low at 85,187.84. Finally, it had closed at 85,231.92 in red, losing 400.76 points or 0.47%. The Relative Strength Index (RSI) stood at 63.38, near the overbought zone of 70 in the daily time frame. In the short term, the Index was above the 13/20 day EMA in the daily time frame.
The index faces immediate resistance at 85,801.70 (R1), a level near its 52-week high. On the downside, support lies at 85,201 (S1) and 84,600 (S2), which was a previous resistance and now acts as support. Whereas, the next support level (S3) is at 84,029 and (S3).
Trade Setup:
| Sensex | |
| Resistance 1 | 85,801.70 |
| Closing Price | 85,231.92 |
| Support 1 | 85,201.00 |
| Support 2 | 84,600.00 |
| Support 3 | 84,029.00 |
Market Recap on November 21st, 2025
On Friday, the Nifty 50 opened slightly lower at 26,109.55, down by -82.65 points from its previous close of 26,192.15. The index hit an intraday low of 26,052.2 and closed below the 26,100 level at 26,068.15, down -124 points, or 0.47%. The index closed above all key moving averages (20/50/100/200-day EMAs) on the daily chart.
The BSE Sensex followed the same trajectory, opening on a negative trend at 85,347.4, down -285.28 points from the previous close of 85,632.68. It closed at 85,231.92, down -400.76 points, or 0.47%. Both indices showed high momentum, with RSI values for the Nifty 50 at 61.95 and the Sensex at 63.38, below the overbought threshold of 70. The market witnessed selling pressure on Friday and ended near the day’s low.
Most of the indices ended in red on Friday. The only index that ended in green was the Nifty FMCG index, which was the major gainer, rising 0.1% or 78 points and standing at 55,504.7. Stocks such as Tata Consumer Products Ltd rose 0.8%, followed by United Spirits Ltd and ITC Ltd, which increased by up to 0.8% on Friday.
On the other hand, the Nifty Metal index was the major loser, falling -2.3% or -243.5 points, and standing at 10,142.55. Stocks such as Hindustan Copper Ltd fell -4%, followed by Lloyds Metals & Energy Ltd and Steel Authority of India Ltd, which decreased by up to 3.2% on Friday. The Nifty India Defence index was also among the biggest losers, falling -2.2% or -180.45 points, and standing at 8,116.4.
Stocks such as Dynamatic Technologies Ltd were down -5.5% on Friday. While other defence stocks like Garden Reach Shipbuilders, Paras Defence, and MTAR Technologies also decreased by up to -3.6%. The Nifty Realty index was also among the top losers, falling -1.9% or -17.2 points, and standing at 905.6.
Asian markets had a negative sentiment on Friday. Japan’s Nikkei 225 decreased by -1,198.06 points or -2.4%, closing at 48,625.88. While China’s Shanghai Composite decreased by -96.16 points, or -2.45%, to 3,834.89. Hong Kong’s Hang Seng Index decreased by -615.55 points, or -2.38%, to close at 25,220.02. South Korea’s KOSPI fell by -151.59 points or -3.79%, closing at 3,853.26.
At 4:19 p.m. IST, U.S. Dow Jones Futures were up, increasing 0.24% or 110 points, at 45,935. This week, the broad indices Nifty 50 and Sensex rose by 0.39% and 0.5%, respectively. India’s demat accounts surge to a record 21 crore amid an IPO boom.
India VIX
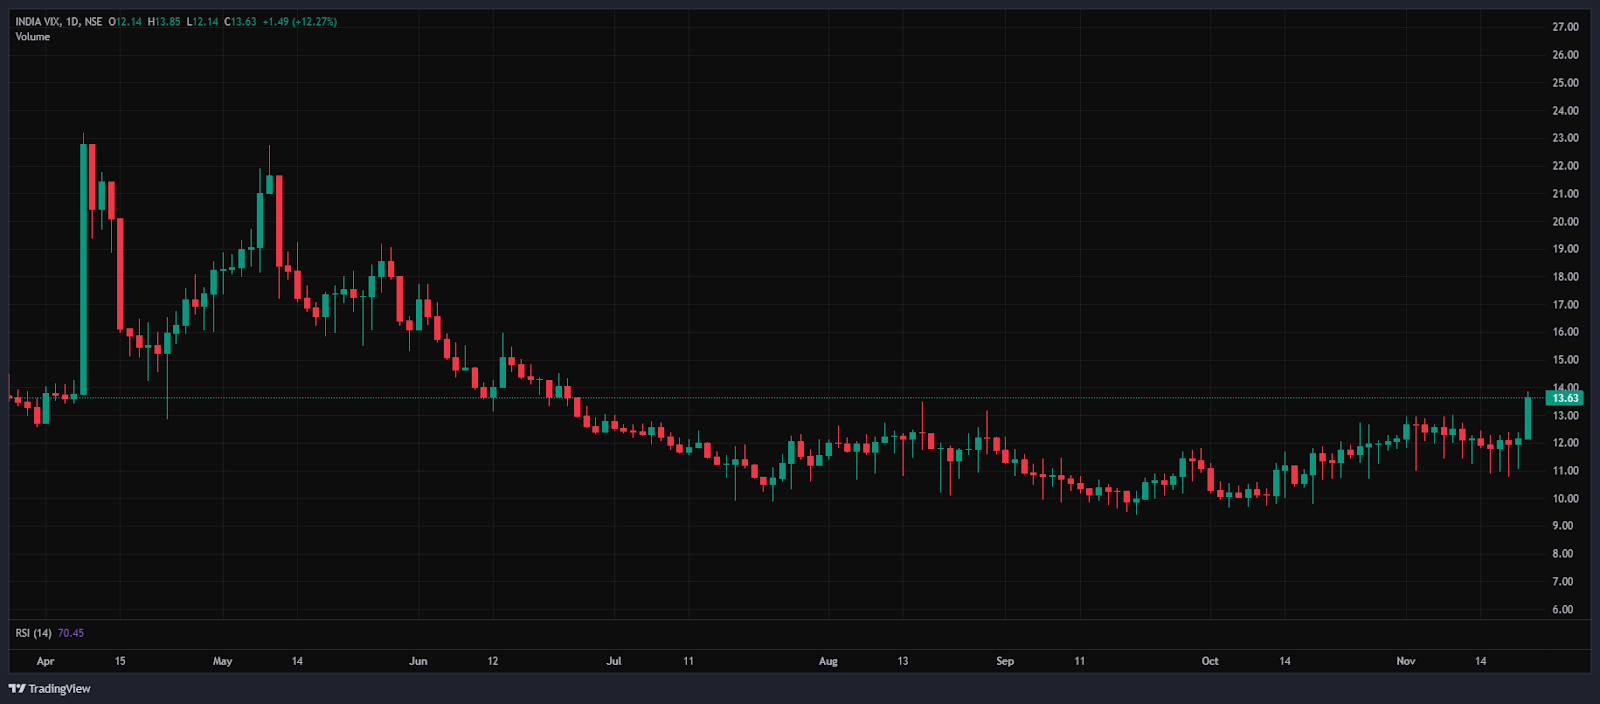
The India VIX rose 1.49 points (12.32%) from 12.14 to 13.63 during Friday session, indicating a big uptick in expected market volatility. However, overall volatility remains low, since the India VIX is generally considered elevated only when it rises above 15.
Given the ongoing volatility and mixed sentiments, it’s advisable to avoid aggressive positions and wait for clear directional moves above resistance or below support. Traders should consider these key support and resistance levels when entering long or short positions following the price break from these critical levels. Additionally, traders can combine moving averages to identify more accurate entry and exit points.
Disclaimer

The views and investment tips expressed by investment experts/broking houses/rating agencies on tradebrains.in are their own, and not that of the website or its management. Investing in equities poses a risk of financial losses. Investors must therefore exercise due caution while investing or trading in stocks. Trade Brains Technologies Private Limited or the author are not liable for any losses caused as a result of the decision based on this article. Please consult your investment advisor before investing.
About: Trade Brains Portal is a stock analysis platform. Its trade name is Dailyraven Technologies Private Limited, and its SEBI-registered research analyst registration number is INH000015729.
Investments in securities are subject to market risks. Read all the related documents carefully before investing.
Registration granted by SEBI and certification from NISM in no way guarantee performance of the intermediary or provide any assurance of returns to investors.
