The domestic equity market began the week on a cautious note, with the major benchmark indices opening higher but losing momentum as the session progressed. Despite trading above key moving averages and showing healthy strength on technical indicators, both the Nifty 50 and the Sensex slipped into negative territory by the close, reflecting broad-based selling pressure and a shift in sentiment toward the latter half of the day.
Most sectoral indices ended lower, indicating widespread weakness across the market. Information technology was the only notable outperformer, supported by gains in select heavyweight stocks. In contrast, realty, defence, and public sector enterprises were among the most pressured sectors, witnessing pronounced declines. Sentiment across Asian markets was mixed as well, contributing to the cautious trading environment.
In this overview, we will analyse the key technical levels and trend directions for Nifty and BSE Sensex to monitor in the upcoming trading sessions. All the charts mentioned below are based on the 15-minute timeframe.
NIFTY 50 Chart & Price Action Analysis
To view other technical reports, click here
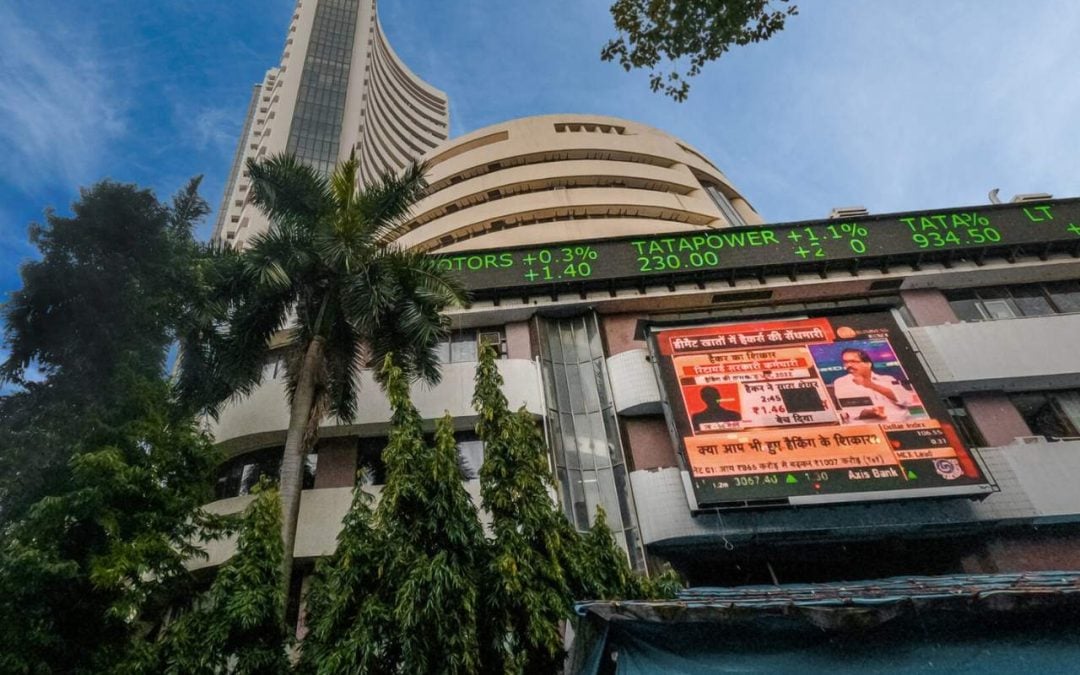
The Nifty 50 Index opened on a positive note at 26,122.8 on Monday, up by 54.65 points from Friday’s closing of 26,068.15. The index opened on a positive note but traded in a slightly bearish and range-bound trend during the morning session, remaining above the 26,000 level. The Index was trading within the range of 26,070 and 26,120.
In the afternoon session, the index continued to fall further and reached its low at 25,912.15 and settled below the 26,000 level, ending the session on a bearish note. The Nifty index had reached a day’s high at 26,142.80 and saw a day’s low at 25,912.15. Finally, it had closed at 25,959.5, in the red, below the 26,000 level, down 108.65 points, or 0.42%. In the short term, the Index was above the 13/20 day EMA in the daily time frame.
The Nifty 50’s nearest resistance level is at 26,085 (R1), the next one at 26,170.20 (R2), the level where the index has failed to sustain above multiple times in the short term, and its next resistance is at 26,246.65 (R3), which is the 52-week high for the index. On the other hand, the closest support is now at 25,855 (S1), where the index has taken support previously at this level multiple times. If the index falls below this, the next strong support level to watch is at 25,740 (S2).
Trade Setup:
| Nifty 50 | |
| Resistance 3 | 26,246.65 |
| Resistance 2 | 26,170.20 |
| Resistance 1 | 26,085.00 |
| Closing Price | 25,959.50 |
| Support 1 | 25,855.00 |
| Support 2 | 25,740.00 |
NIFTY 50 Momentum Indicators Analysis
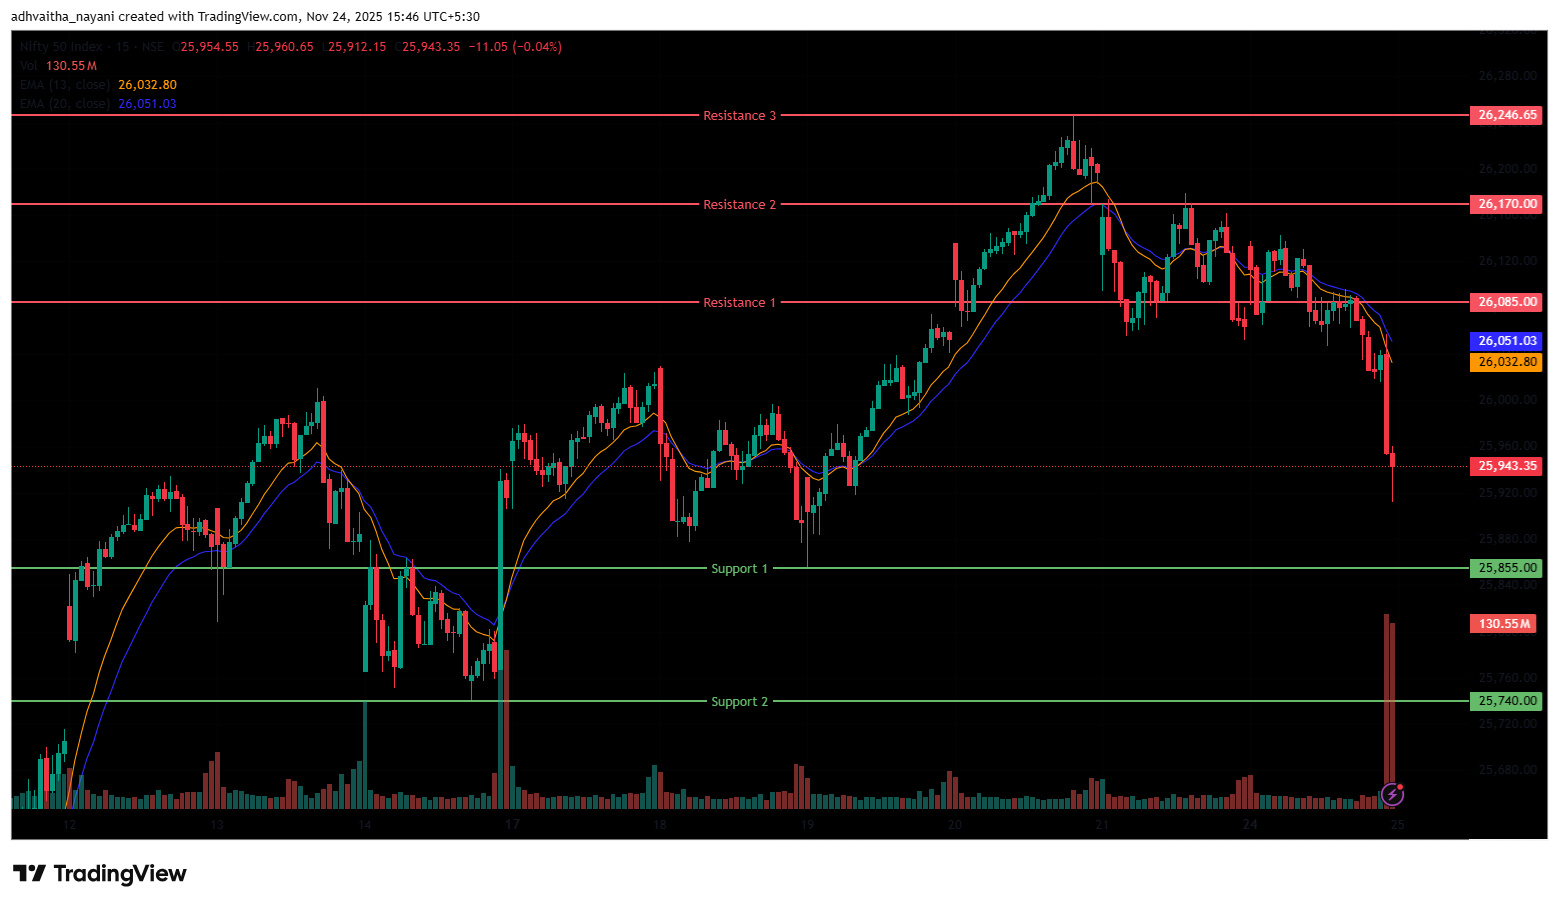
RSI (Daily): The Nifty 50’s RSI stood at 57.38, which is below the overbought zone of 70, indicating room to grow higher.
Bollinger Bands (Daily): The index is trading in the upper band of the Bollinger Band range (Simple Moving Average). Its position in the upper range suggests a bullish sentiment in the short term, but in Monday’s session, the Index formed a bearish candle with small wicks on both ends and ended on a bearish note. The index took support near 26,075, but could not sustain above the 26,000 level. A sustained move above the middle band signals a bullish sentiment, while a drop back toward the lower band may reinforce bearish sentiment.
Volume Analysis: Monday’s trading session had an above-average volume of 464.66 Mn.
Derivatives Data: Options open interest (OI) data suggest a strong support zone around 25,900 and 25,700, where put option writing is high, indicating traders expect the index to hold these levels. On the upside, significant call option open interest at 26,000 and 26,100 signals resistance, as sellers are likely to defend these strike prices. The Put/Call Ratio (PCR) stands at 0.65, which is below 1 and indicates a mild bullish sentiment with more call activity than puts. However, the presence of long unwinding, where traders are closing out long positions, adds selling pressure, making the overall outlook mixed. This combination implies the market may trade in a range, with strong support near 25,900-25,700 and resistance near 26,000-26,100, until a decisive breakout occurs.
Bank Nifty Chart & Price Action Analysis
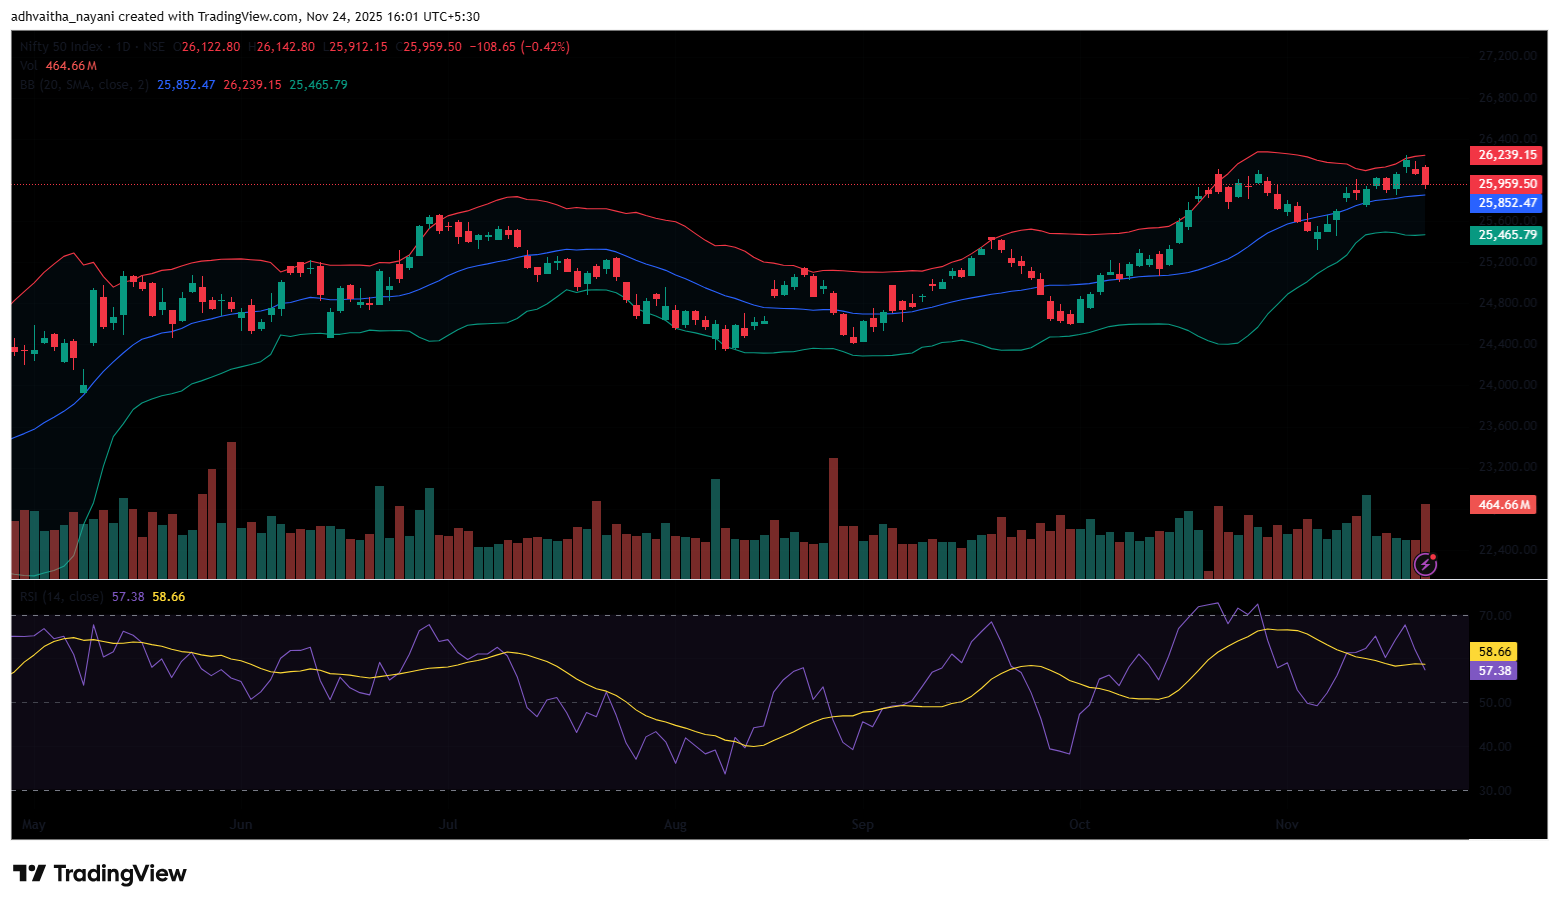
The Bank Nifty Index also opened on a positive note at 58,996.9, near the 59,000 level, on Monday, which was up by 129.2 points from Friday’s closing of 58,867.7. During the morning session, the index was trading in an uptrend, within the range of 58,950 and 59,280, following a stronger opening. However, in the afternoon session, the index continued to decline and reached the day’s low at the 58,649.50 level.
It traded in the range of 58,700 and 59,200, ending the day near the 58,800 mark. The Bank Nifty index had peaked at 59,309.9 and made a day’s low at 58,649.5. Finally, it had closed on a bearish-to-flat note at 58,835.35, ending near the 58,800 level, losing 32.35 points or 0.05%. The Relative Strength Index (RSI) stood at 63.05, below the overbought zone of 70 in the daily time frame. In the short term, the Index was above the 13/20 day EMA in the daily time frame.
The nearest resistance is at 59,155 (R1), whereas a higher resistance level is at 59,440.10 (R2), which is the all-time high for the index. On the other hand, the closest support is now at 58,610 (S1), which was the previous resistance level but has turned into support. If the index falls below this, the next major support level to watch is at 58,115 (S2).
Trade Setup:
| Bank Nifty | |
| Resistance 2 | 59,440.10 |
| Resistance 1 | 59,155.00 |
| Closing Price | 58,835.35 |
| Support 1 | 58,610.00 |
| Support 2 | 58,115.00 |
BSE Sensex Chart & Price Action Analysis
To view other technical reports, click here
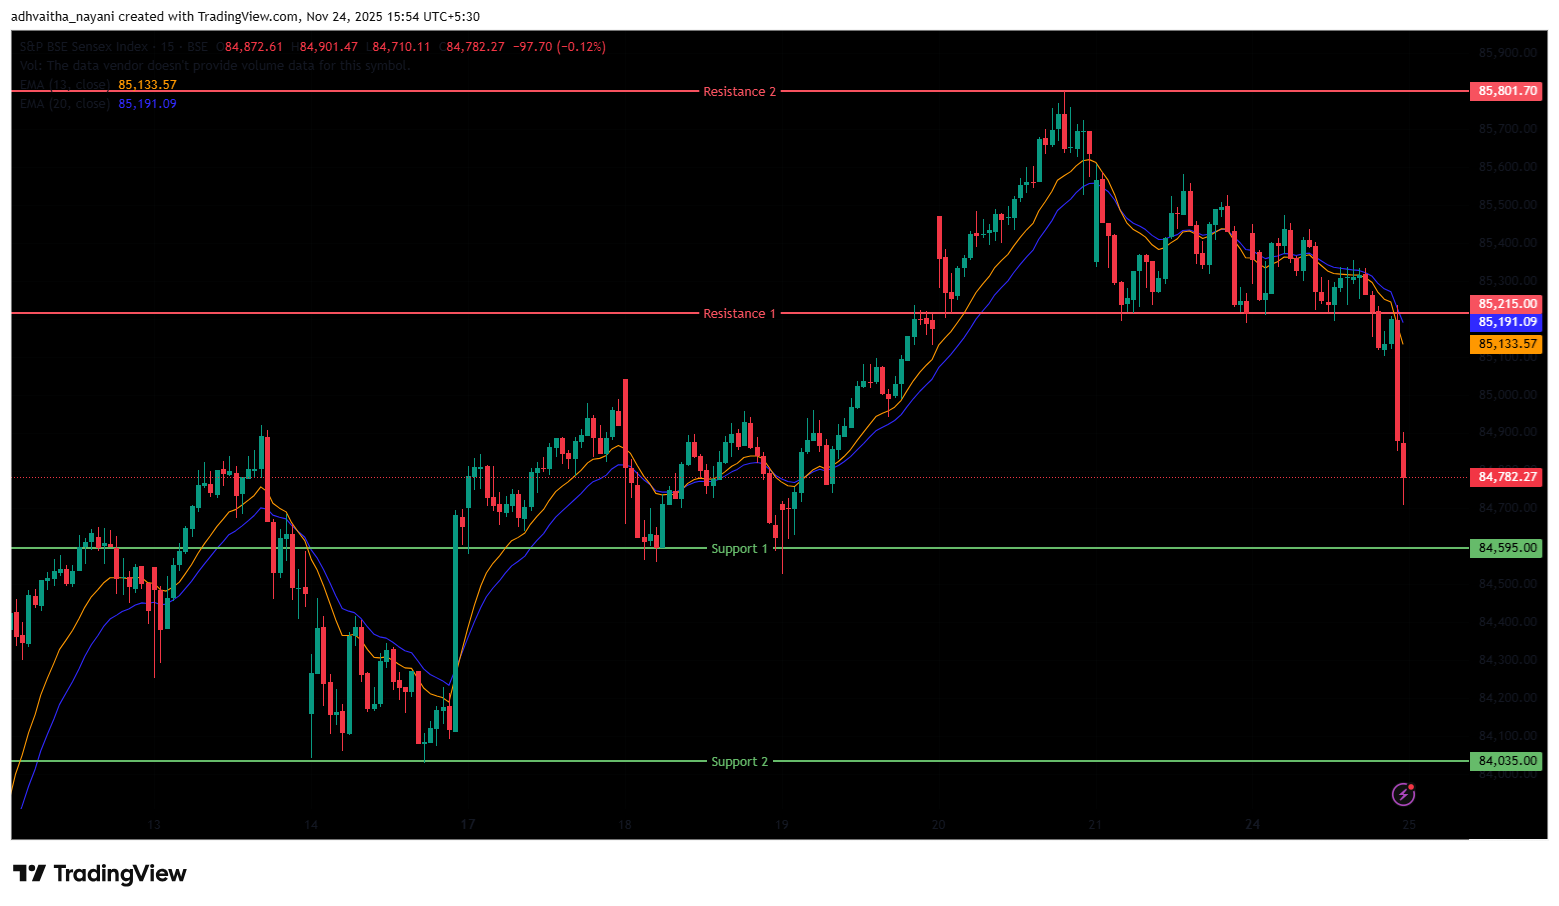
The BSE Sensex Index also opened on a positive note at 85,320.04 on Monday, up by 88.12 points from Friday’s closing of 85,231.92. The Sensex index, though opening on an optimistic note, traded in a range-bound manner during the morning session, mirroring the Nifty 50. It traded in the range of 85,300 and 85,450 during the morning session. In the afternoon session, the index plunged as low as 84,710.11, marking its day’s low and settling near the 84,900 level. The Index was trading between the range of 84,750 and 85,350 during the afternoon session.
The BSE Sensex index had peaked at 85,473.47 and made a day’s low at 84,710.11. Finally, it had closed at 84,900.71 in red, losing 331.21 points or 0.39%. The Relative Strength Index (RSI) stood at 58.94, below the overbought zone of 70 in the daily time frame. In the short term, the Index was above the 13/20 day EMA in the daily time frame, indicating an uptrend.
The index faces immediate resistance at 85,215 (R1), whereas the next resistance is at 85,801.70 (R2), a level near its 52-week high. On the downside, support lies at 84,595 (S1), where the index has taken support previously. Whereas the next support level (S2) is at 84,035.
Trade Setup:
| Sensex | |
| Resistance 2 | 85,801.70 |
| Resistance 1 | 85,215.00 |
| Closing Price | 84,900.70 |
| Support 1 | 84,595.00 |
| Support 2 | 84,035.00 |
Market Recap on November 24th, 2025
On Monday, the Nifty 50 opened slightly higher at 26,122.8, up by 54.65 points from its previous close of 26,068.15. The index hit an intraday high of 26,142.8 and closed below the 26,000 level at 25,959.5, down -108.65 points, or 0.42%. The index closed above all key moving averages (20/50/100/200-day EMAs) on the daily chart.
The BSE Sensex followed the same trajectory, opening on a positive trend at 85,320.04, up 88.12 points from the previous close of 85,231.92. It closed at 84,900.71, down -331.21 points, or 0.39%. Both indices showed high momentum, with RSI values for the Nifty 50 at 57.38 and the Sensex at 58.94, below the overbought threshold of 70. The market witnessed selling pressure on Monday and ended near the day’s low.
Most of the indices ended in red on Monday. The only index that ended in green was the Nifty IT index, which was the major gainer, rising 0.41% or 152.6 points, and standing at 37,037.95. Stocks such as Tech Mahindra Ltd. rose 2.3%, followed by Persistent Systems Ltd. and Wipro Ltd., which increased by up to 1.2% on Monday.
On the other hand, the Nifty Realty index was the major loser, falling -2.05% or -18.60 points, and standing at 887. Stocks such as Anant Raj Ltd fell -6.50%, followed by Prestige Estates and Brigade Enterprises Ltd, which decreased by up to 3.39% on Monday. The Nifty India Defence index was also among the biggest losers, falling -2.50% or -203.60 points, and standing at 7,912.80.
Stocks such as Mishra Dhatu Nigam Ltd were down -5.4% on Monday. While other defence stocks like BEML, Cyient DLM Ltd, and Astra Microwave Products also decreased by up to -4.2%. The Nifty PSE index was also among the top losers, falling -1.42% or -140.35 points, and standing at 9,726.7.
Asian markets had a mixed sentiment on Monday. Thailand’s SET Composite decreased by -1.67 points or -0.13%, closing at 1,252.73. While China’s Shanghai Composite increased by 1.88 points, or 0.05%, to 3,836.77. Hong Kong’s Hang Seng Index increased by 433.98 points, or 1.69%, to close at 25,654.00. South Korea’s KOSPI fell by -7.20 points or -0.19%, closing at 3,846.06.
India VIX
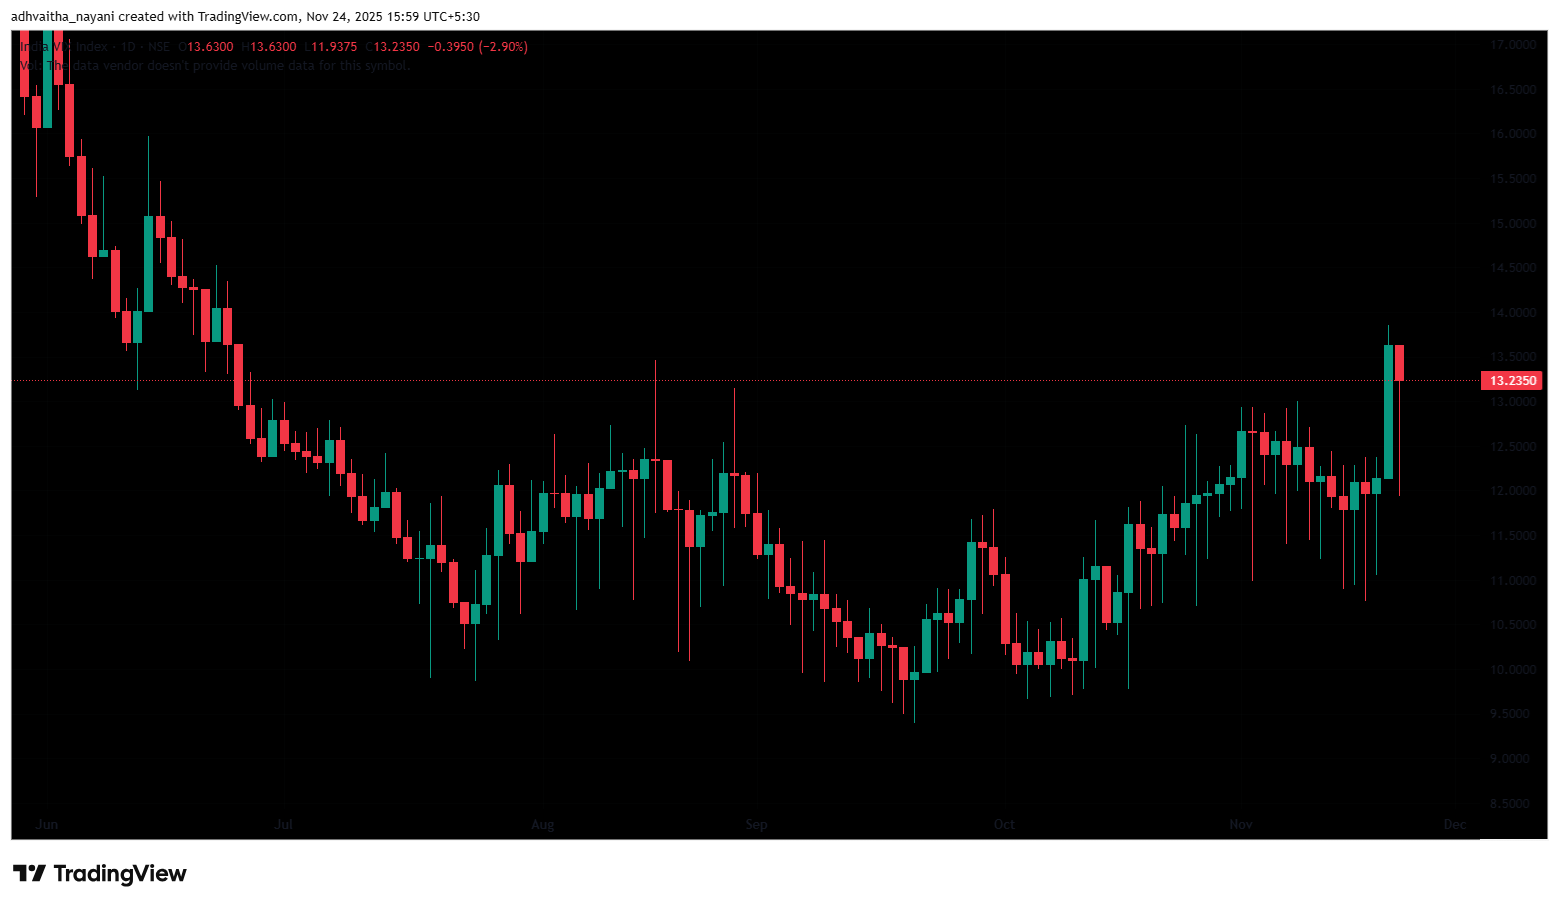
The India VIX fell 0.40 points (2.90%) from 13.63 to 13.24 during the Monday session, indicating a small downtrend in expected market volatility. However, overall volatility remains low, since the India VIX is generally considered elevated only when it rises above 15.
Given the ongoing volatility and mixed sentiments, it’s advisable to avoid aggressive positions and wait for clear directional moves above resistance or below support. Traders should consider these key support and resistance levels when entering long or short positions following the price break from these critical levels. Additionally, traders can combine moving averages to identify more accurate entry and exit points.
Disclaimer

The views and investment tips expressed by investment experts/broking houses/rating agencies on tradebrains.in are their own, and not that of the website or its management. Investing in equities poses a risk of financial losses. Investors must therefore exercise due caution while investing or trading in stocks. Trade Brains Technologies Private Limited or the author are not liable for any losses caused as a result of the decision based on this article. Please consult your investment advisor before investing.
About: Trade Brains Portal is a stock analysis platform. Its trade name is Dailyraven Technologies Private Limited, and its SEBI-registered research analyst registration number is INH000015729.
Investments in securities are subject to market risks. Read all the related documents carefully before investing.
Registration granted by SEBI and certification from NISM in no way guarantee performance of the intermediary or provide any assurance of returns to investors.
