
Indian equity markets opened on a weak note on Wednesday, extending their losing streak for the fourth consecutive session amid heightened volatility and subdued investor sentiment. Both the Nifty 50 and BSE Sensex declined throughout the day, reflecting a broader bearish trend, although they managed to hold above key technical support levels like their short- and long-term exponential moving averages. Despite moderate momentum indicated by technical signals such as the RSI, key indices across sectors faced selling pressure, particularly in banking, auto, realty, and energy stocks.

However, a few pockets of resilience emerged, with selective buying seen in public sector enterprises and FMCG stocks. Sectoral indices such as CPSE and FMCG closed in positive territory, supported by gains in companies like Power Grid, ONGC, and Hindustan Unilever. In contrast, realty and auto stocks underperformed sharply, dragging the broader market down. Global cues remained mixed, with most Asian markets ending higher, while sentiment in U.S. futures pointed to a mildly positive start.

In this overview, we will analyse the key technical levels and trend directions for Nifty and BSE Sensex to monitor in the upcoming trading sessions. All the charts mentioned below are based on the 5-minute timeframe.
Nifty 50
(In this analysis, we have used 20/50/100/200 EMAs, where 20 EMA (Red), 50 EMA (Orange), 100 EMA (Light Blue), and 200 EMA (Dark Blue)).
To view other technical reports, click here
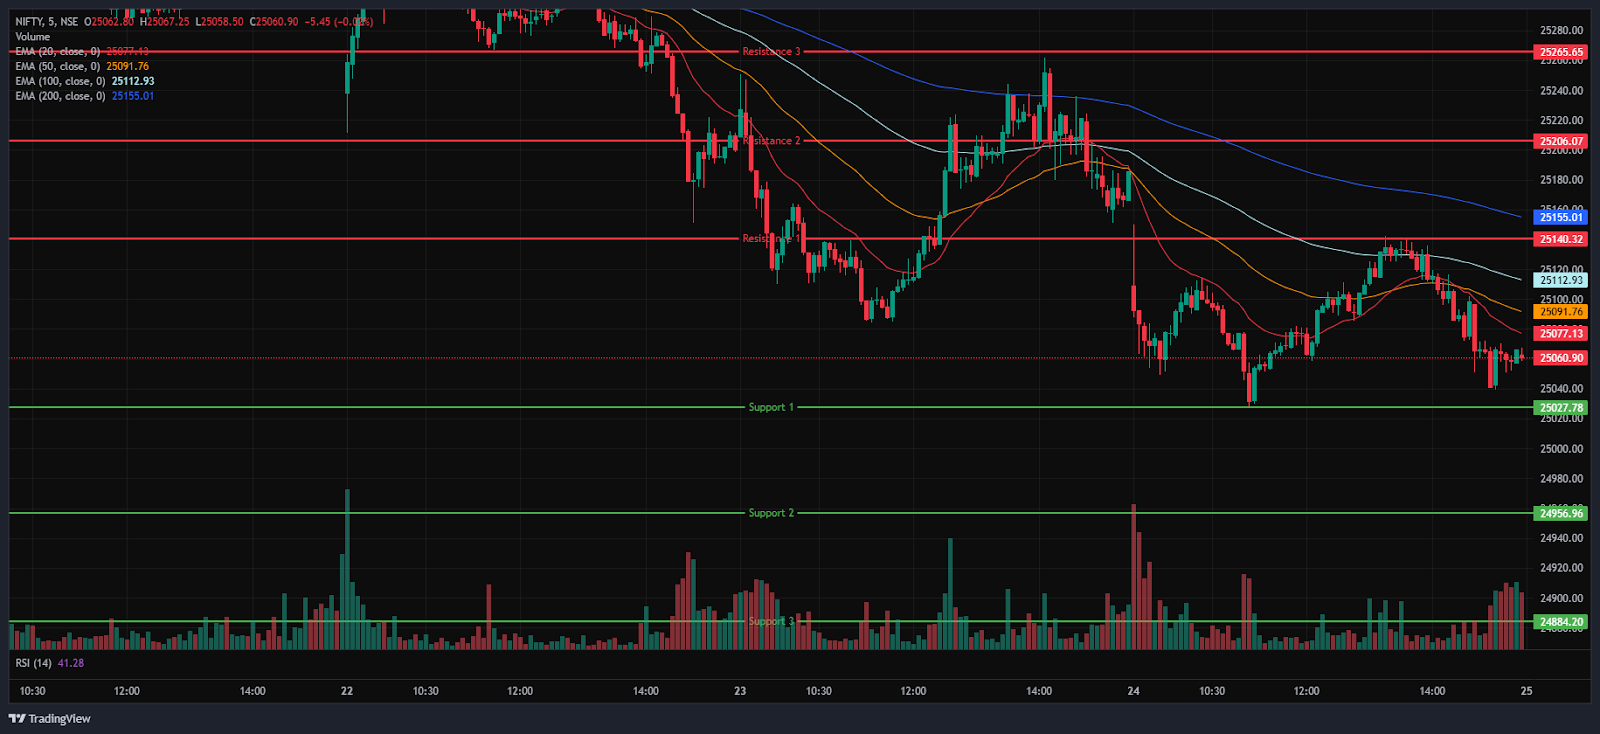
The Nifty 50 Index opened on a negative note at 25,108.75 on Wednesday, down by 60.75 points from Tuesday’s closing of 25,169.50. With a bearish start to the day, the index had a volatile morning session, trading between 25,000 to 25,150 range. Additionally, the Index stood below all four EMAs of 20/50/100/200 in the 15-minute time frame during the morning session.
The index surged as high as the 25,142 mark in the afternoon session, recovered from the day’s low but did not sustain the mark and fell to the 25,060 level and was traded below its opening level, between the range of 25,000 and 25,100. During the afternoon session, the Nifty 50 traded below all four EMAs of 20/50/100/200 in the 15-minute time frame. Nifty’s immediate resistance levels are R1 (25,140), R2 (25,206), and R3 (25,266), while immediate support levels are S1 (25,028), S2 (24,957), and S3 (24,884).
The Nifty index had reached a day’s high at 25,149.85 and saw a day’s low at 25,027.45. Finally, it had closed at 25,056.90, in red below the 25,100 level, losing 112.60 points, or 0.45%. The Nifty 50 closed above all four EMAs of 20/50/100/200 EMAs in the daily time frame.
Momentum Indicators
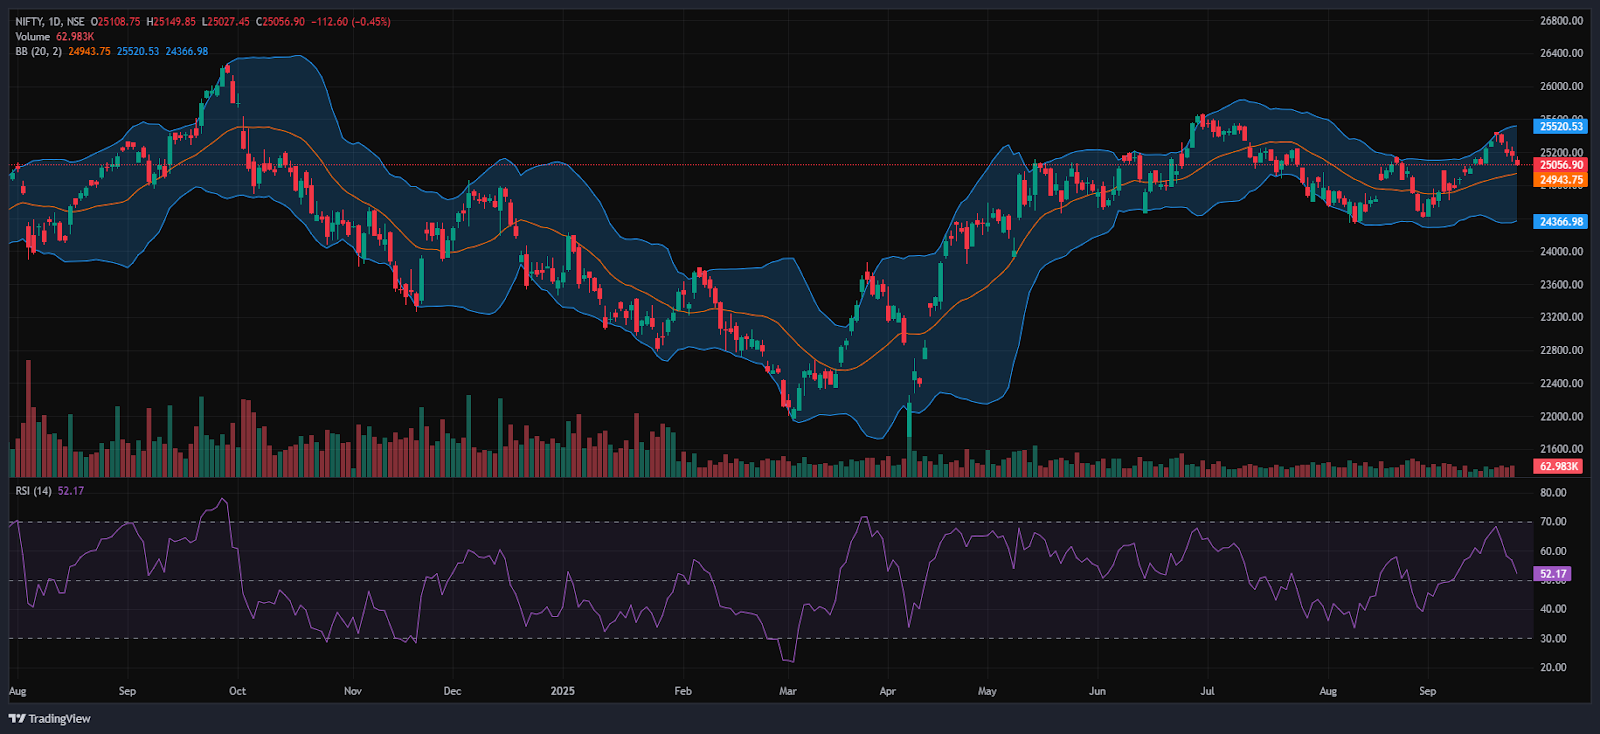
RSI (Daily): The Nifty 50’s RSI stood at 52.17, which is well below the overbought zone of 70, indicating a neutral sentiment.
Bollinger Bands (Daily): The index is trading in the upper band of its Bollinger Band range above the middle band (Simple Moving Average). Its position in the upper range, along with solid support around the 25,000 level in Wednesday’s session. A sustained move above the middle band signals a bullish sentiment, while a drop back toward the lower band may reinforce bearish sentiment.
Volume Analysis: Wednesday’s trading session had average volumes, which stood at 244.38 Mn.
Derivatives Data: Options OI indicates strong Put writing at 25,000, following 24,900, establishing it as a firm support zone. On the upside, a significant Call OI buildup at 25,100 and 25,200 suggests a potential resistance supply. PCR (Put/Call Ratio) stands at 0.7835 (<1), leaning towards bullish sentiment and the Short Buildup signals a price to fall, with an overall mixed outlook for the next trading session.
Bank Nifty
(In this analysis, we have used 20/50/100/200 EMAs, where 20 EMA (Red), 50 EMA (Orange), 100 EMA (Light Blue), and 200 EMA (Dark Blue)).
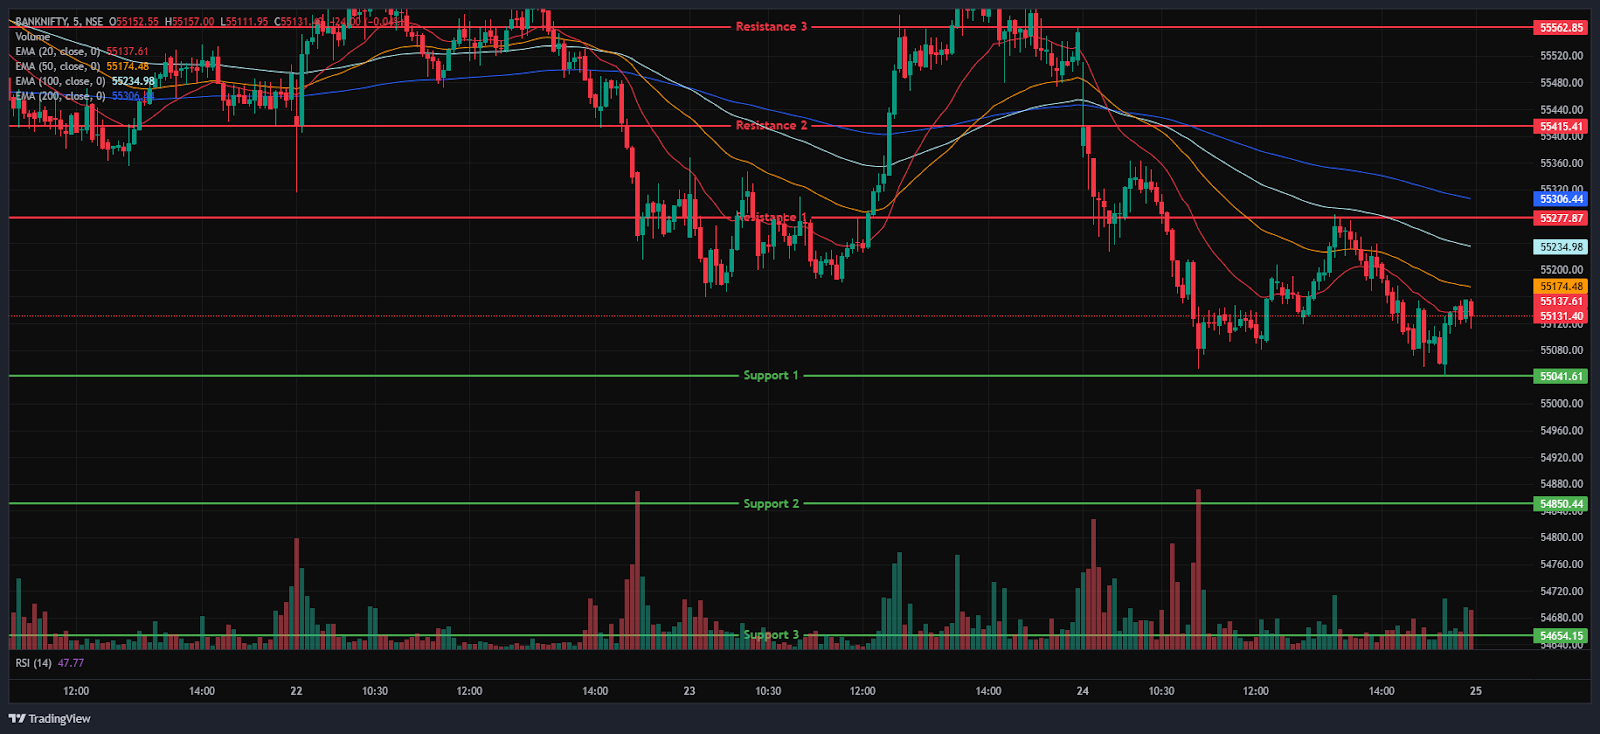
The Bank Nifty Index also started the session on a negative note at 55,387.10 on Wednesday, down by 122.65 points from Tuesday’s closing of 55,509.75. The index was trading between the range of 55,000 and 55,500 in the morning session, indicating higher volatility. In addition, the index was trading below all four EMAs of 20/50/100/200 in the 15-minute time frame.
In the afternoon session, the Index recovered from the low to the 55,284 level but did not sustain the recovery and fell again, marking its day low at the 55,040 level and was traded around the range of 55,000 and 55,300, ending in green. During the afternoon session, Bank Nifty closed below all four EMAs of 20/50/100/200 in the 15-minute time frame. Bank Nifty immediate resistance levels are R1 (55,278), R2 (55,415), and R3 (55,563), while immediate support levels are S1 (55,042), S2 (54,850), and S3 (54,654).
The Bank Nifty index had peaked at 55,511.10 and made a day’s low at 55,040.45. Finally, it had closed in red at 55,121.50, closing below the 55,200 level, losing 388.25 points or 0.70%. The Relative Strength Index (RSI) stood at 51.03 well below the overbought zone of 70 in the daily time frame, and Bank Nifty closed above the EMAs of 20/100/200 but below the 50 EMA in the daily time frame.
Sensex
(In this analysis, we have used 20/50/100/200 EMAs, where 20 EMA (Red), 50 EMA (Orange), 100 EMA (Light Blue), and 200 EMA (Dark Blue)).
To view other technical reports, click here
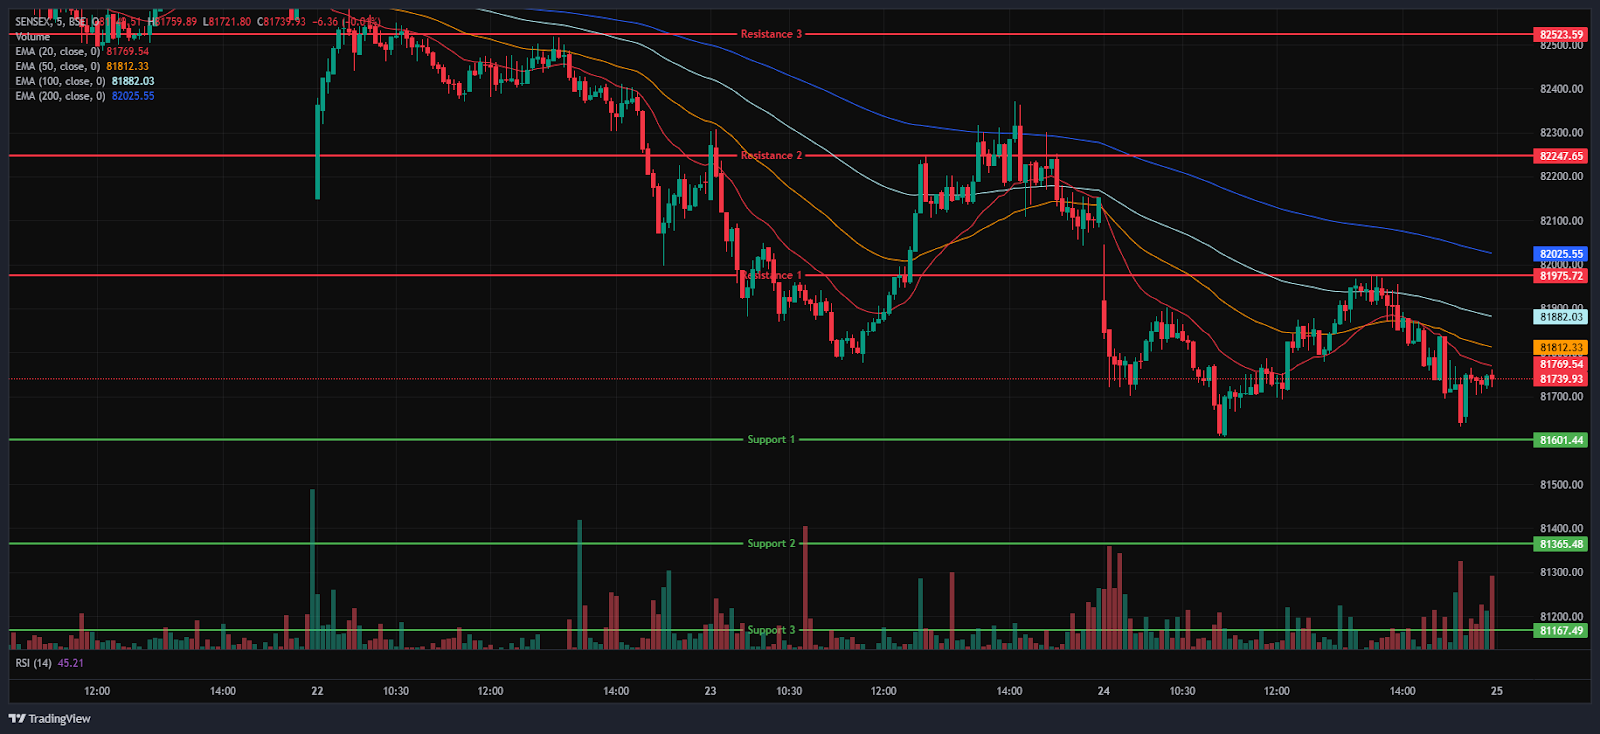
The BSE Sensex Index also opened on a negative note at 81,917.65 on Wednesday, down by 184.45 points from Tuesday’s closing of 82,102.10. The index started its session on a gap-down note and was trading between 81,600 to 82,000 range throughout the morning session’s 15-minute time frame, below all four EMAs of the 20/50/100/200.
In the afternoon session, the Index recovered from the day’s low to the 81,977 level but did not sustain the recovery and fell again to the 81,740 level and was trading between the 82,600 and 82,000 levels, maintaining its overall bearish trend and closing below all four EMAs of 20/50/100/200 in the 15-minute time frame. BSE Sensex immediate resistance levels are R1 (81,976), R2 (82,248), and R3 (82,524), while immediate support levels are S1 (81,601), S2 (81,365), and S3 (81,167).
The BSE Sensex index had peaked at 82,045.47 and made a day’s low at 81,607.84. Finally, it closed at 81,715.63 in red, losing 386.47 points or 0.47%. The Relative Strength Index (RSI) stood at 51.01 (below the overbought zone of 70) in the daily time frame, and the BSE Sensex closed above the EMAs of 50/100/200 but below the 20 EMA in the daily time frame.
India VIX
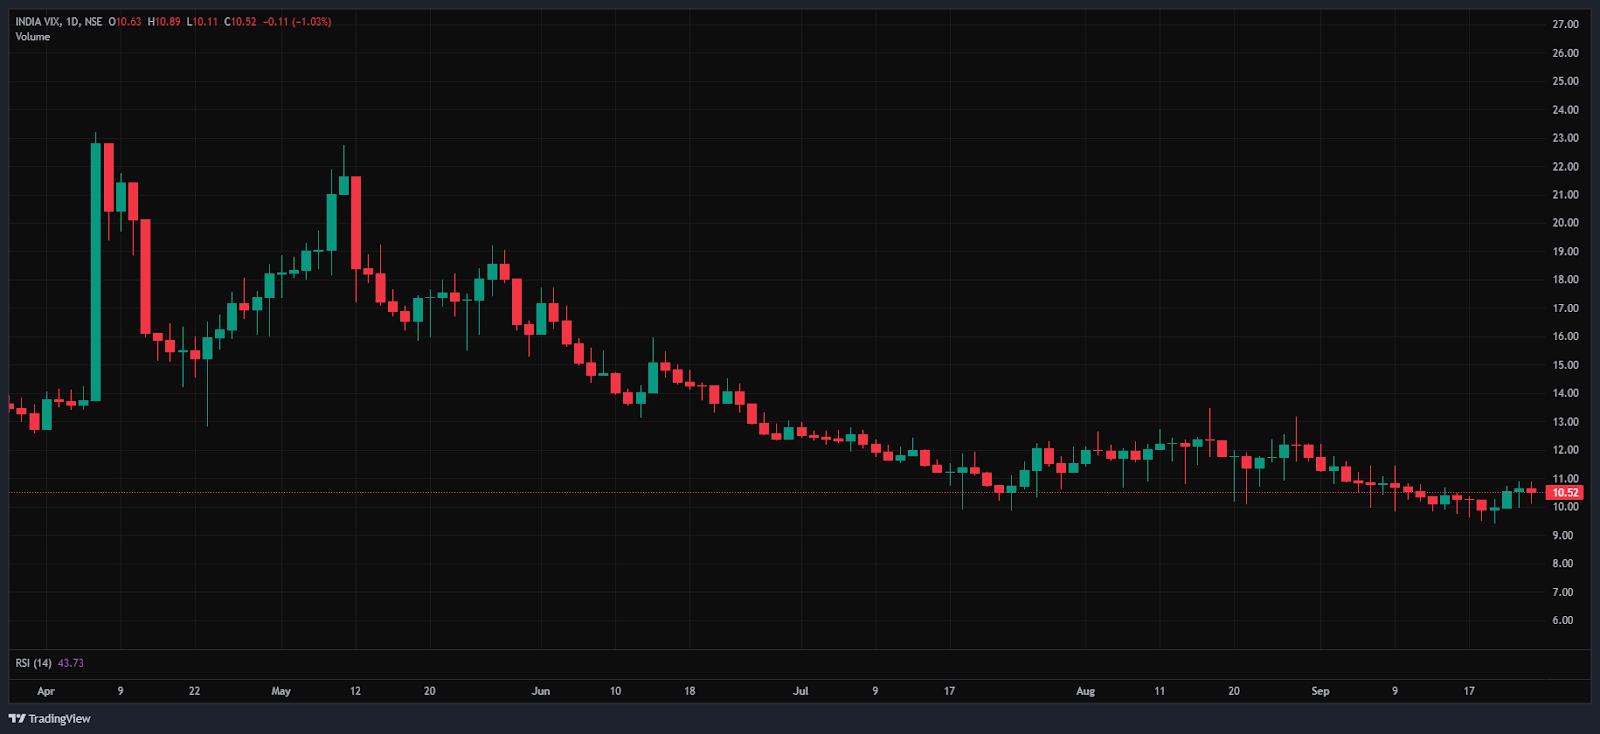
The India VIX decreased by 0.10 points or 0.96%, from 10.62 to 10.52 during Wednesday’s session. A decrease in the India VIX typically indicates lower price volatility in the stock market, suggesting a more stable market environment. However, a stable market environment and minimal volatility are anticipated when the India vix is below 15.
Market Recap on the 24th of September 2025
The Nifty 50 opened Wednesday’s session on a weak footing, starting at 25,108.75, a decline of -60.75 points from its previous close of 25,169.5. During the day, it touched an intraday low of 25,027.45 before ending the session at 25,056.9, marking a loss of -112.6 points, or -0.45%. Despite the downward movement, the index continued to trade above its 20, 50, 100, and 200-day exponential moving averages. The BSE Sensex followed a similar bearish pattern, opening lower at 81,917.65 (a dip of -184.45 points) and closing at 81,715.63, down by -386.47 points, or -0.47%.
Technical indicators reflected moderate momentum, with the RSI at 52.17 for Nifty and 51.01 for Sensex, both levels remaining well below the overbought mark of 70. The Bank Nifty also ended in negative territory, falling by -388.25 points, or -0.70%, to settle at 55,121.5. This marked the fourth straight session of declines across broader indices, driven by high volatility and weak investor sentiment.
Most indices ended the day in red, with only a few sectoral gainers. Leading the gainers was the Nifty CPSE Index, which rose by 13 points, or 0.20%, to close at 6,526.6. Power Grid Corporation of India Ltd advanced by 1.63%, while other public sector entities such as NLC India Ltd, NTPC Ltd, and ONGC Ltd also witnessed gains of up to 1.5%.
The Nifty FMCG Index ended higher by 97.40 points, or 0.18%, closing at 55,378.95. Among notable contributors, Hindustan Unilever Ltd gained 1.08%, supported by positive moves in Tata Consumer Products Ltd, Nestle India Ltd, and United Spirits, which were up to 1.03%.
Conversely, the Nifty Realty Index emerged as the session’s worst performer, falling by -22.75 points, or -2.49%, to close at 890.6. Key laggards included Godrej Properties Ltd, which dropped -4.02%, along with DLF Ltd, Phoenix Mills Ltd, and Oberoi Realty Ltd, each shedding up to -3.4%.
The Nifty Auto Index also faced pressure, ending at 27,007.6, down by -314.35 points, or -1.15%. Companies such as Samvardhana Motherson International Ltd, Bharat Forge Ltd, and Balkrishna Industries Ltd registered losses of up to -3.7%. Meanwhile, the Nifty Energy Index ended lower at 35,506.70, a decline of -319.5 points, or -0.89%.
In the broader Asian markets, performance was largely mixed on Wednesday. Japan’s Nikkei 225 added 54.34 points, or 0.12%, to close at 45,548. China’s Shanghai Composite Index gained 31.81 points, or 0.83%, ending at 3,853.64. Hong Kong’s Hang Seng Index surged 424.88 points, or 1.60%, to finish at 26,584. However, South Korea’s KOSPI declined by -14.05 points, or -0.40%, closing at 3,472.14. As of 4:50 p.m. IST, U.S. Dow Jones Futures were trading higher by 65.27 points, or 0.14%, at 46,358.05.
Trade Setup Summary
The Nifty 50 opened on a negative note at 25,108.75 on Wednesday and ended the session in the red below the 25,100 level at 25,056.90. A break below 25,028 could trigger further selling towards 24,957 while breaking the next resistance level of 25,140 could trigger bullishness towards the 25,206 level.
Bank Nifty started the session on a negative note at 55,387.10 and ended the session in the red at 55,121.50, below the 55,200 level. A break below 55,042 could trigger further selling towards 54,850, while breaking the next resistance level of 55,278 could trigger bullishness towards the 55,415 level.
Sensex also opened on a negative note at 81,917.65 and ended the session in the red at 81,715.63, below the 81,800 level. A break below 81,601 could trigger further selling towards 81,365, while breaking the next resistance level of 81,976 could lead towards the 82,248 level.
Given the ongoing volatility and mixed sentiments, it’s advisable to avoid aggressive positions and wait for clear directional moves above resistance or below support. Traders should consider these key support and resistance levels when entering long or short positions following the price break from these critical levels. Additionally, traders can combine moving averages to identify more accurate entry and exit points.
Disclaimer

The views and investment tips expressed by investment experts/broking houses/rating agencies on tradebrains.in are their own, and not that of the website or its management. Investing in equities poses a risk of financial losses. Investors must therefore exercise due caution while investing or trading in stocks. Trade Brains Technologies Private Limited or the author are not liable for any losses caused as a result of the decision based on this article. Please consult your investment advisor before investing.
About: Trade Brains Portal is a stock analysis platform. Its trade name is Dailyraven Technologies Private Limited, and its SEBI-registered research analyst registration number is INH000015729.
Investments in securities are subject to market risks. Read all the related documents carefully before investing.
Registration granted by SEBI and certification from NISM in no way guarantee performance of the intermediary or provide any assurance of returns to investors.
