
Domestic equity benchmarks opened with a mildly positive bias on Tuesday but failed to sustain early gains as broader sentiment turned cautious. Despite holding above key moving averages, both the Nifty 50 and the Sensex slipped into negative territory by the close, reflecting subdued momentum. Market indicators such as the RSI suggested that the indices were trading within a neutral zone, signalling neither overheated conditions nor strong bullish conviction. The decline was largely influenced by mixed global cues, continued foreign investor selling, and heightened volatility ahead of the monthly derivatives expiry.
Sectoral performance was mixed, contributing to the uneven tone across the broader market. Realty, PSU banking, and mid-cap stocks showed resilience and attracted buying interest after recent weakness. In contrast, media, information technology, and consumer durables sectors faced pressure, dragging down overall sentiment. Meanwhile, most major Asian markets displayed a broadly positive undertone, though gains were not uniform across the region. This global backdrop, combined with domestic factors, shaped a trading session marked by cautious optimism and selective participation.
In this overview, we will analyse the key technical levels and trend directions for Nifty and BSE Sensex to monitor in the upcoming trading sessions. All the charts mentioned below are based on the 15-minute timeframe.
NIFTY 50 Chart & Price Action Analysis
To view other technical reports, click here
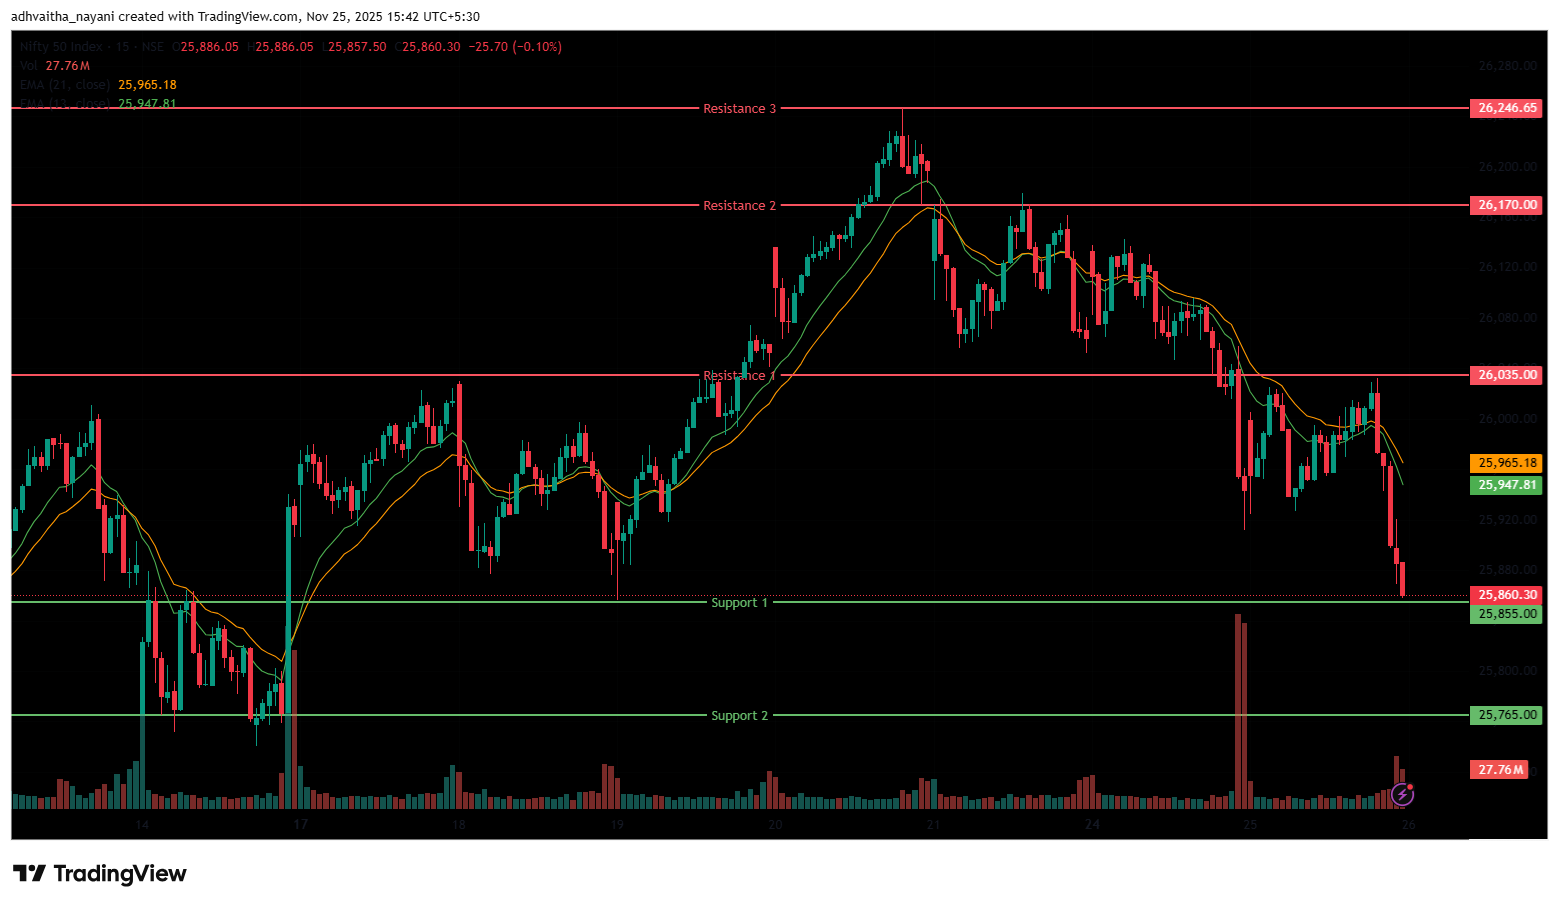
The Nifty 50 Index opened on a flat-to-positive note at 25,998.5 on Tuesday, up by 39 points from Monday’s closing of 25,959.5. The index opened on a positive note but traded in a range-bound trend during the morning session, hovering at the 26,000 level. The Index was trading within the range of 25,950 and 26,020. In the afternoon session, the index continued to fall further and reached its low at 25,857.50 and settled below the 25,900 level, ending the session on a bearish note for the third consecutive session.
The Nifty index had reached a day’s high at 26,032.60 and saw a day’s low at 25,857.50. Finally, it had closed at 25,884.8, in the red, down 74.7 points, or 0.29%. In the short term, the Index was above the 20-day EMA but fell below the 13-day EMA, indicating a near-term bearish trend in the daily time frame.
The Nifty 50’s nearest resistance level is at 26,035 (R1), the next one at 26,170.00 (R2), the level where the index has failed to sustain above multiple times in the short term, and its next resistance is at 26,246.65 (R3), which is the 52-week high for the index. On the other hand, the closest support is now at 25,855 (S1), where the index has taken support previously at this level multiple times. If the index falls below this, the next strong support level to watch is at 25,765 (S2).
Trade Setup:
| Nifty 50 | |
| Resistance 3 | 26,246.65 |
| Resistance 2 | 26,170.00 |
| Resistance 1 | 26,035.00 |
| Closing Price | 25,884.80 |
| Support 1 | 25,855.00 |
| Support 2 | 25,765.00 |
NIFTY 50 Momentum Indicators Analysis
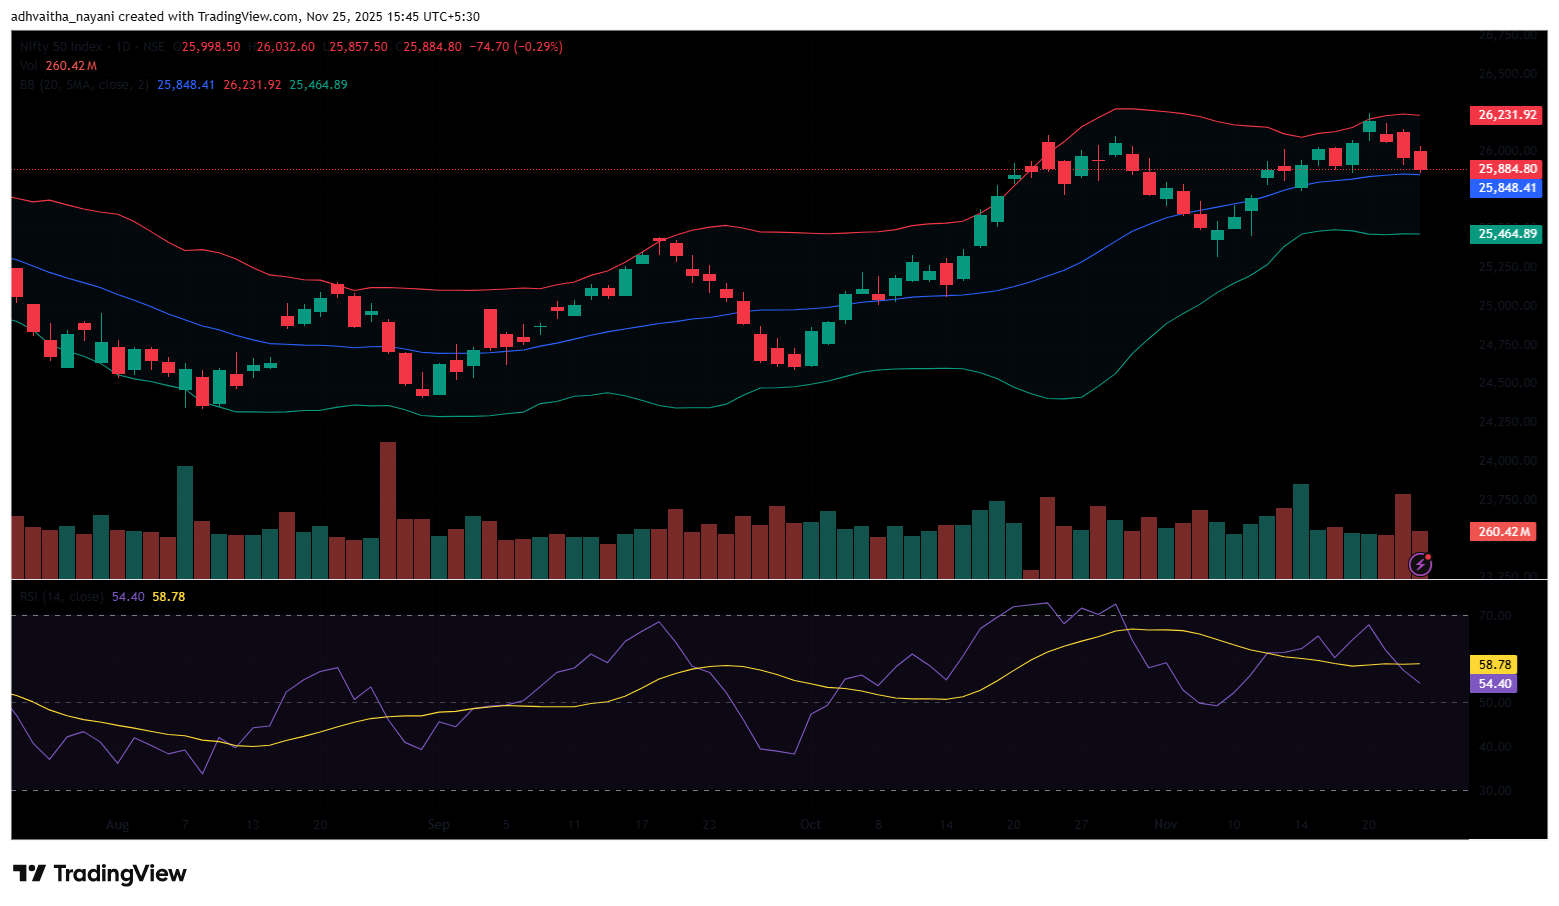
RSI (Daily): The Nifty 50’s RSI stood at 54.4, which is below the overbought zone of 70, indicating room to grow higher.
Bollinger Bands (Daily): The index is trading in the upper band of the Bollinger Band range, but nearing the middle band. Its position in the upper range suggests a bullish sentiment in the short term, but on Tuesday’s session, the Index formed a bearish candle with small wicks on both ends and ended on a bearish note, ending in red for the third consecutive session. The index took support near 25,940, but could not sustain above the 25,900 level. A sustained move above the middle band signals a bullish sentiment, while a drop back toward the lower band may reinforce bearish sentiment.
Volume Analysis: Tuesday’s trading session had an average volume of 260.45 Mn.
Derivatives Data: Options open interest (OI) data suggest a strong support zone around 25,850 and 25,800, where put option writing is high, indicating traders expect the index to hold these levels. On the upside, significant call option open interest at 25,900 and 26,000 signals resistance, as sellers are likely to defend these strike prices. The Put/Call Ratio (PCR) stands at 0.75, which is below 1 and indicates a mild bullish sentiment with more call activity than puts. However, the presence of long unwinding, where traders are closing out long positions, adds selling pressure, making the overall outlook mixed. This combination implies the market may trade in a range, with strong support near 25,850-25,800 and resistance near 25,900-26,000, until a decisive breakout occurs.
Bank Nifty Chart & Price Action Analysis
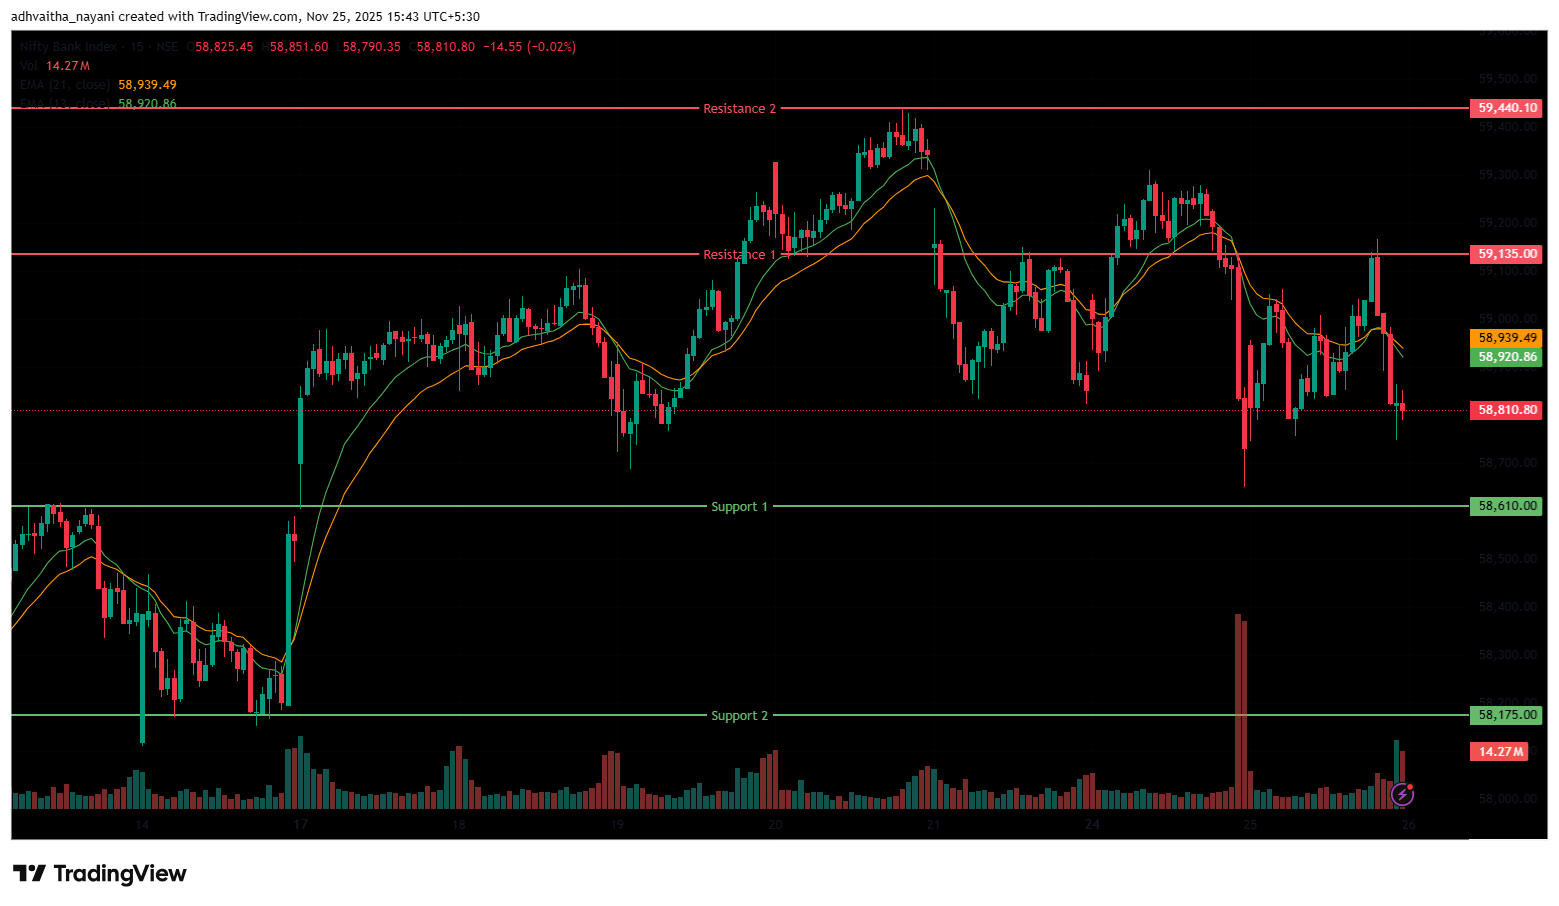
The Bank Nifty Index also opened on a flat-to-positive note at 58,925.65, below the 59,000 level, on Tuesday, but was up by 90.3 points from Monday’s closing of 58,835.35. During the morning session, the index was trading in a range-bound manner, within the levels of 58,800 and 59,000, following an optimistic opening. However, in the afternoon session, the index continued to decline and reached the day’s low at the 58,746.20 level.
It traded in the range of 58,800 and 59,100, ending the day near the 58,800 mark. The Bank Nifty index had peaked at 59,166.15 and made a day’s low at 58,746.20. Finally, it had closed on a bearish-to-flat note at 58,820.30, losing 15.05 points or 0.03%. The Relative Strength Index (RSI) stood at 62.73, below the overbought zone of 70 in the daily time frame. In the short term, the Index was above the 13/20 day EMA in the daily time frame.
The nearest resistance is at 59,135 (R1), whereas a higher resistance level is at 59,440.10 (R2), which is the all-time high for the index. On the other hand, the closest support is now at 58,610 (S1), which was the previous resistance level but has turned into support. If the index falls below this, the next major support level to watch is at 58,175 (S2).
Trade Setup:
| Bank Nifty | |
| Resistance 2 | 59,440.10 |
| Resistance 1 | 59,135.00 |
| Closing Price | 58,820.30 |
| Support 1 | 58,610.00 |
| Support 2 | 58,175.00 |
BSE Sensex Chart & Price Action Analysis
To view other technical reports, click here
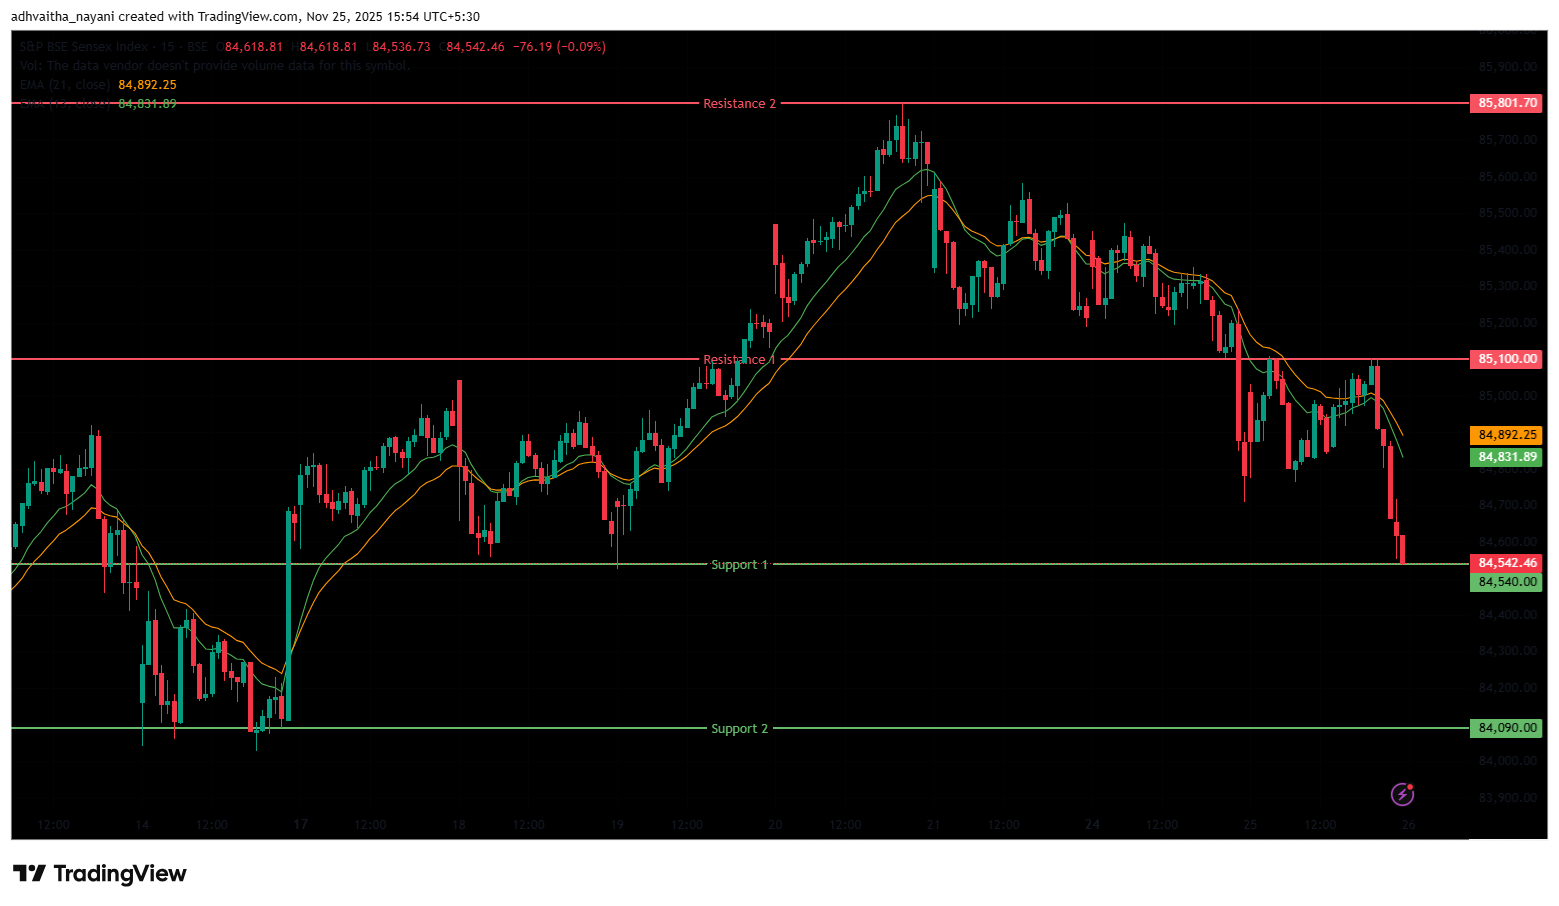
The BSE Sensex Index also opened on a similar note as the Nifty 50, opening at 85,008.93 on Tuesday, up by 108.22 points from Monday’s closing of 84,900.71. The Sensex index, though opening on an optimistic note, traded in a range-bound manner during the morning session. It traded in the range of 84,800 and 85,100 during the morning session. In the afternoon session, the index plunged as low as 84,536.73, marking its day’s low and settling below the 84,600 level.
The Index was trading between the range of 84,550 and 85,100 during the afternoon session. The BSE Sensex index had peaked at 85,110.24 and made a day’s low at 84,536.73. Finally, it had closed at 84,587.01 in red, losing 313.7 points or 0.37%. The Relative Strength Index (RSI) stood at 55.01, below the overbought zone of 70 in the daily time frame. In the short term, the Index was above the 20-day EMA but fell below the 13-day EMA, indicating a near-term bearish trend in the daily time frame.
The index faces immediate resistance at 85,100 (R1), whereas the next resistance is at 85,801.70 (R2), a level near its 52-week high. On the downside, support lies at 84,540 (S1), where the index has taken support previously. Whereas the next support level (S2) is at 84,090.
Trade Setup:
| Sensex | |
| Resistance 2 | 85,801.70 |
| Resistance 1 | 85,100.00 |
| Closing Price | 84,587.01 |
| Support 1 | 84,540.00 |
| Support 2 | 84,090.00 |
Market Recap on November 25th, 2025
On Tuesday, the Nifty 50 opened slightly higher at 25,998.5, up by 39 points from its previous close of 25,959.5. The index hit an intraday high of 26,032.6 and closed below the 26,000 level at 25,884.8, down -74.7 points, or 0.29%. The index closed above all key moving averages (20/50/100/200-day EMAs) on the daily chart. The BSE Sensex followed the same trajectory, opening on a positive trend at 85,008.93, up 108.22 points from the previous close of 84,900.71.
It closed at 84,587.01, down -313.7 points, or 0.37%. Both indices showed moderate momentum, with RSI values for the Nifty 50 at 54.4 and the Sensex at 55.01, below the overbought threshold of 70. The broad indices witnessed a fall due to mixed global cues, continued FIIs selling for a second day, and volatility due to the monthly Nifty F&O expiry.
On Tuesday, major gainers were the Nifty Realty index, which rose after witnessing five days of consecutive fall, rose 1.6% or 14.35 points, and stood at 901.35. Stocks such as Anant Raj Ltd. rose 4.1%, followed by Brigade Enterprises Ltd. and Phoenix Mills Ltd., which increased by up to 3.4% on Tuesday. The Nifty PSU Bank index was also among the highest gainers, increasing 1.4% or 120.75 points, and standing at 8,486.50. Stocks such as Bank of Maharashtra, Indian Bank, Bank of Baroda, and Punjab & Sind Bank all rose by up to 2.4% on Tuesday. The Nifty Midcap 50 index also rose by 0.6% or 96.4 points, to 17,188.95.
On the other hand, the Nifty Media index was the major loser, falling -0.80% or -11.55 points, and standing at 1,424.95. Stocks such as PVR Inox Ltd fell by -2.70%, followed by Zee Entertainment and Nazara Technologies Ltd, which decreased by up to -1.26% on Tuesday. The Nifty IT index was also among the biggest losers, falling -0.57% or -211.05 points, and standing at 36,826.
Stocks such as LTIMindtree Ltd were down -1.5% on Tuesday. While other stocks like Infosys Ltd, Oracle Financial Services, and Tata Consultancy Services also decreased by up to -1.12%. The Nifty Consumer Durable index was also among the top losers, falling -0.57% or -214.50 points, and standing at 37,443.
Asian markets had a positive sentiment on Tuesday. While China’s Shanghai Composite increased by 33.25 points, or 0.86%, to 3,870.02, Japan’s Nikkei 225 decreased by -5.88 points or -0.01%, closing at 48,620.00. Hong Kong’s Hang Seng Index increased by 219.50 points, or 0.85%, to close at 25,936.00. South Korea’s KOSPI rose by 11.72 points or 0.30%, closing at 3,857.78.
India VIX
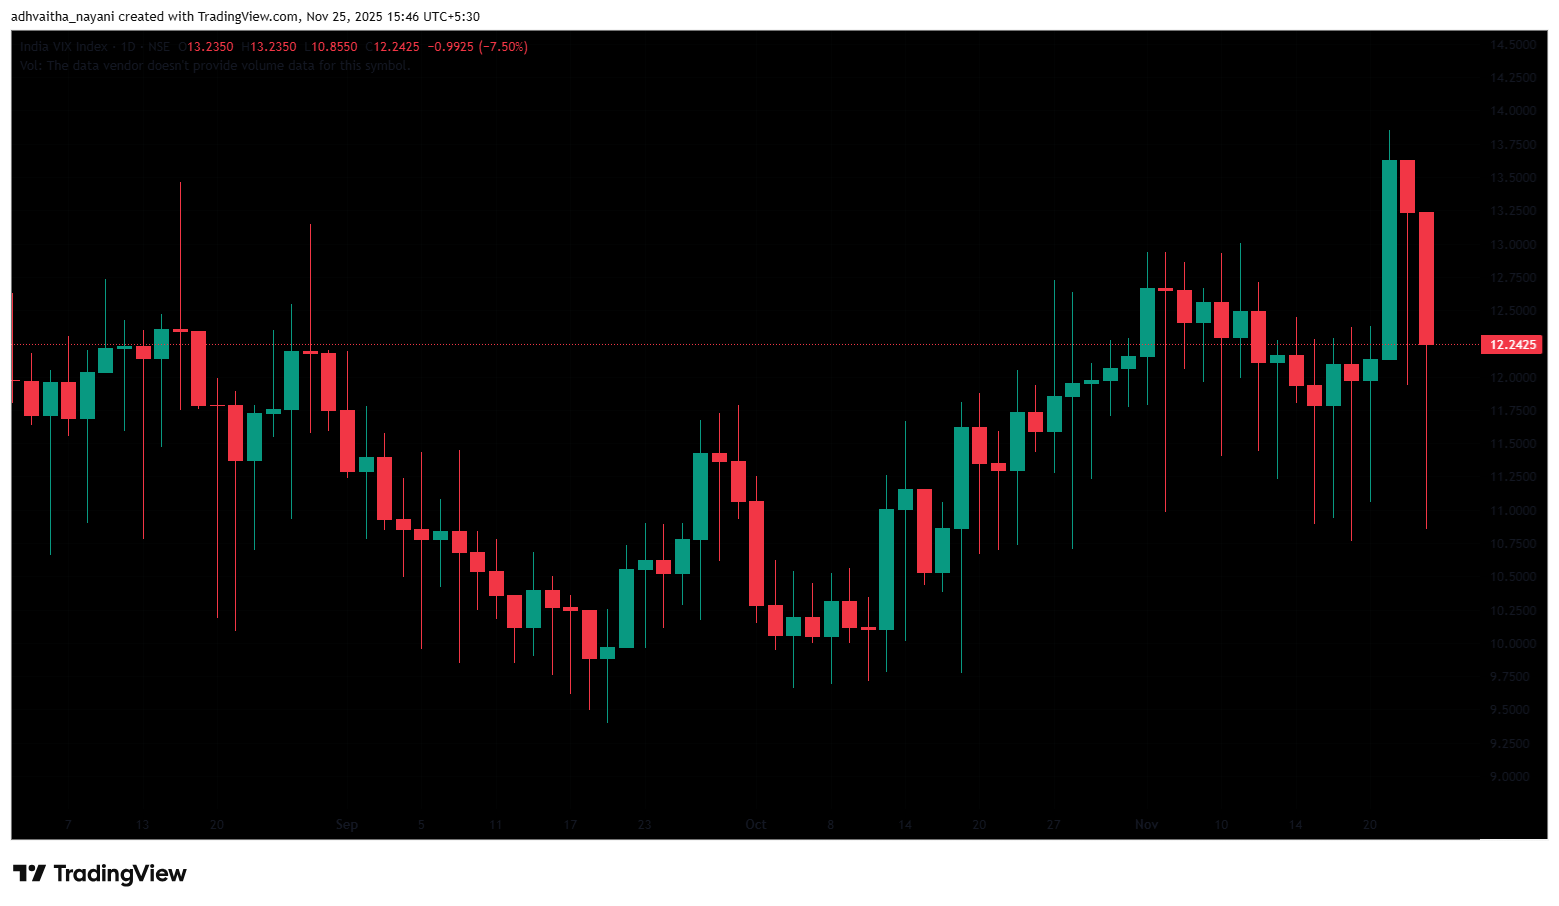
The India VIX fell 0.99 points (7.50%) from 13.24 to 12.24 during Tuesday’s session, indicating a downtrend in expected market volatility. However, overall volatility remains low, since the India VIX is generally considered elevated only when it rises above 15.
Given the ongoing volatility and mixed sentiments, it’s advisable to avoid aggressive positions and wait for clear directional moves above resistance or below support. Traders should consider these key support and resistance levels when entering long or short positions following the price break from these critical levels. Additionally, traders can combine moving averages to identify more accurate entry and exit points.
Disclaimer

The views and investment tips expressed by investment experts/broking houses/rating agencies on tradebrains.in are their own, and not that of the website or its management. Investing in equities poses a risk of financial losses. Investors must therefore exercise due caution while investing or trading in stocks. Trade Brains Technologies Private Limited or the author are not liable for any losses caused as a result of the decision based on this article. Please consult your investment advisor before investing.
About: Trade Brains Portal is a stock analysis platform. Its trade name is Dailyraven Technologies Private Limited, and its SEBI-registered research analyst registration number is INH000015729.
Investments in securities are subject to market risks. Read all the related documents carefully before investing.
Registration granted by SEBI and certification from NISM in no way guarantee performance of the intermediary or provide any assurance of returns to investors.
