

On Thursday, Indian equity benchmarks continued their downward trajectory for a fifth straight session, weighed down by weak investor sentiment and heightened market volatility. The Nifty 50 opened on a subdued note and slipped below key psychological levels during the session, while the Sensex also mirrored the bearish tone. Despite remaining above long-term support levels on the daily charts, both indices dipped below key short-term moving averages, suggesting signs of near-term weakness. Momentum indicators showed a cooling trend, hinting at a loss of upward strength across the broader market.

Sectorally, most indices ended in the red, with the metal sector emerging as the lone bright spot amid widespread losses. Realty, IT, and auto stocks were among the biggest drags on the indices, with several heavyweight counters witnessing notable declines. In the broader Asian markets, sentiment remained mixed, with most indices trading lower amid global uncertainties, although Japan’s Nikkei managed modest gains. Meanwhile, US futures were also trading slightly lower, reflecting continued global caution.

In this overview, we will analyse the key technical levels and trend directions for Nifty and BSE Sensex to monitor in the upcoming trading sessions. All the charts mentioned below are based on the 5-minute timeframe.
Nifty 50
(In this analysis, we have used 20/50/100/200 EMAs, where 20 EMA (Red), 50 EMA (Orange), 100 EMA (Light Blue), and 200 EMA (Dark Blue)).
To view other technical reports, click here
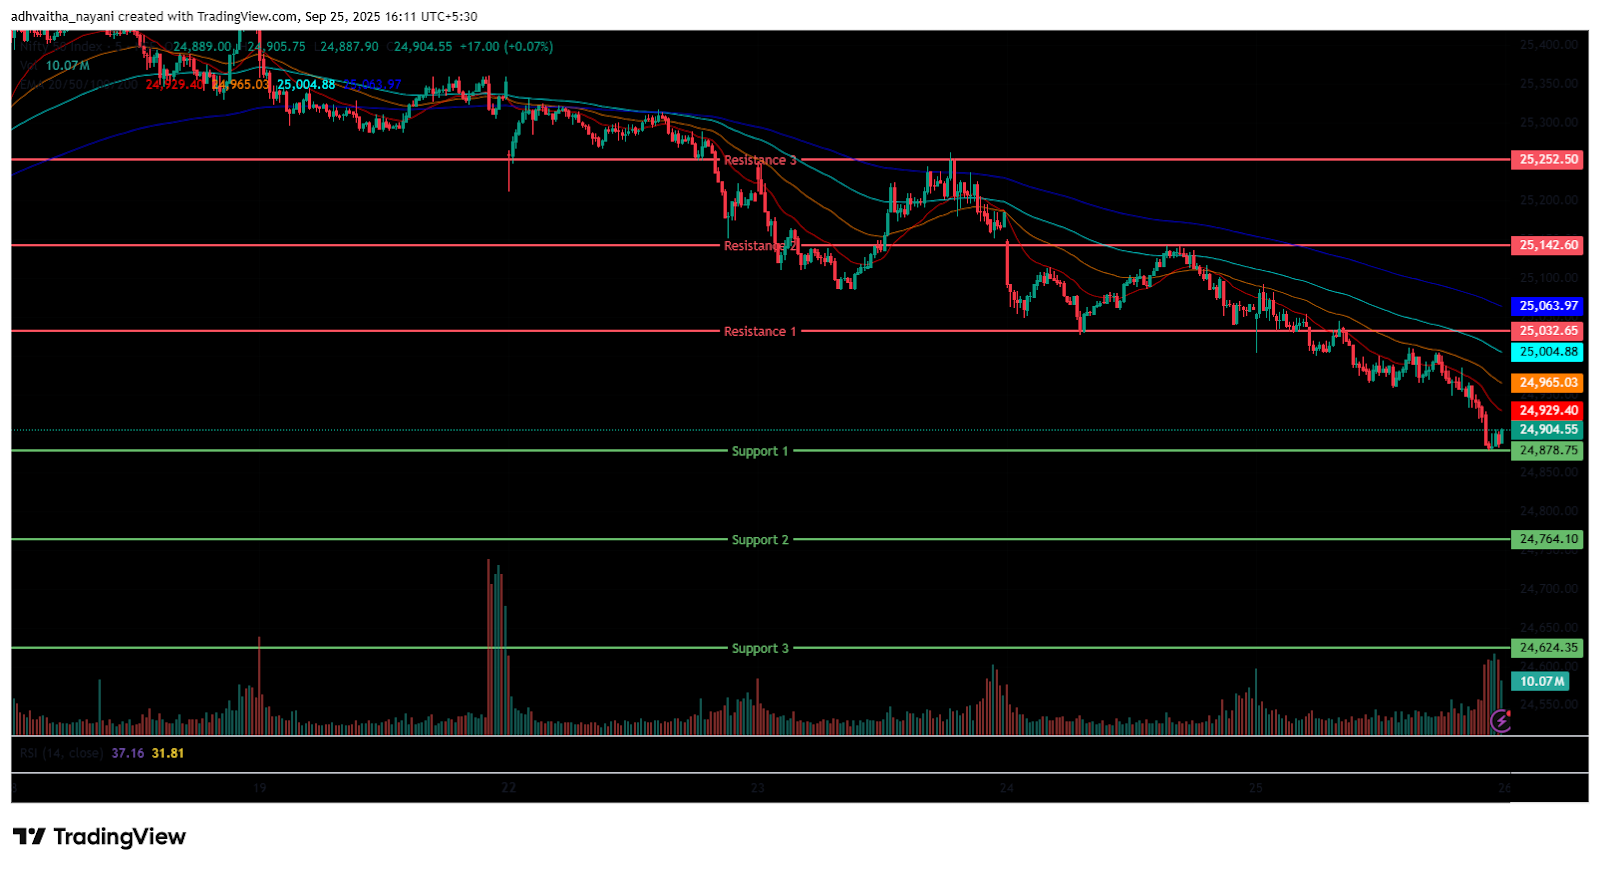
The Nifty 50 Index opened on a negative note at 25,034.50 on Thursday, down by 22.4 points from Wednesday’s closing of 25,056.90. With a bearish start to the day, the index had a volatile morning session, trading between 24,960 to 25,100 range. Additionally, the Index stood below all four EMAs of 20/50/100/200 in the 15-minute time frame during the morning session.
The index fell as low as the 24,878 mark, the day’s low in the afternoon session, and was traded below its opening level, between the range of 24,900 and 25,000. During the afternoon session, the Nifty 50 traded below all four EMAs of 20/50/100/200 in the 15-minute time frame. Nifty’s immediate resistance levels are R1 (25,033), R2 (25,143), and R3 (25,252), while immediate support levels are S1 (24,879), S2 (24,764), and S3 (24,624).
The Nifty index had reached a day’s high at 25,092.70 and saw a day’s low at 24,878.30. Finally, it had closed at 24,890.85, in red below the 24,900 level, losing 166.05 points, or 0.66%. The Nifty 50 closed above the EMAs of 100/200 but below the 20/50 EMAs in the daily time frame.
Momentum Indicators
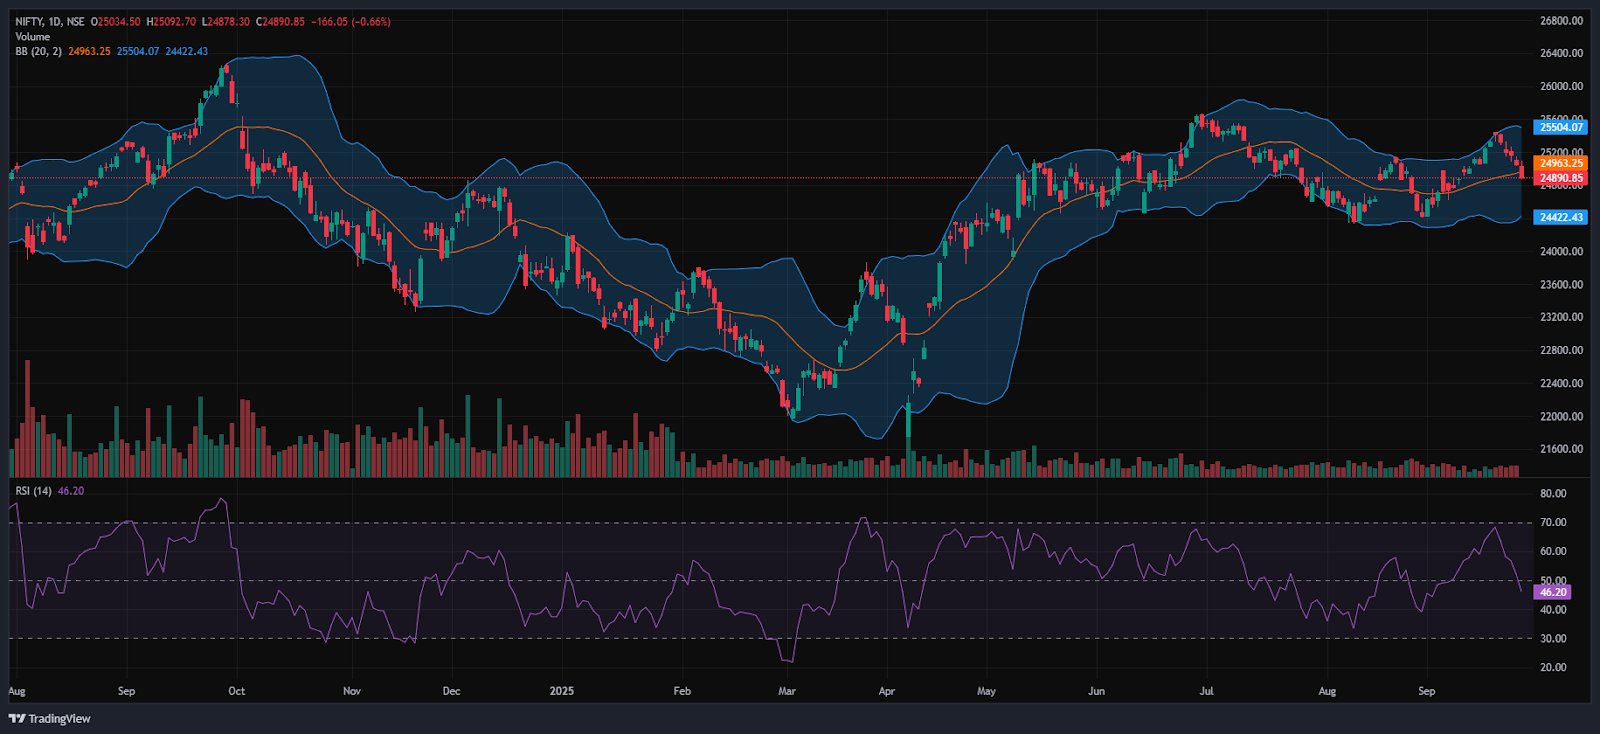
RSI (Daily): The Nifty 50’s RSI stood at 46.20, which is well below the overbought zone of 70 but nearing the oversold zone, indicating a short-term bearish sentiment.
Bollinger Bands (Daily): The index is trading in the lower band of its Bollinger Band range below the middle band (Simple Moving Average). Its position in the lower range, along with strong resistance around the 25,000 level in Thursday’s session. A sustained move above the middle band signals a bullish sentiment, while a drop back toward the lower band may reinforce bearish sentiment.
Volume Analysis: Thursday’s trading session had above-average volumes, which stood at 342.53 Mn.
Derivatives Data: Options OI indicates strong Put writing at 24,800, following 24,700, establishing it as a firm support zone. On the upside, a significant Call OI buildup at 25,000 and 25,100 suggests a potential resistance supply. PCR (Put/Call Ratio) stands at 0.5844 (<1), leaning towards bullish sentiment and the Short covering signals a temporary short-term bullish move, with an overall neutral to positive outlook for the next trading session.
Bank Nifty
(In this analysis, we have used 20/50/100/200 EMAs, where 20 EMA (Red), 50 EMA (Orange), 100 EMA (Light Blue), and 200 EMA (Dark Blue)).
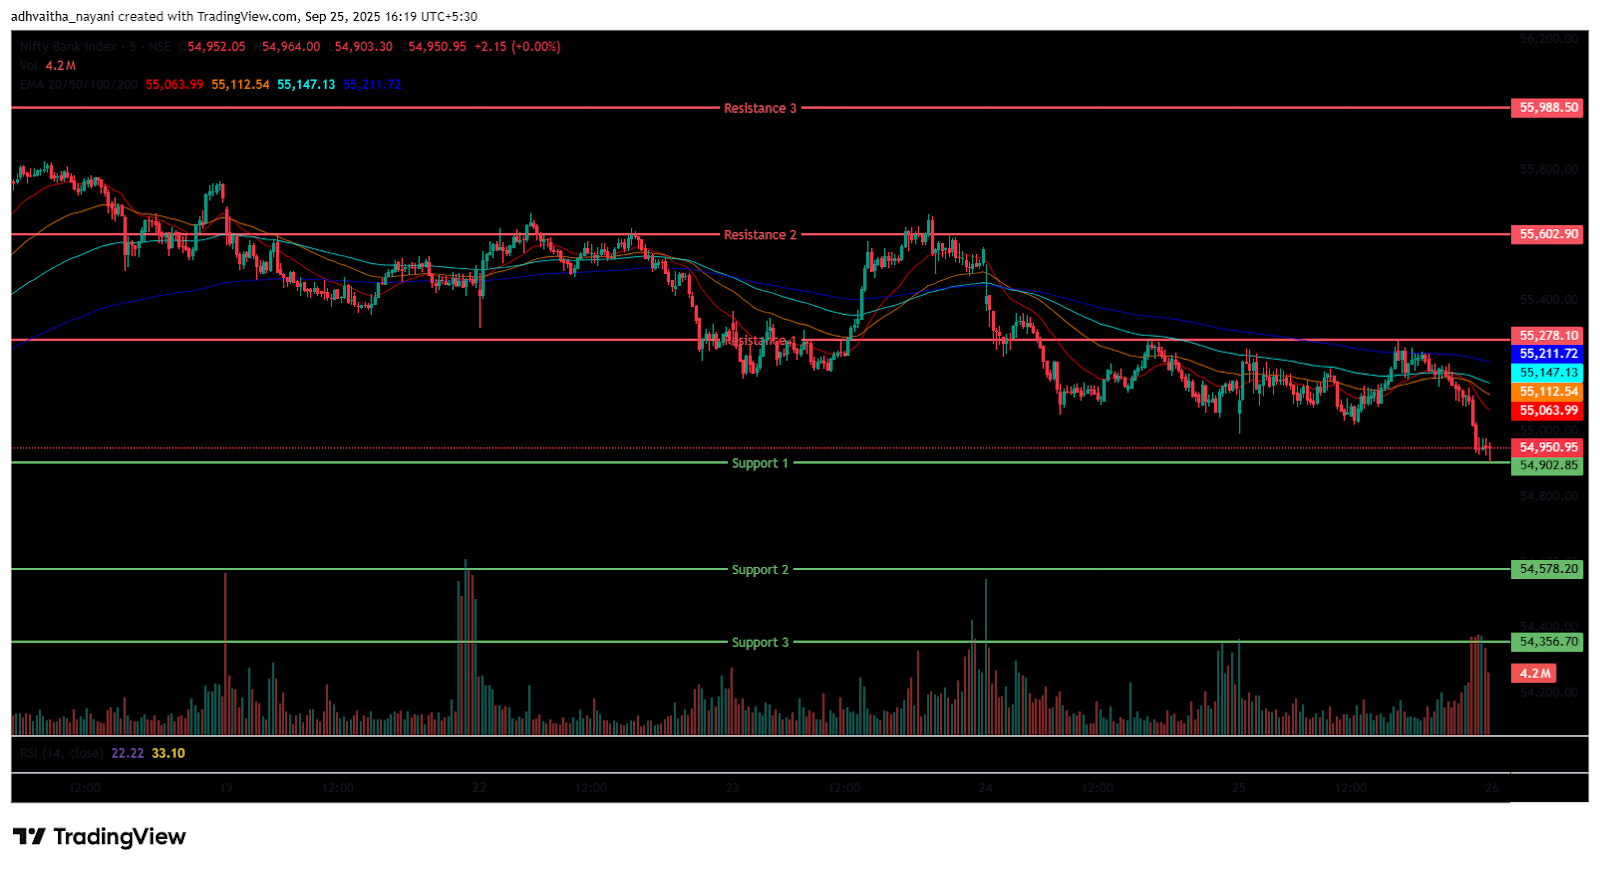
The Bank Nifty Index also started the session on a negative note at 55,061.65 on Thursday, down by 59.85 points from Wednesday’s closing of 55,121.50. The index was trading between the range of 55,000 and 55,250 in the morning session, indicating higher volatility. In addition, the index was trading below all four EMAs of 20/50/100/200 in the 15-minute time frame.
In the afternoon session, the Index further fell as low as the 54,903 level, marking its day’s low and was traded around the range of 54,900 and 55,300, ending in red. During the afternoon session, Bank Nifty closed below all four EMAs of 20/50/100/200 in the 15-minute time frame. Bank Nifty immediate resistance levels are R1 (55,278), R2 (55,603), and R3 (55,989), while immediate support levels are S1 (54,903), S2 (54,578), and S3 (54,357).
The Bank Nifty index had peaked at 55,276.65 and made a day’s low at 54,903.30. Finally, it had closed in red at 54,976.20, closing below the 55,000 level, losing 145.30 points or 0.26%. The Relative Strength Index (RSI) stood at 48.78 well below the overbought zone of 70 but nearing the oversold zone in the daily time frame, and Bank Nifty closed above the EMAs of 100/200 but below the 20/50 EMA in the daily time frame.
Sensex
(In this analysis, we have used 20/50/100/200 EMAs, where 20 EMA (Red), 50 EMA (Orange), 100 EMA (Light Blue), and 200 EMA (Dark Blue)).
To view other technical reports, click here
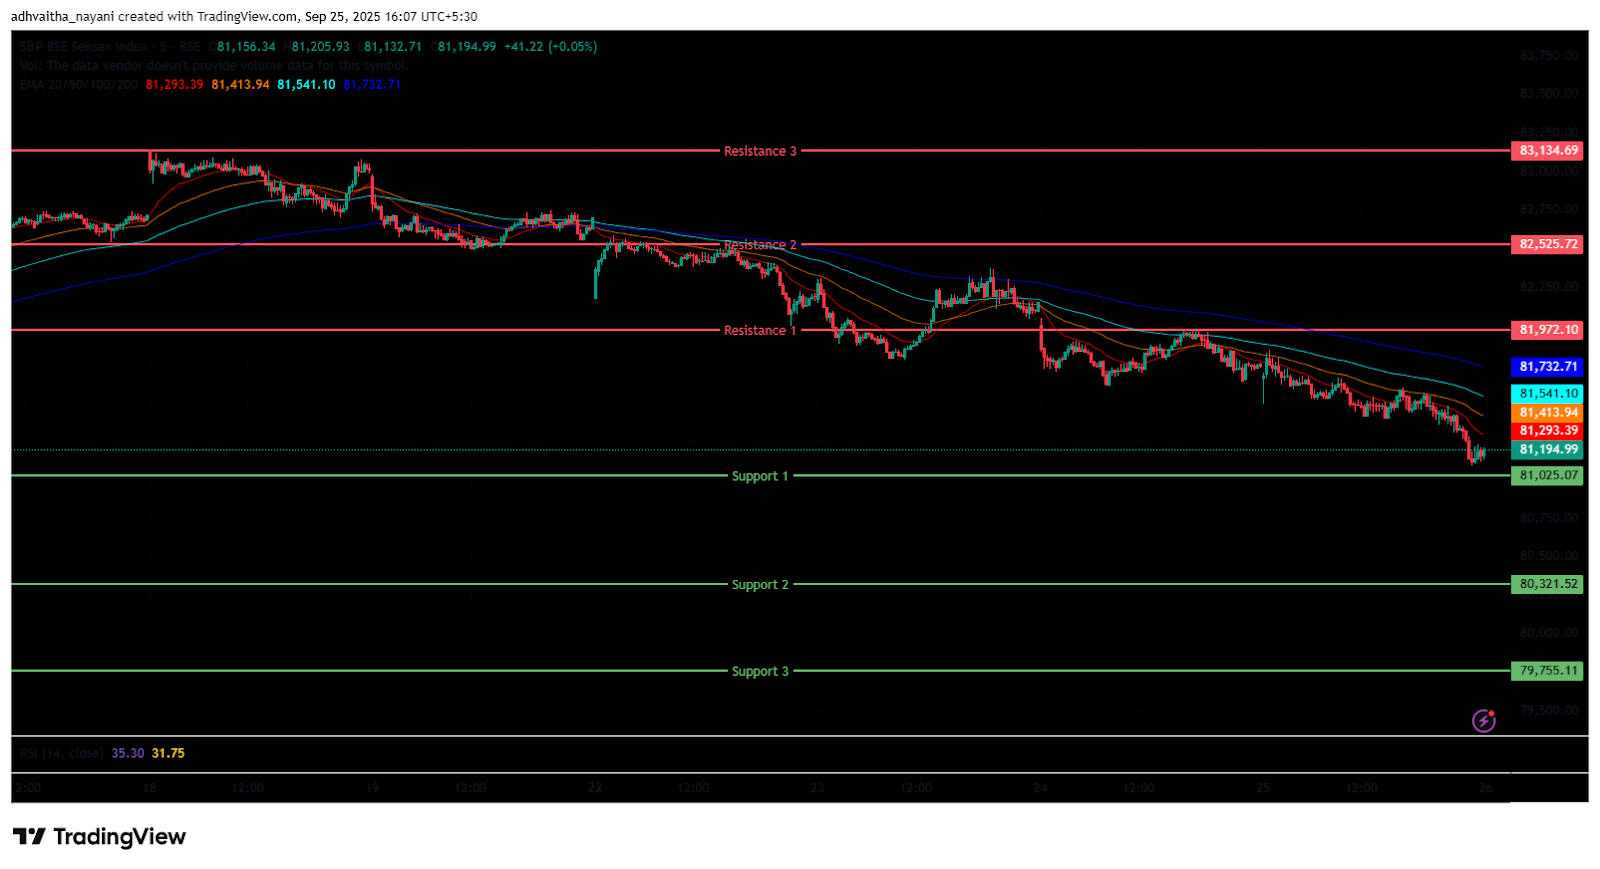
The BSE Sensex Index also opened on a negative note at 81,574.31 on Thursday, down by 141.32 points from Wednesday’s closing of 81,715.63. The index started its session on a bearish note and was trading between 81,400 to 81,850 range throughout the morning session’s 15-minute time frame, below all four EMAs of the 20/50/100/200.
In the afternoon session, the Index was further dragged down, marking its day low at the 81,093 level and trading between the 81,100 and 81,600 levels, maintaining its overall bearish trend and closing below all four EMAs of 20/50/100/200 in the 15-minute time frame. BSE Sensex immediate resistance levels are R1 (81,972), R2 (82,526), and R3 (83,135), while immediate support levels are S1 (81,025), S2 (80,321), and S3 (79,755).
The BSE Sensex index had peaked at 81,840.73 and made a day’s low at 81,092.89. Finally, it closed at 81,159.68 in red, losing 555.95 points or 0.68%. The Relative Strength Index (RSI) stood at 45.17 (below the overbought zone of 70 but nearing the oversold zone in the daily time frame), and the BSE Sensex closed above the EMAs of 100/200 but below the 20/50 EMA in the daily time frame.
India VIX
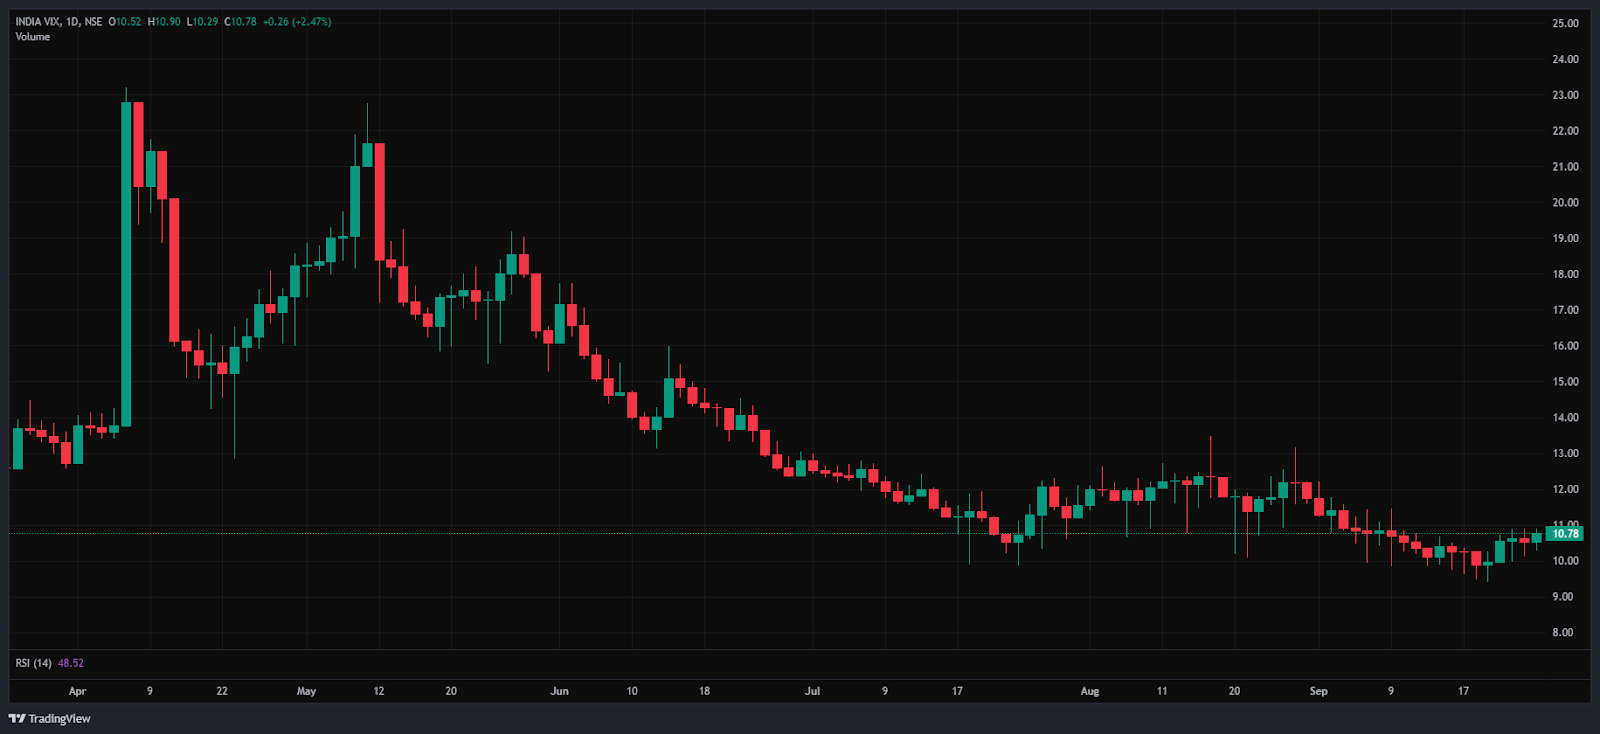
The India VIX increased by 0.26 points or 2.47%, from 10.52 to 10.78 during Thursday’s session. An increase in the India VIX typically indicates higher price volatility in the stock market, suggesting a less stable market environment. However, a stable market environment and minimal volatility are anticipated when the India vix is below 15.
Market Recap on the 25th of September 2025
On Thursday, the Nifty 50 began the session on a weak note, opening below the 25,100 level at 25,034.50, a drop of -22.40 points from its previous close of 25,056.90. The index slipped to an intraday low of 24,878.30 before ending the day below the 25,000 mark, closing at 24,890.85, down -166.05 points or -0.66%. While the index held above its 100-day and 200-day exponential moving averages (EMAs) on the daily chart, it dipped below the 20-day and 50-day EMAs, suggesting short-term weakness.
The BSE Sensex mirrored this decline, opening at 81,574.31, down -141.32 points from the previous close of 81,715.63, and closed lower at 81,159.68, shedding -555.95 points or -0.68%. Momentum indicators signalled waning strength, with the Relative Strength Index (RSI) at 46.20 for Nifty and 45.17 for Sensex, both retreating from the overbought zone.
The Bank Nifty also slipped by -145.30 points or -0.26%, ending at 54,976.20. Overall, this marked the fifth consecutive session of decline for benchmark indices, driven by elevated volatility and subdued investor sentiment.
Most sectoral indices ended in the red. The Nifty Metal Index was the exception, closing as the top performer, up 22.45 points or 0.22%, to 10,082.55. Gains were led by Hindustan Copper Ltd (+6.32%), while Hindustan Zinc Ltd and Vedanta Ltd also rose by up to 3.06%.
On the downside, the Nifty Realty Index was the biggest laggard, slipping -14.70 points or -1.65%, to settle at 875.90. Godrej Properties Ltd declined -2.56%, while Lodha Developers, Prestige Estates, and DLF Ltd dropped by as much as -2.54%. The Nifty IT Index also saw a sharp fall of -445.95 points, or -1.27%, closing at 34,548.30, with losses in TCS, Coforge, Persistent Systems, and Oracle Financial Services, which dropped up to -1.97%. The Nifty Auto Index fell -249.10 points or -0.92%, ending at 26,758.50.
Asian markets largely tracked a bearish trend. Hong Kong’s Hang Seng Index declined -44.65 points or -0.17% to 26,474.00, while China’s Shanghai Composite remained nearly flat, losing -0.34 points or -0.01% to end at 3,853.30. South Korea’s KOSPI Index edged lower by -1.03 points or -0.03%, closing at 3,471.11. In contrast, Japan’s Nikkei 225 bucked the trend with a gain of 98.69 points or 0.22%, finishing at 45,729.00. As of 4:45 p.m. IST, US Dow Jones Futures were trading slightly negative at 46,092.97, down -26.32 points or -0.08%.
Trade Setup Summary
The Nifty 50 opened on a negative note at 25,034.50 on Thursday and ended the session in the red below the 24,900 level at 24,890.85. A break below 24,879 could trigger further selling towards 24,764 while breaking the next resistance level of 25,033 could trigger bullishness towards the 25,143 level.
Bank Nifty started the session on a negative note at 55,061.65 and ended the session in the red at 54,976.20, below the 55,000 level. A break below 54,903 could trigger further selling towards 54,578, while breaking the next resistance level of 55,278 could trigger bullishness towards the 55,603 level.
Sensex also opened on a negative note at 81,574.31 and ended the session in the red at 81,159.68, below the 81,200 level. A break below 81,025 could trigger further selling towards 80,321, while breaking the next resistance level of 81,972 could lead towards the 82,526 level.
Given the ongoing volatility and mixed sentiments, it’s advisable to avoid aggressive positions and wait for clear directional moves above resistance or below support. Traders should consider these key support and resistance levels when entering long or short positions following the price break from these critical levels. Additionally, traders can combine moving averages to identify more accurate entry and exit points.
Disclaimer

The views and investment tips expressed by investment experts/broking houses/rating agencies on tradebrains.in are their own, and not that of the website or its management. Investing in equities poses a risk of financial losses. Investors must therefore exercise due caution while investing or trading in stocks. Trade Brains Technologies Private Limited or the author are not liable for any losses caused as a result of the decision based on this article. Please consult your investment advisor before investing.
About: Trade Brains Portal is a stock analysis platform. Its trade name is Dailyraven Technologies Private Limited, and its SEBI-registered research analyst registration number is INH000015729.
Investments in securities are subject to market risks. Read all the related documents carefully before investing.
Registration granted by SEBI and certification from NISM in no way guarantee performance of the intermediary or provide any assurance of returns to investors.
