The Indian markets showed strong positive sentiment on Wednesday. Both the Nifty 50 and the Sensex opened slightly weak but staged a powerful rebound, closing well above key levels and all major moving averages. Momentum indicators also stayed comfortably below the overbought zone, signalling healthy strength. The broader market participated actively as expectations of a US Federal Reserve rate cut boosted confidence after a period of volatility.
All major sectors ended higher, led by strong gains in metals, consumer durables, and energy. Several stocks within these sectors posted notable advances, reflecting widespread buying interest. Asian markets were largely positive as well, with most major indices closing in the green, indicating an improving global risk appetite despite mild weakness in China’s Shanghai Composite Index.
In this overview, we will analyse the key technical levels and trend directions for Nifty and BSE Sensex to monitor in the upcoming trading sessions. All the charts mentioned below are based on the 15-minute timeframe.
NIFTY 50 Chart & Price Action Analysis
To view other technical reports, click here
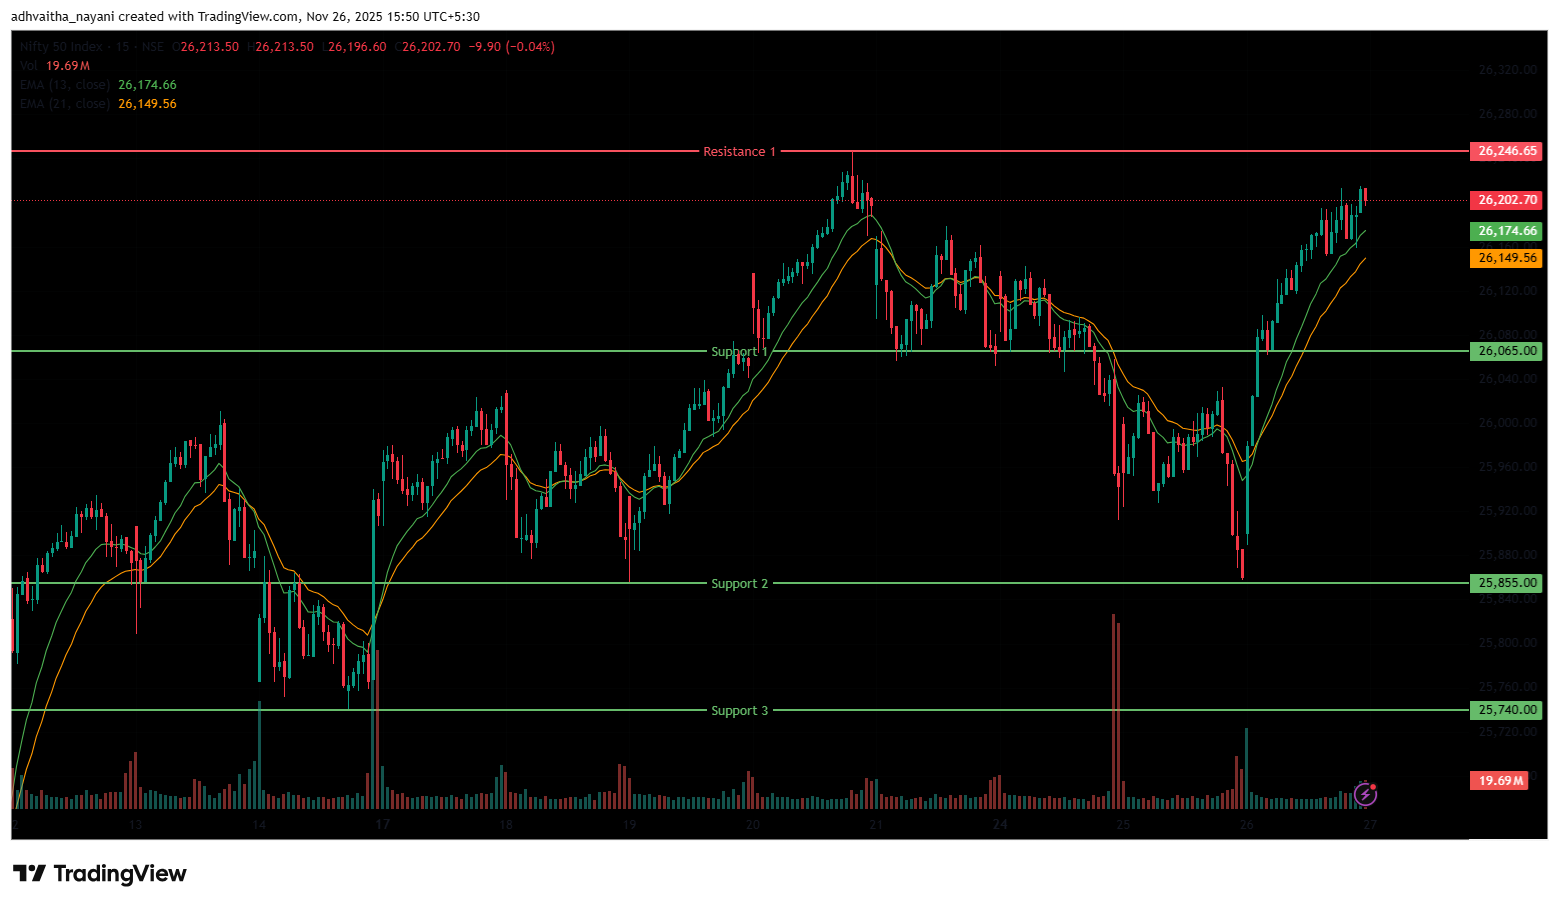
The Nifty 50 Index opened on a flat-to-negative note at 25,842.95 on Wednesday, down by 41.85 points from Tuesday’s closing of 25,884.80. The index opened on a negative note but traded in a strong uptrend during the morning session, soon crossing the 26,000 level. The Index was trading within the range of 26,000 and 26,170. In the afternoon session, the index continued to surge further and reached its high at 26,215.15 and settled above the 26,200 level, ending the session on a strong bullish note, after three consecutive losses in the past sessions.
The Nifty index had reached a day’s high at 26,215.15 and saw a day’s low at 25,842.95. Finally, it had closed at 26,205.30, in the green, up 320.50 points, or 1.24%. In the short term, the Index was above the 13/20-day EMA, indicating a near-term bullish trend in the daily time frame and the index formed a bullish marubozu candlestick pattern, further strengthening the bullish trend.
The Nifty 50’s nearest resistance level is at 26,246.65 (R1), which is the 52-week high for the index. On the other hand, the closest support is now at 26,065 (S1) and the next one at 25,855 (S2), where the index has taken support previously at these levels multiple times. If the index falls below this, the next strong support level to watch is at 25,740 (S3).
Trade Setup:
| Nifty 50 | |
| Resistance 1 | 26,246.65 |
| Closing Price | 26,205.30 |
| Support 1 | 26,065.00 |
| Support 2 | 25,855.00 |
| Support 3 | 25,740.00 |
NIFTY 50 Momentum Indicators Analysis

RSI (Daily): The Nifty 50’s RSI stood at 63.21, which is below the overbought zone of 70, indicating room to grow higher.
Bollinger Bands (Daily): The index is trading in the upper band of the Bollinger Band range. Its position in the upper range suggests a bullish sentiment in the short term. On Wednesday’s session, the Index formed a strong bullish candle (Bullish Marubozu), ending in green, reversing the losses of the past three sessions. The index took support near 25,850 and sustained above the 26,200 level. A sustained move above the middle band signals a bullish sentiment, while a drop back toward the lower band may reinforce bearish sentiment.
Volume Analysis: Wednesday’s trading session had an average volume of 275.27 Mn.
Derivatives Data: Options open interest (OI) data suggest a strong support zone around 26,100 and 26,200, where put option writing is high, indicating traders expect the index to hold these levels. On the upside, significant call option open interest at 26,300 and 26,400 signals resistance, as sellers are likely to defend these strike prices. The Put/Call Ratio (PCR) stands at 1.5, which is above 1 and indicates a bearish sentiment with more put activity than call. However, the presence of short covering, where traders buy back shares they previously sold short to close their position, increases demand and pushes the price upward, adding buying pressure, making the overall outlook mixed. This combination implies the market may trade in a range, with strong support near 26,100-26,200 and resistance near 26,300-26,400, until a decisive breakout occurs.
Bank Nifty Chart & Price Action Analysis
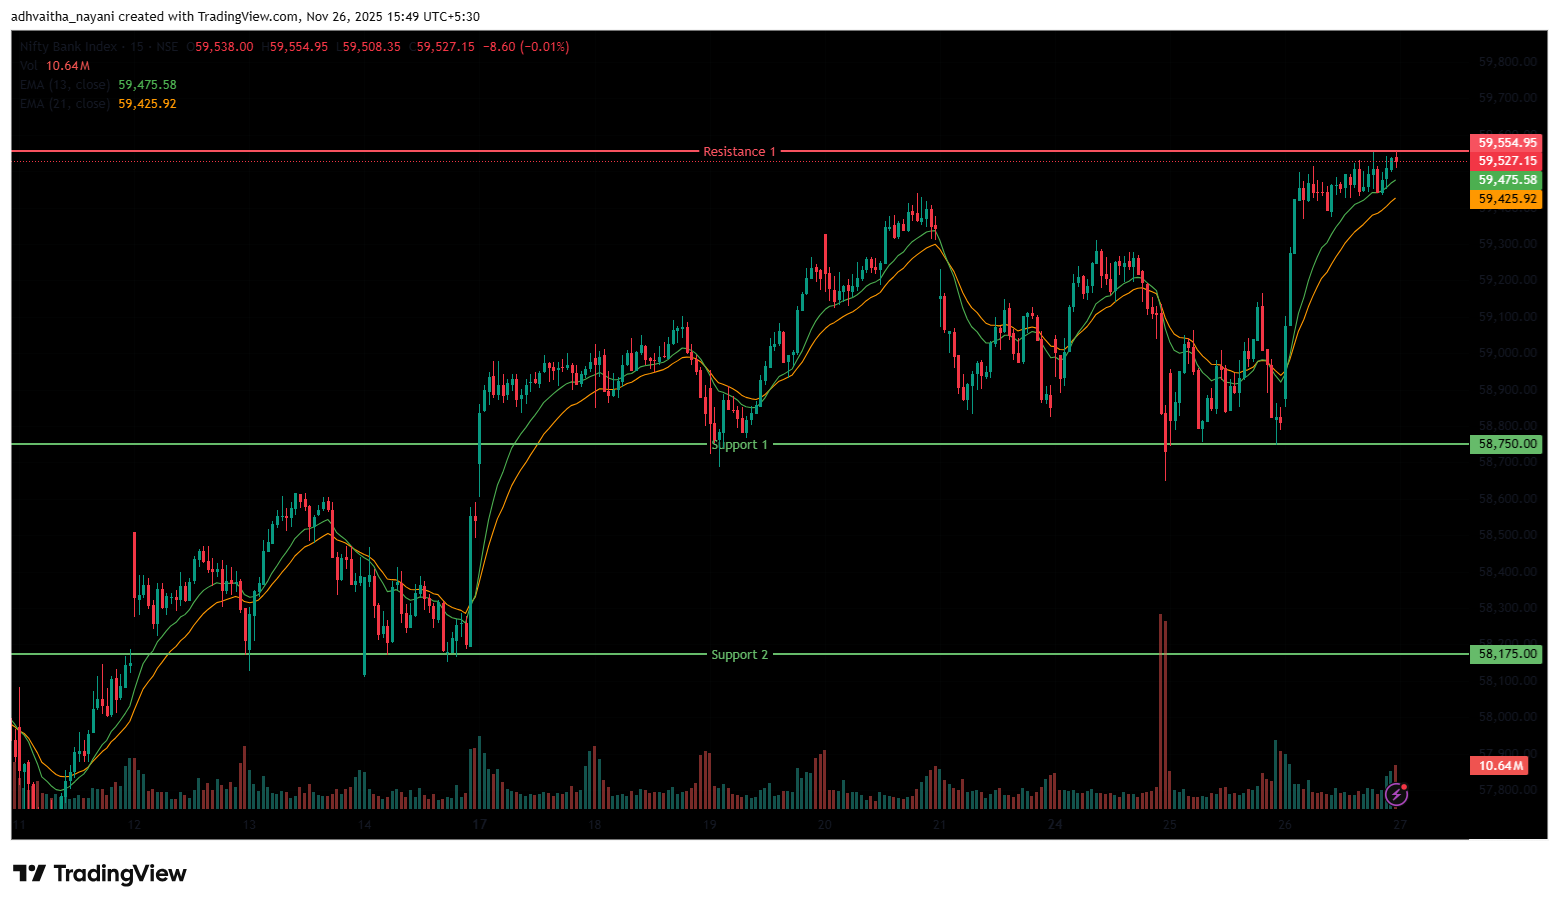
The Bank Nifty Index also opened on a flat note at 58,783.05, below the 58,800 level, on Wednesday, down by 37.25 points from Tuesday’s closing of 58,820.30. During the morning session, the index moved upwards above 59,400, but later it was trading in a consolidated range near the 59,400 level, following an optimistic opening. In the afternoon session, the index continued to trade in a range-bound manner and reached the day’s high at the 59,554.95 level, hitting an all-time high.
It traded in the range of 59,400 and 59,550, ending the day near the 59,500 mark. The Bank Nifty index had peaked at 59,554.95 and made a day’s low at 58,783.05. Finally, it had closed on a strong bullish note at 59,528.05, surging 707.75 points or 1.20%. The Relative Strength Index (RSI) stood at 70.25, near the overbought zone of 70 in the daily time frame. In the short term, the Index was above the 13/20 day EMA in the daily time frame, and the index formed a bullish marubozu candlestick pattern, further strengthening the bullish trend.
The nearest resistance is at 59,554.95 (R1), which is the all-time high for the index. On the other hand, the closest support is now at 58,750 (S1), where the index has taken support at this level previously. If the index falls below this, the next major support level to watch is at 58,175 (S2).
Trade Setup:
| Bank Nifty | |
| Resistance 1 | 59,554.95 |
| Closing Price | 59,528.05 |
| Support 1 | 58,750.00 |
| Support 2 | 58,175.00 |
BSE Sensex Chart & Price Action Analysis
To view other technical reports, click here
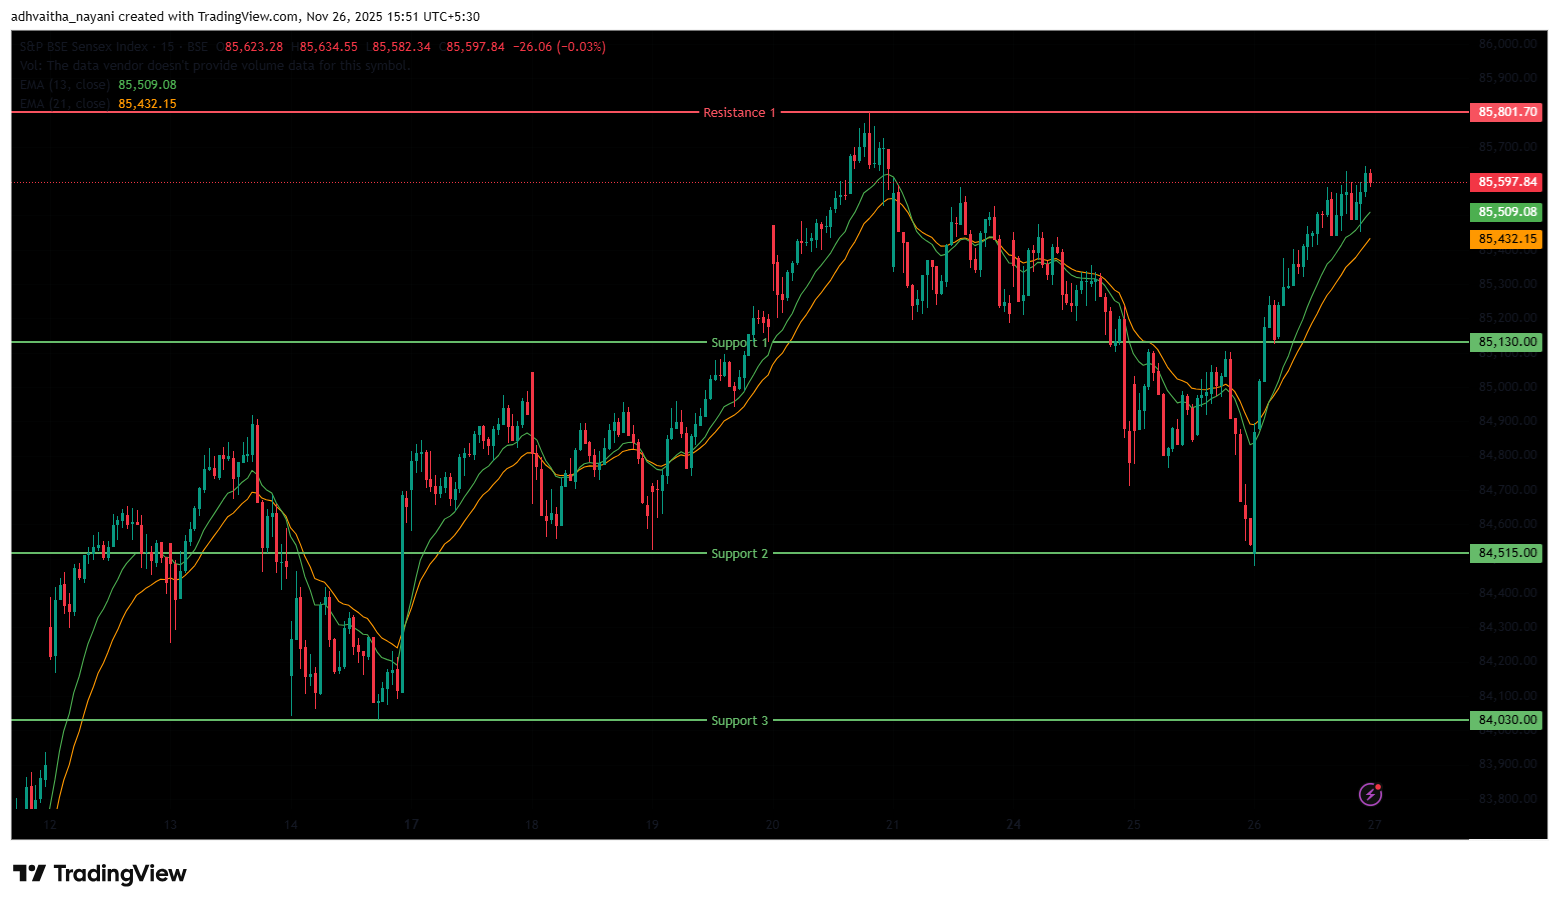
The BSE Sensex Index also opened on a similar note as the Nifty 50, opening at 84,503.44 on Wednesday, down by 83.57 points from Tuesday’s closing of 84,587.01. The Sensex index, though opening on a negative note, traded in a strong bullish trend during the morning session. It traded in the range of 84,500 and 85,500 during the morning session. In the afternoon session, the index surged further as high as 85,644.19, marking its day’s high and settling above the 84,600 level.
The Index was trading between the range of 85,500 and 85,640 during the afternoon session. The BSE Sensex index had peaked at 85,644.19 and made a day’s low at 84,478.13. Finally, it had closed at 85,609.51 in green, jumping 1,022.50 points or 1.21%. The Relative Strength Index (RSI) stood at 63.54, below the overbought zone of 70 in the daily time frame. In the short term, the Index was above the 13/20 day EMA in the daily time frame, and the index formed a bullish marubozu candlestick pattern, further strengthening the bullish trend.
The index faces immediate resistance at 85,801.70 (R1), a level near its 52-week high. On the downside, support lies at 85,130 (S1), which was previously resistance and now acts as support; the next one is at 84,515 (S2), where the index has taken support previously. Whereas the next support level (S3) is at 84,030.
Trade Setup:
| Sensex | |
| Resistance 1 | 85,801.70 |
| Closing Price | 85,609.51 |
| Support 1 | 85,130.00 |
| Support 2 | 84,515.00 |
| Support 3 | 84,030.00 |
Market Recap on November 26th, 2025
On Wednesday, the Nifty 50 opened slightly lower at 25,842.95, down by 41.85 points from its previous close of 25,884.80. The index hit an intraday high of 26,215.15 and closed above the 26,200 level at 26,205.30, up 320.5 points, or 1.24%. The index closed above all key moving averages (20/50/100/200-day EMAs) on the daily chart. The BSE Sensex followed the same trajectory, opening on a negative trend at 84,503.44, down 83.57 points from the previous close of 84,587.01.
It closed at 85,609.51, up 1,022.5 points, or 1.21%. Both indices showed a high momentum, with RSI values for the Nifty 50 at 63.21 and the Sensex at 63.54, below the overbought threshold of 70 in the daily time frame. The broader indices rallied strongly as rising expectations of a US Fed rate cut helped lift market sentiment after several weeks of volatility.
All sectoral indices ended in the green on Wednesday; major gainers were the Nifty Metal index, which rose 2.06% or 207.3 points, and stood at 10,280.70. Stocks such as Lloyds Metals & Energy rose 4.4%, followed by JSW Steel Ltd and Steel Authority of India, which increased by up to 3.8% on Wednesday. The Nifty Consumer Durables index was also among the highest gainers, increasing 1.75%, or 653.4 points, and standing at 38,096.
Stocks such as PG Electroplast Ltd rose 5.93%, followed by Century Plyboards, Kalyan Jewellers India, and Dixon Technologies, all of which rose by up to 3.3% on Wednesday. The Nifty Energy Index rose 1.74%, or 614.45 points, to 35,964.
Asian markets had an almost positive sentiment on Wednesday. China’s Shanghai Composite, the only index, slipped by 5.84 points, or 0.15%, to 3,864.18, while Japan’s Nikkei 225 jumped 899.55 points, or 1.85%, closing at 49,559.07. Hong Kong’s Hang Seng Index edged up 33.53 points, or 0.13%, to 25,928.08, and South Korea’s KOSPI advanced 103.09 points, or 2.67%, closing at 3,960.87.
India VIX

The India VIX fell 0.28 points (2.25%) from 12.24 to 11.97 during Wednesday’s session, indicating a downtrend in expected market volatility. However, overall volatility remains low, since the India VIX is generally considered elevated only when it rises above 15.
Given the ongoing volatility and mixed sentiments, it’s advisable to avoid aggressive positions and wait for clear directional moves above resistance or below support. Traders should consider these key support and resistance levels when entering long or short positions following the price break from these critical levels. Additionally, traders can combine moving averages to identify more accurate entry and exit points.
Disclaimer

The views and investment tips expressed by investment experts/broking houses/rating agencies on tradebrains.in are their own, and not that of the website or its management. Investing in equities poses a risk of financial losses. Investors must therefore exercise due caution while investing or trading in stocks. Trade Brains Technologies Private Limited or the author are not liable for any losses caused as a result of the decision based on this article. Please consult your investment advisor before investing.
About: Trade Brains Portal is a stock analysis platform. Its trade name is Dailyraven Technologies Private Limited, and its SEBI-registered research analyst registration number is INH000015729.
Investments in securities are subject to market risks. Read all the related documents carefully before investing.
Registration granted by SEBI and certification from NISM in no way guarantee performance of the intermediary or provide any assurance of returns to investors.
