
The Indian equity markets ended the week on a weak note, reflecting a broad-based sell-off across key indices and sectors. Investor sentiment remained subdued amid persistent volatility and concerns over global cues. Major benchmarks like the Nifty 50 and Sensex faced strong selling pressure, closing significantly lower and breaching crucial technical support levels.
The market’s inability to hold above short- and medium-term moving averages signalled a loss of momentum, with participants becoming increasingly risk-averse. The consistent decline through the week indicated a lack of positive triggers, while profit-booking and nervousness around macroeconomic and geopolitical developments added to the bearish tone.
Sectorally, the weakness was widespread, with all indices closing in the red, reflecting a risk-off sentiment. Small-cap and IT stocks bore the brunt of the selling, dragging down broader market confidence. Defensive sectors like pharmaceuticals and defence also failed to hold ground, adding to the overall negativity. Momentum indicators suggested weakening strength, hovering close to oversold territory but not yet signalling a reversal. Global markets mirrored a similar mood, with key Asian indices ending lower and U.S. futures showing mild declines, further dampening domestic sentiment. Overall, the market mood remained cautious.
In this overview, we will analyse the key technical levels and trend directions for Nifty and BSE Sensex to monitor in the upcoming trading sessions. All the charts mentioned below are based on the 5-minute timeframe.
Nifty 50
(In this analysis, we have used 20/50/100/200 EMAs, where 20 EMA (Red), 50 EMA (Orange), 100 EMA (Light Blue), and 200 EMA (Dark Blue)).
To view other technical reports, click here
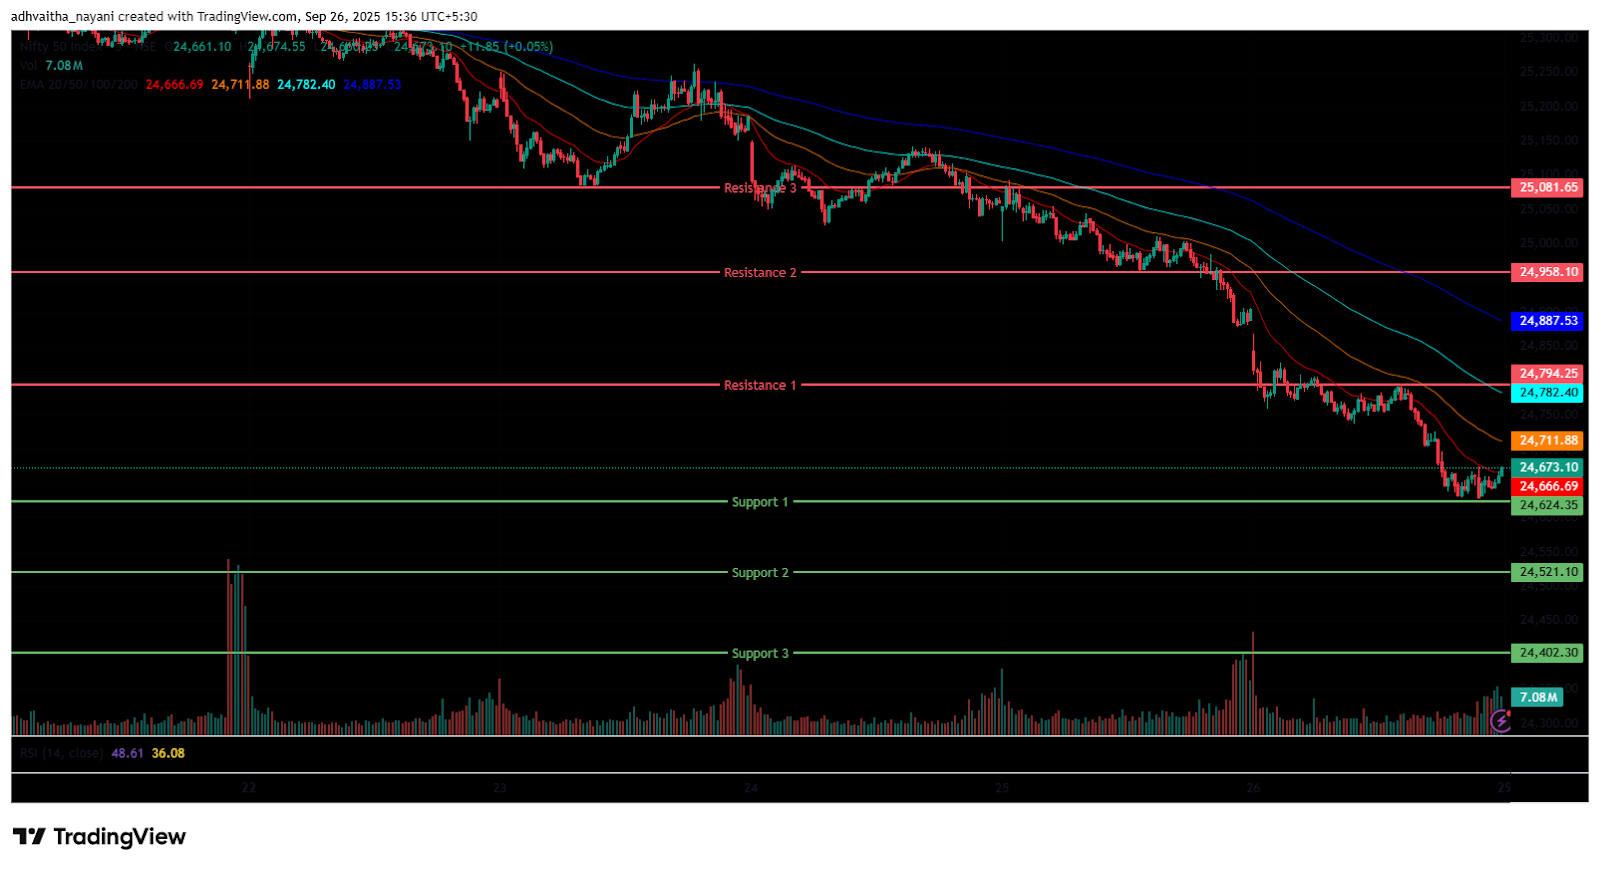
The Nifty 50 Index opened on a negative note at 24,818.55 on Friday, down by 72.3 points from Thursday’s closing of 24,890.85. With a bearish start to the day, the index had a volatile morning session, trading in the 24,700 to 24,900 range. Additionally, the Index stood below all four EMAs of 20/50/100/200 in the 15-minute time frame during the morning session.
Further, the index fell as low as the 24,629 mark, the day’s low in the afternoon session, and was traded below its opening level, between the range of 24,600 and 24,800. During the afternoon session, the Nifty 50 traded below all four EMAs of 20/50/100/200 in the 15-minute time frame. Nifty’s immediate resistance levels are R1 (24,794), R2 (24,958), and R3 (25,082), while immediate support levels are S1 (24,624), S2 (24,521), and S3 (24,402).
The Nifty index had reached a day’s high at 24,868.60 and saw a day’s low at 24,629.45. Finally, it had closed at 24,654.70, in red below the 24,700 level, losing 236.15 points, or 0.95%. The Nifty 50 closed above the EMA of 200 but below the 20/50/100 EMAs in the daily time frame.
Momentum Indicators
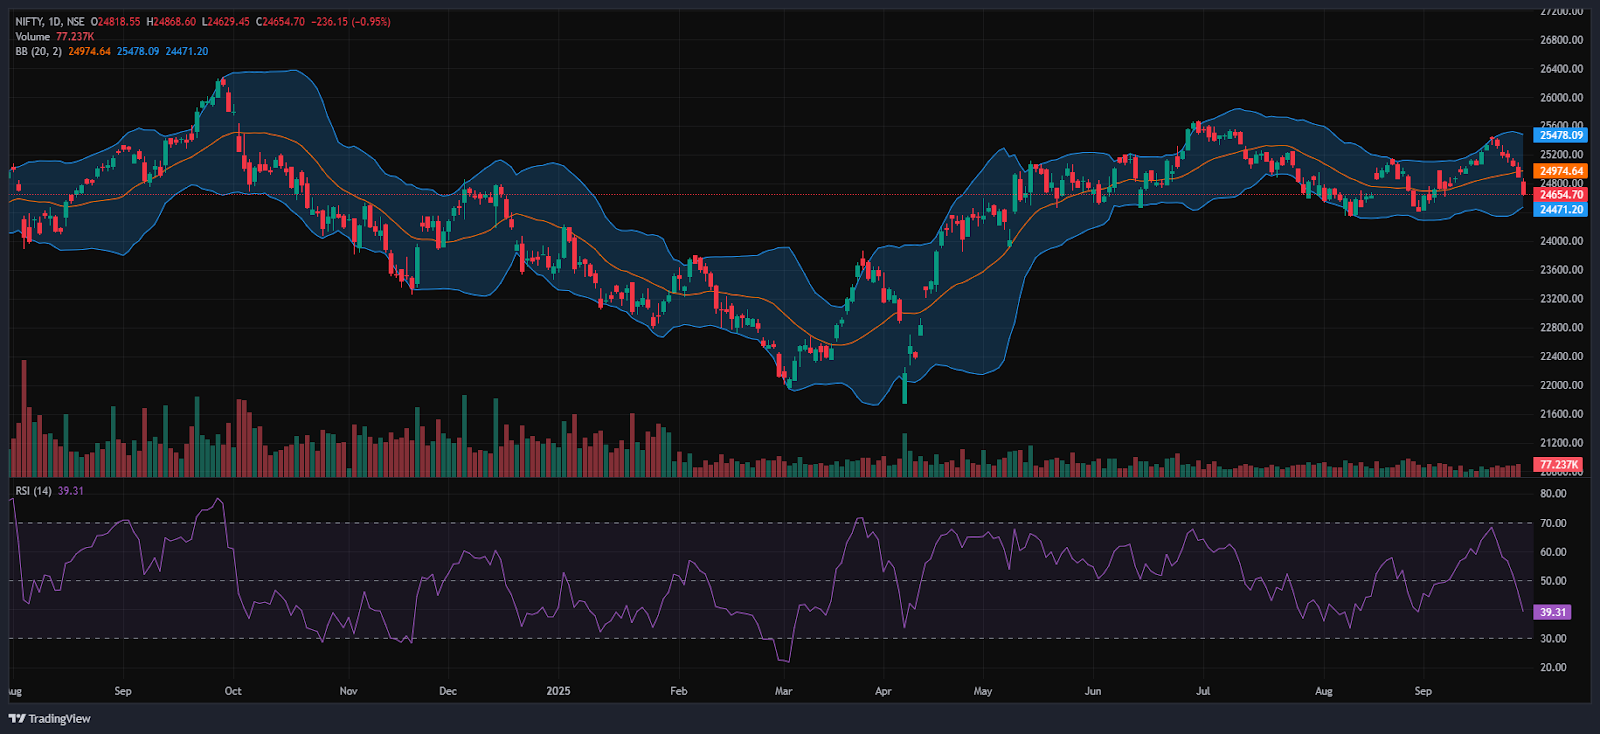
RSI (Daily): The Nifty 50’s RSI stood at 39.31, which is well below the overbought zone of 70 but near to the oversold zone, indicating a bearish sentiment.
Bollinger Bands (Daily): The index is trading in the lower band of its Bollinger Band range below the middle band (Simple Moving Average). Its position in the lower range indicates a bearish sentiment, along with strong resistance around the 24,700 level in Friday’s session. A sustained move above the middle band signals a bullish sentiment, while a drop back toward the lower band may reinforce bearish sentiment.
Volume Analysis: Friday’s trading session had average volumes, which stood at 291.5 Mn.
Derivatives Data: Options OI indicates strong Put writing at 24,600, following 24,500, establishing it as a firm support zone. On the upside, a significant Call OI buildup at 24,700 and 24,800 suggests a potential resistance supply. PCR (Put/Call Ratio) stands at 0.5352 (<1), leaning towards bullish sentiment and the Short covering signals a temporary short-term bullish move, with an overall neutral to positive outlook for the next trading session.
Bank Nifty
(In this analysis, we have used 20/50/100/200 EMAs, where 20 EMA (Red), 50 EMA (Orange), 100 EMA (Light Blue), and 200 EMA (Dark Blue)).
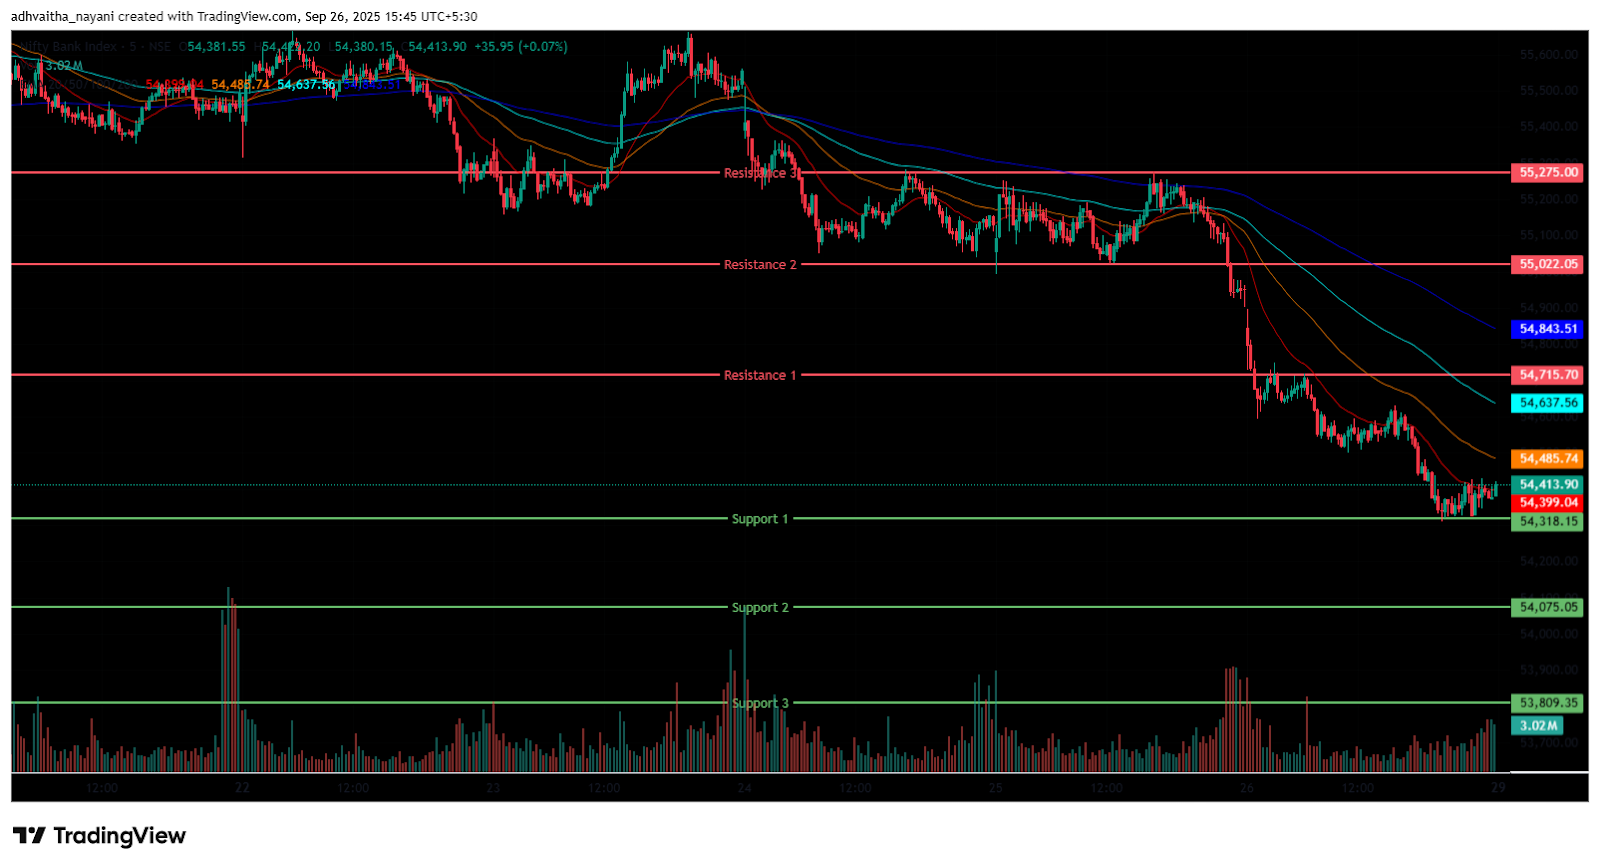
The Bank Nifty Index also started the session on a negative note at 54,797.90 on Friday, down by 178.3 points from Thursday’s closing of 54,976.20. The index was trading between the range of 54,500 and 54,900 in the morning session, indicating higher volatility. In addition, the index was trading below all four EMAs of 20/50/100/200 in the 15-minute time frame.
In the afternoon session, the Index further fell as low as the 54,311 level, marking its day’s low and was traded around the range of 54,300 and 54,650, ending in red. During the afternoon session, Bank Nifty closed below all four EMAs of 20/50/100/200 in the 15-minute time frame. Bank Nifty immediate resistance levels are R1 (54,716), R2 (55,022), and R3 (55,275), while immediate support levels are S1 (54,318), S2 (54,075), and S3 (53,809).
The Bank Nifty index had peaked at 54,897.00 and made a day’s low at 54,310.95. Finally, it had closed in red at 54,389.35, closing below the 54,400 level, losing 586.85 points or 1.07%. The Relative Strength Index (RSI) stood at 40.92 well below the overbought zone of 70 but near to the oversold zone in the daily time frame, and Bank Nifty closed above the EMA of 200 but below the 20/50/100 EMAs in the daily time frame.
Sensex
(In this analysis, we have used 20/50/100/200 EMAs, where 20 EMA (Red), 50 EMA (Orange), 100 EMA (Light Blue), and 200 EMA (Dark Blue)).
To view other technical reports, click here
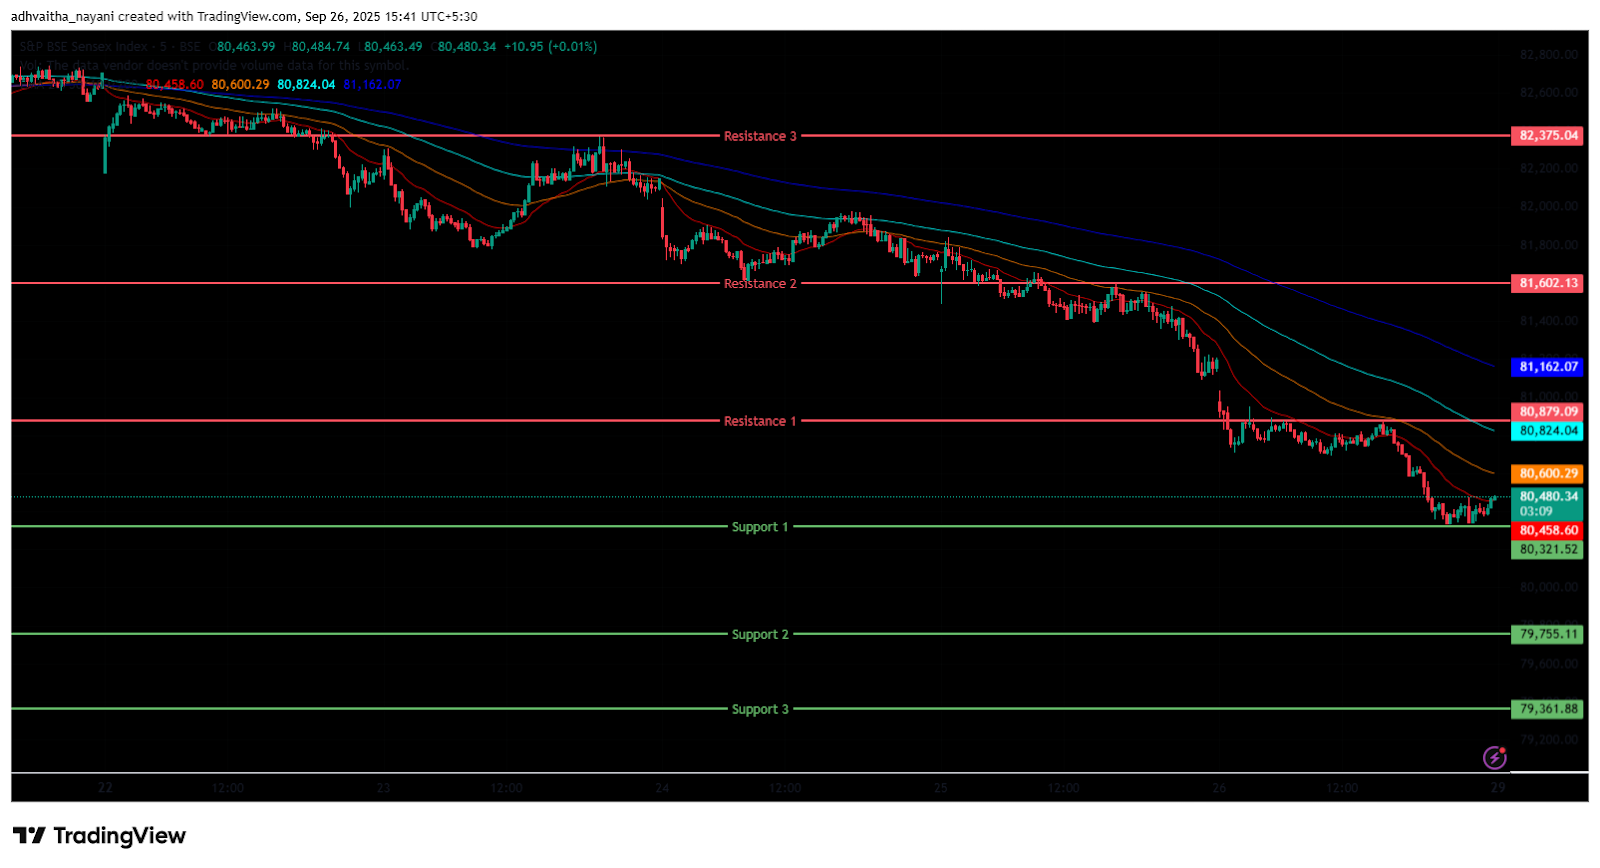
The BSE Sensex Index also opened on a negative note at 80,956.01 on Friday, down by 203.67 points from Thursday’s closing of 81,159.68. The index started its session on a bearish note and was trading in the 80,700 to 81,000 range throughout the morning session’s 15-minute time frame, below all four EMAs of the 20/50/100/200.
In the afternoon session, the Index was further dragged down, marking its day low at the 80,332 level and trading between the 80,300 and 80,900 levels, maintaining its overall bearish trend and closing below all four EMAs of 20/50/100/200 in the 15-minute time frame. BSE Sensex immediate resistance levels are R1 (80,879), R2 (81,602), and R3 (82,375), while immediate support levels are S1 (80,321), S2 (79,755), and S3 (79,362).
The BSE Sensex index had peaked at 81,033.09 and made a day’s low at 80,332.41. Finally, it had closed at 80,426.46 in red, losing 733.22 points or 0.90%. The Relative Strength Index (RSI) stood at 38.85 (below the overbought zone of 70 but near to the oversold zone in the daily time frame), and the BSE Sensex closed below all four EMAs of 20/50/100/200 in the daily time frame.
India VIX
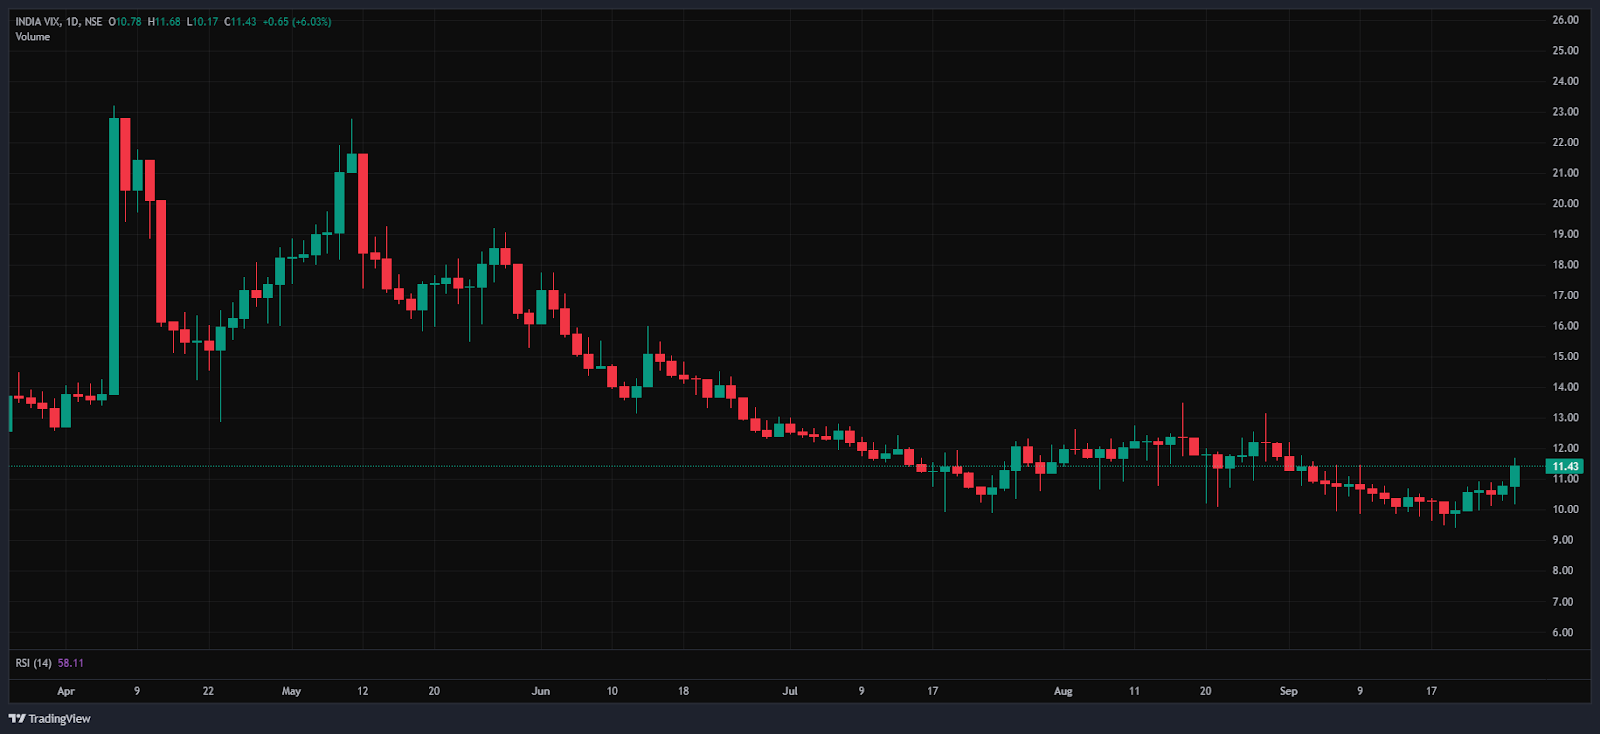
The India VIX increased by 0.64 points or 5.96%, from 10.78 to 11.42 during Friday’s session. An increase in the India VIX typically indicates higher price volatility in the stock market, suggesting a less stable market environment. However, a stable market environment and minimal volatility are anticipated when the India vix is below 15.
Market Recap on the 26th of September 2025
The Nifty 50 began Friday at 24,818.55, down -72.3 points from its previous closing of 24,890.85, below the 25,000 mark. It touched an intraday low of 24,629.45 before closing below the 25,000-mark at 24,654.7, down by -236.15 points, or -0.95%. Technically, the index dropped below the 20, 50, and 100-day EMAs while remaining above the 200-day EMA on the daily chart. With an opening price of 80,956.01, down -203.67 points from its previous close of 81,159.68, the BSE Sensex similarly showed a downward trend.
It followed the same path as the Nifty 50 and ended the day at 80,426.46, down -733.22 points, or -0.90%, below the 81,000 level. With the RSI for the Sensex at 38.85 and the Nifty 50 at 39.31, both well below the overbought threshold of 70 and close to the oversold zone, momentum indicators displayed moderate strength.
The Bank Nifty Index ended at 54,389.35, down -586.85 points, or -1.07%, to settle in negative territory. Friday saw the broad indices fall for the sixth straight session due to increased volatility, followed by Trump tariffs on Pharma, Kitchen cabinets, Bathroom vanities, and on Heavy Trucks caused weak investor sentiment.
On Friday, every sectoral index ended in the red. The Top loser was the Nifty Smallcap 50 Index, which ended the day at 8,434.8, down -228.35 points, or -2.6%. Other small-cap stocks, such as Neuland Labs Ltd, HFCL Ltd, and Hindustan Copper, fell by as much as -5.8%, while Laurus Labs Ltd fell -7.2%.
The Nifty IT index also fell, closing at 33,702 after dropping -846.3 points, or -2.5%. Persistent Systems Ltd, Coforge Ltd, and Oracle Financial Services all had declines of up to -4.4%. The Nifty India Defence index closed at 7,949.8, down -184.8 points, or -2.3%.
On Friday, Asian markets were also on a bearish trend. The Hang Seng Index of Hong Kong closed at 26,128.2, down -356.48 points, or -1.35%. In contrast, China’s Shanghai Composite Index fell -25.19 points, or -0.65%, to 3,828.10. The KOSPI Index for South Korea ended the day at 3,386.05, down -85.06 points, or -2.45%. Conversely, Japan’s Nikkei 225 Index ended at 45,355, down -399.94 points, or -0.87%. US Dow Jones Futures were down 61 points, or 0.13%, at 46,329 as of 4:12 p.m. IST. The Nifty index fell -2.5%, or -631.8 points, this week, ending below the 25,000 mark.
Trade Setup Summary
The Nifty 50 opened on a negative note at 24,818.55 on Friday and ended the session in the red below the 24,700 level at 24,654.70. A break below 24,624 could trigger further selling towards 24,521 while breaking the next resistance level of 24,794 could trigger bullishness towards the 24,958 level.
Bank Nifty started the session on a negative note at 54,797.90 and ended the session in the red at 54,389.35, below the 54,400 level. A break below 54,318 could trigger further selling towards 54,075, while breaking the next resistance level of 54,716 could trigger bullishness towards the 55,022 level.
Sensex also opened on a negative note at 80,956.01 and ended the session in the red at 80,426.46, below the 80,500 level. A break below 80,321 could trigger further selling towards 79,755, while breaking the next resistance level of 80,879 could lead towards the 81,602 level.
Given the ongoing volatility and mixed sentiments, it’s advisable to avoid aggressive positions and wait for clear directional moves above resistance or below support. Traders should consider these key support and resistance levels when entering long or short positions following the price break from these critical levels. Additionally, traders can combine moving averages to identify more accurate entry and exit points.
Disclaimer

The views and investment tips expressed by investment experts/broking houses/rating agencies on tradebrains.in are their own, and not that of the website or its management. Investing in equities poses a risk of financial losses. Investors must therefore exercise due caution while investing or trading in stocks. Trade Brains Technologies Private Limited or the author are not liable for any losses caused as a result of the decision based on this article. Please consult your investment advisor before investing.
About: Trade Brains Portal is a stock analysis platform. Its trade name is Dailyraven Technologies Private Limited, and its SEBI-registered research analyst registration number is INH000015729.
Investments in securities are subject to market risks. Read all the related documents carefully before investing.
Registration granted by SEBI and certification from NISM in no way guarantee performance of the intermediary or provide any assurance of returns to investors.
