
![]()
![]()
Monday’s trading session reflected a strong shift in market sentiment, opening on a bullish note after three consecutive sessions of decline. Investor confidence was buoyed by India’s robust GDP growth, which came in above market expectations, helping to drive a broad-based rally across the indices. Benchmark indices ended the day with healthy gains, suggesting renewed optimism despite lingering concerns reflected in some technical indicators. While the indices remained below key short-term moving averages, they held firm above longer-term support levels, indicating a degree of resilience in the current trend.

The positive sentiment was echoed across most sectoral indices, with particularly strong momentum seen in the auto and consumer durable segments, as key stocks posted impressive gains. Broader markets also participated in the upswing, with midcap and smallcap indices registering notable advances. However, not all sectors shared in the enthusiasm-media and pharma stocks came under mild pressure, suggesting selective profit booking and cautious rotation. Global cues were mixed, but largely did not dampen domestic optimism. Overall, the market mood turned positive, underpinned by encouraging economic fundamentals and widespread buying interest.

In this overview, we will analyse the key technical levels and trend directions for Nifty and BSE Sensex to monitor in the upcoming trading sessions. All the charts mentioned below are based on the 5-minute timeframe.
Nifty 50
(In this analysis, we have used 20/50/100/200 EMAs, where 20 EMA (Red), 50 EMA (Orange), 100 EMA (Light Blue), and 200 EMA (Dark Blue)).
To view other technical reports, click here
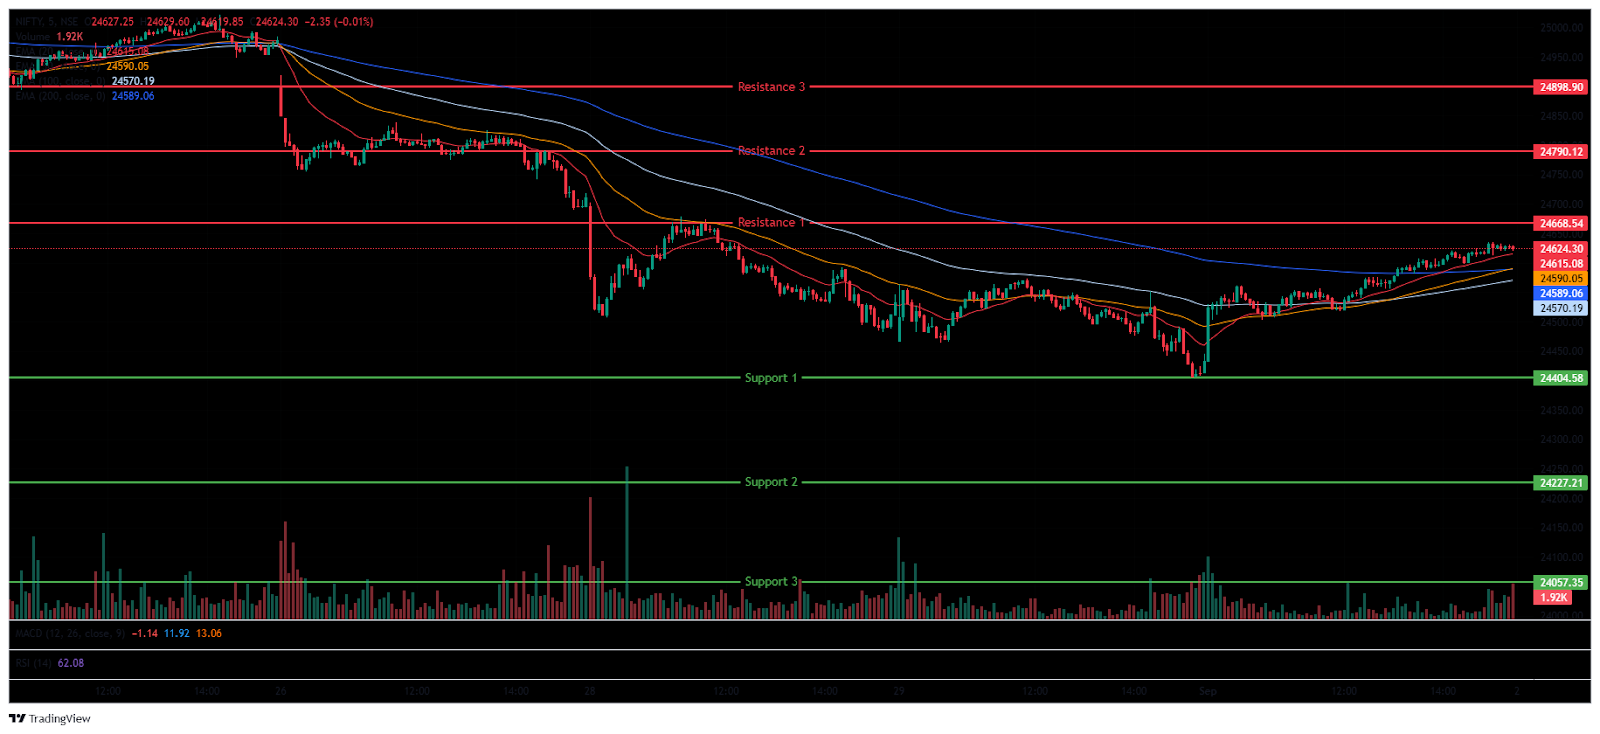
The Nifty 50 Index opened on a positive note at 24,432.70 on Monday, up by 5.85 points from Friday’s closing of 24,426.85. The Nifty Index, which began the morning session on a bullish note, surged above the 24,550 mark and rebounded from the previous day’s close. The Index was traded above its opening level at 24,564. During the morning session, the index traded below the EMAs of 100/200 but remained above the 20/50 EMAs in the 15-minute time frame and was trading between 24,450 and 24,550. In the afternoon session, the index gained its momentum and pulled up from the 24,550 level to the 24,600 level; the Nifty Index held above the 24,600 level, trading in green.
Overall, the Monday session saw the Nifty 50 in a bullish state. During the afternoon session, the Nifty 50 was traded below the EMAs of 100/200 but remained above the 20/50 EMAs in the 15-minute time frame. Nifty’s immediate resistance levels are R1 (24,668), R2 (24,790), and R3 (24,899), while immediate support levels are S1 (24,405), S2 (24,227), and S3 (24,057).
The Nifty index had reached a day’s high at 24,635.60, ended in green above the 24,600 level, and saw a day’s low at 24,432.70. Finally, it had closed at 24,625.05, gaining 198.20 points, or 0.81%. The Relative Strength Index (RSI) stood at 45.5 (below the overbought zone of 70 but nearing the oversold zone in the daily time frame), and the Nifty 50 closed below the 20/50/100 EMAs but remained above the 200 EMAs in the daily time frame.
Bank Nifty
(In this analysis, we have used 20/50/100/200 EMAs, where 20 EMA (Red), 50 EMA (Orange), 100 EMA (Light Blue), and 200 EMA (Dark Blue)).
The Bank Nifty Index started the session on a flat note at 53,658.15 on Monday. The index surged to the 53,900 mark in the first 15-minute candle, later consolidated and sustained above 53,860, and traded above its opening level. The index traded below the EMAs of 50/100/200 but remained above the 20 EMA in the 15-minute time frame and was trading between 53,700 and 54,000 levels in the morning session.
The Bank Nifty index further gained its momentum and surged to the day’s high at the 54,000 mark during the afternoon session and traded in the green. During the afternoon session, Bank Nifty closed above the EMAs of 20/50 but remained below the 100/200 in the 15-minute time frame. Bank Nifty immediate resistance levels are R1 (54,313), R2 (55,008), and R3 (55,607), while immediate support levels are S1 (53,653), S2 (53,145), and S3 (52,783).
The Bank Nifty index had peaked at 54,035.85 and made a day’s low at 53,658.15. Finally, it had closed in green at 54,002.45, breaking above the 54,000 level, gaining 346.80 points or 0.65%. The Relative Strength Index (RSI) stood at 33.39 and entered the oversold zone in the daily time frame, and Bank Nifty closed below the EMAs of 20/50/100 but remained above the 200 EMA in the daily time frame.
Sensex
(In this analysis, we have used 20/50/100/200 EMAs, where 20 EMA (Red), 50 EMA (Orange), 100 EMA (Light Blue), and 200 EMA (Dark Blue)).
To view other technical reports, click here
The BSE Sensex Index opened on a positive note at 79,828.99 on Monday, up by 19.34 points from Friday’s closing of 79,809.65. The Index was more volatile in the morning session; after a bullish start, the Index surged above the 80,150 mark and was trading above its opening level in the morning session at 80,210 and was traded below the EMAs of 50/100/20 EMA but remained above the 20 EMA in the 15-minute time frame and was trading between 79,800 and 80,250 in the morning session.
The Sensex Index gained its momentum and surged to the 80,400 mark in the afternoon session but held above the 80,350 mark, maintaining its overall positive trend, and was trading below the EMAs of the 100/200 EMA but remained above the 20/50 EMA in the 15-minute time frame. BSE Sensex immediate resistance levels are R1 (80,472), R2 (80,856), and R3 (81,375), while immediate support levels are S1 (79,997), S2 (79,343), and S3 (78,784).
The BSE Sensex index had peaked at 80,406.84 and made a day’s low at 79,818.38. Finally, it had closed at 80,364.49 in green, gaining 554.84 points, or 0.70%. The Relative Strength Index (RSI) stood at 43.48 (below the overbought zone of 70 but nearing the oversold zone in the daily time frame), and the BSE Sensex closed below the EMAs of 20/50/100 but remained above the 200 EMA in the daily time frame.
India VIX
The India VIX decreased 0.46 points or 3.91%, from 11.75 to 11.29 during Monday’s session. A decrease in the India VIX indicates calm and stable market conditions.
Market Recap on the 1st of September 2025
Monday’s trading session kicked off on a bullish note, with broader market indices closing in the green after three consecutive days of losses. The Nifty 50 opened slightly higher at 24,432.70, up 5.85 points from the previous close of 24,426.85, and continued to climb, ending the day at 24,625.05. This marked a gain of 198.20 points or 0.81%, with the index finishing below the 20/50-day/100-day EMAs but remaining above the 200-day EMA on the daily chart. The BSE Sensex followed a similar trajectory, opening at 79,828.99 and closing at 80,364.49, rising by 554.84 points or 0.70%.
Momentum indicators reflected weakening sentiment. The Nifty 50’s Relative Strength Index (RSI) stood at 45.50, while the Sensex RSI was at 43.48, both well below the overbought threshold of 70. The Bank Nifty Index also saw gains, closing at 54,002.45 despite shedding 346.80 points or 0.65%. This overall rise was supported by stronger-than-expected GDP growth, as India posted Q1FY26 growth of 7.8%.
Most sectoral indices ended the day in positive territory. The Nifty Auto Index led the gains, closing at 25,660.00, up 699.15 points or 2.80%. Tube Investments of India Ltd was the top performer, gaining 6.05%, followed by Samvardhana Motherson International with a 4.30% increase, and Exide Industries Ltd, which rose 4.04%. The Nifty Consumer Durable Index was another top gainer, ending at 39,393.95, up 803.00 points or 2.08%. Dixon Technologies led the advance with a gain of 5.34%, while Amber Enterprises rose 5.00% and PG Electroplast Ltd climbed 4.10%. Indices such as the Nifty Midcap 50, Nifty Smallcap 50, and Nifty PSE also advanced, with gains of up to 2.03%.
On the downside, the Nifty Media Index was the biggest loser during Monday’s session, falling 5.15 points or 0.32% to close at 1,606.85. Zee Entertainment dropped 1.79%, Hathway Cable declined 0.82%, and Tips Music Ltd slipped 0.58%. Another underperformer was the Nifty Pharma Index, which fell to 21,778.85, down 25.20 points or 0.12%. Key laggards included Sun Pharmaceutical, Ajanta Pharma, and Ipca Laboratories Ltd, with declines of up to 1.96%.
Asian markets ended on a mixed note. The Shanghai Composite Index closed at 3,875.53, up 17.60 points or 0.45%. In contrast, South Korea’s KOSPI Index fell to 3,142.93, down 43.08 points or 1.37%, and Japan’s Nikkei 225 Index declined to 42,145.00, losing 573.47 points or 1.36%. Meanwhile, Hong Kong’s Hang Seng Index posted strong gains, ending at 25,629.00, up 551.38 points or 2.15%. As of 4:50 p.m. IST, US Dow Jones Futures were trading at 45,548.80, up by 4.91 points or 0.01%.
Trade Setup Summary
The Nifty 50 opened on a positive note at 24,432.70 on Monday and ended the day in green above the 24,600 level at 24,625.05. A break below 24,405 could trigger further selling towards 24,227, while a break above 24,668 could trigger bullishness towards 24,790.
Bank Nifty started the session on a flat note at 53,658.15 and ended the session at 54,002.45 in green, above the 54,000 level. A break below 53,653 could trigger further selling towards 53,145, while a break above 54,313 could trigger bullishness towards 55,008.
Sensex opened on a positive note at 79,828.99 on Monday and ended in the green at 80,364.49, breaking above the 80,350 level. A break below 79,997 could trigger further selling towards 79,343, while breaking the next resistance level of 80,472 could lead towards the 80,856 level.
Given the ongoing volatility and mixed sentiments, it’s advisable to avoid aggressive positions and wait for clear directional moves above resistance or below support. Traders should consider these key support and resistance levels when entering long or short positions following the price break from these critical levels. Additionally, traders can combine moving averages to identify more accurate entry and exit points.
Disclaimer

The views and investment tips expressed by investment experts/broking houses/rating agencies on tradebrains.in are their own, and not that of the website or its management. Investing in equities poses a risk of financial losses. Investors must therefore exercise due caution while investing or trading in stocks. Trade Brains Technologies Private Limited or the author are not liable for any losses caused as a result of the decision based on this article. Please consult your investment advisor before investing.
About: Trade Brains Portal is a stock analysis platform. Its trade name is Dailyraven Technologies Private Limited, and its SEBI-registered research analyst registration number is INH000015729.
Investments in securities are subject to market risks. Read all the related documents carefully before investing.
Registration granted by SEBI and certification from NISM in no way guarantee performance of the intermediary or provide any assurance of returns to investors.

