On Wednesday, Indian equity markets saw a positive session, with major indices opening higher and maintaining upward momentum throughout the day. Both the Nifty 50 and BSE Sensex traded above key technical support levels, reflecting strong investor confidence. Broad market sentiment was bolstered by optimism surrounding a potential trade agreement between India and the United States, as well as cautious anticipation ahead of the U.S. Federal Reserve’s policy announcement. Technical indicators suggested that the markets were in an overbought zone, highlighting strong buying interest.
Sectoral performance was mixed, with energy and oil & gas segments leading the gains, driven by major corporate developments and strategic partnerships in the sector. In contrast, the automobile sector faced selling pressure, resulting in a modest decline. Asian markets largely mirrored the positive trend seen in India, with select indices posting solid gains, while U.S. futures indicated a higher opening, suggesting a continued positive bias in global markets.
In this overview, we will analyse the key technical levels and trend directions for Nifty and BSE Sensex to monitor in the upcoming trading sessions. All the charts mentioned below are based on the 5-minute timeframe.
Nifty 50
(In this analysis, we have used 20/50/100/200 EMAs, where 20 EMA (Red), 50 EMA (Orange), 100 EMA (Light Blue), and 200 EMA (Dark Blue)).
To view other technical reports, click here
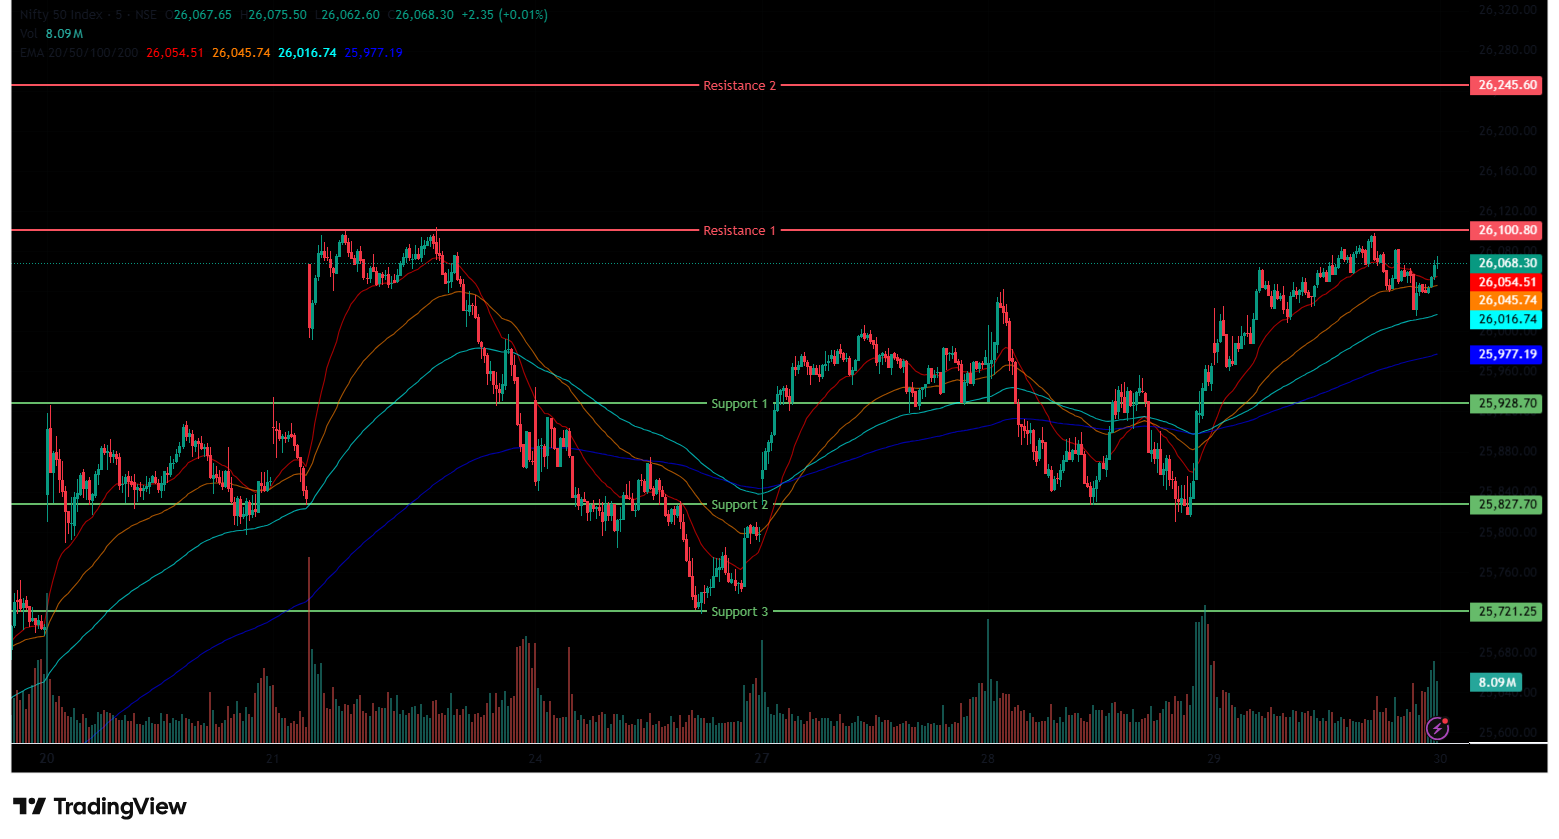
The Nifty 50 Index opened on a positive note at 25,982.00 on Wednesday, up by 45.8 points from Tuesday’s closing of 25,936.20. The index opened on a bullish note and surged above the 26,000 level in the morning session. During the morning session, the index traded within the 25,950-26,100 range, staying above all four EMAs (20/50/100/200) on the 15-minute chart.
In the afternoon, the index continued its positive momentum and surged as high as 26,098, marking its day high. Overall, the Index traded within a 26,000-26,100 range throughout the session. During the afternoon session, the Nifty 50 closed above all four EMAs of 20/50/100/200 in the 15-minute time frame. The Nifty’s immediate resistance levels are R1 (26,101) and R2 (26,246), while immediate support levels are S1 (25,929), S2 (25,828) and S3 (25,721).
The Nifty index had reached a day’s high at 26,097.85 and saw a day’s low at 25,960.30. Finally, it had closed at 26,053.90, in the green above the 26,050 level, gaining 117.7 points, or 0.45%. The Nifty 50 closed above all four EMAs of 20/50/100/200 in the daily time frame.
Momentum Indicators
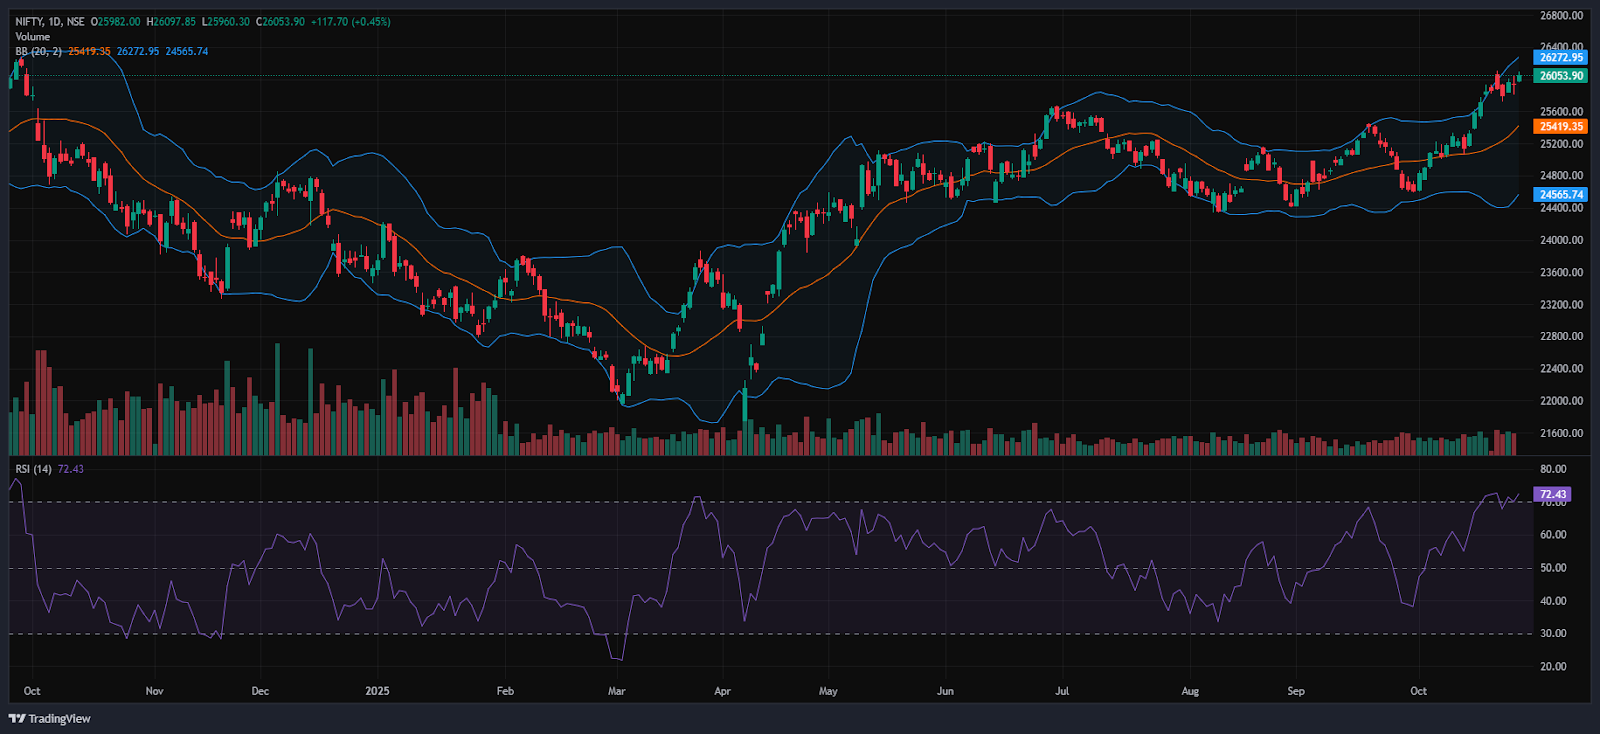
RSI (Daily): The Nifty 50’s RSI stood at 72.43, which is above the overbought zone of 70, indicating potential for a reversal.
Bollinger Bands (Daily): The index is trading in the upper band of the Bollinger Band range above the middle band (Simple Moving Average). Its position in the upper range indicates a bullish sentiment, and the Index formed a bullish candle in the daily time frame after an indecision candle formed in the previous session and took support near 25,960 and 26,098 acted as a resistance level. A sustained move above the middle band signals a bullish sentiment, while a drop back toward the lower band may reinforce bearish sentiment.
Volume Analysis: Wednesday’s trading session had an above-average volume of 321.88 Mn.
Derivatives Data: Options OI indicates strong Put writing at 26,000, followed by 25,900, establishing it as a firm support zone. On the upside, a significant Call OI buildup at 26,100 and 26,200 suggests a potential resistance supply. PCR (Put/Call Ratio) stands at 1.06 (>=1), leaning towards neutral sentiment, and the Long Buildup indicates a Strong Bullish outlook, with an overall neutral to bullish outlook for the next trading session.
Bank Nifty
(In this analysis, we have used 20/50/100/200 EMAs, where 20 EMA (Red), 50 EMA (Orange), 100 EMA (Light Blue), and 200 EMA (Dark Blue)).
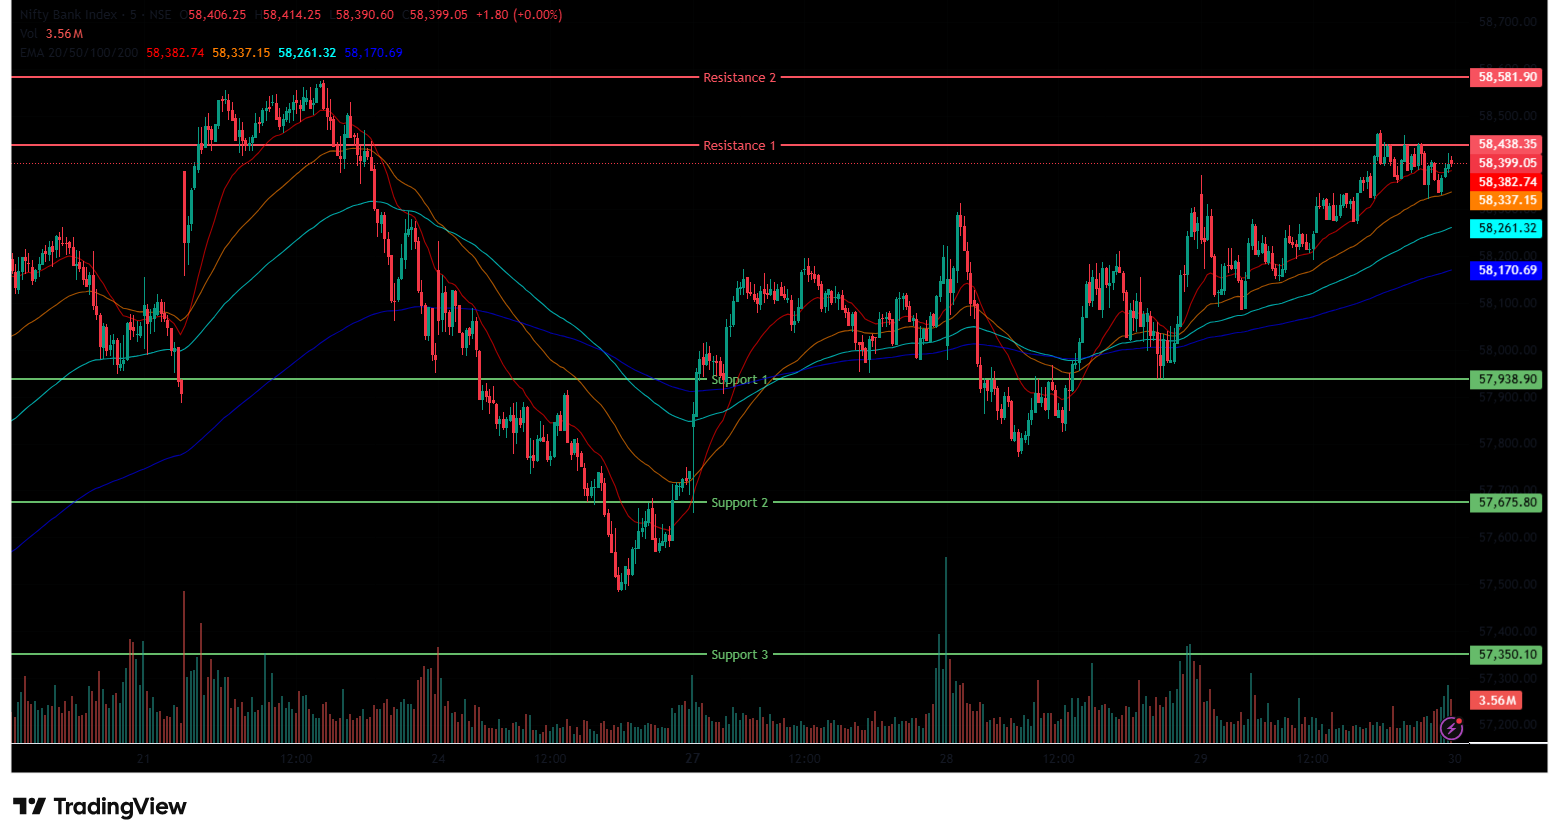
The Bank Nifty Index started the session on a positive note at 58,316.25 on Wednesday, up by 102.15 points from Tuesday’s closing of 58,214.10. The index started on a Bullish note, but dragged down to the 58,087 level, marking its day low and was trading in the range of 58,050-58,400. In addition, the index was trading above all four EMAs of 20/50/100/200 in the 15-minute time frame in the morning session.
In the afternoon session, the Index continued its momentum and surged as high as 58,470 marking its day high. Further, the Index was trading in the range of 58,250-58,500, ended in green. During the afternoon session, Bank Nifty closed above all four EMAs of 20/50/100/200 in the 15-minute time frame. The Bank Nifty’s immediate resistance levels are R1 (58,438) and R2 (58,582), while immediate support levels are S1 (57,939), S2 (57,676), and S3 (57,350).
The Bank Nifty index had peaked at 58,469.90 and made a day’s low at 58,087.05. Finally, it had closed in green at 58,385.25, closing above the 58,350 level, gaining 171.15 points or 0.29%. The Relative Strength Index (RSI) stood at 74.19, above the overbought zone of 70 in the daily time frame, and Bank Nifty closed above all four EMAs of 20/50/100/200 in the daily time frame.
Sensex
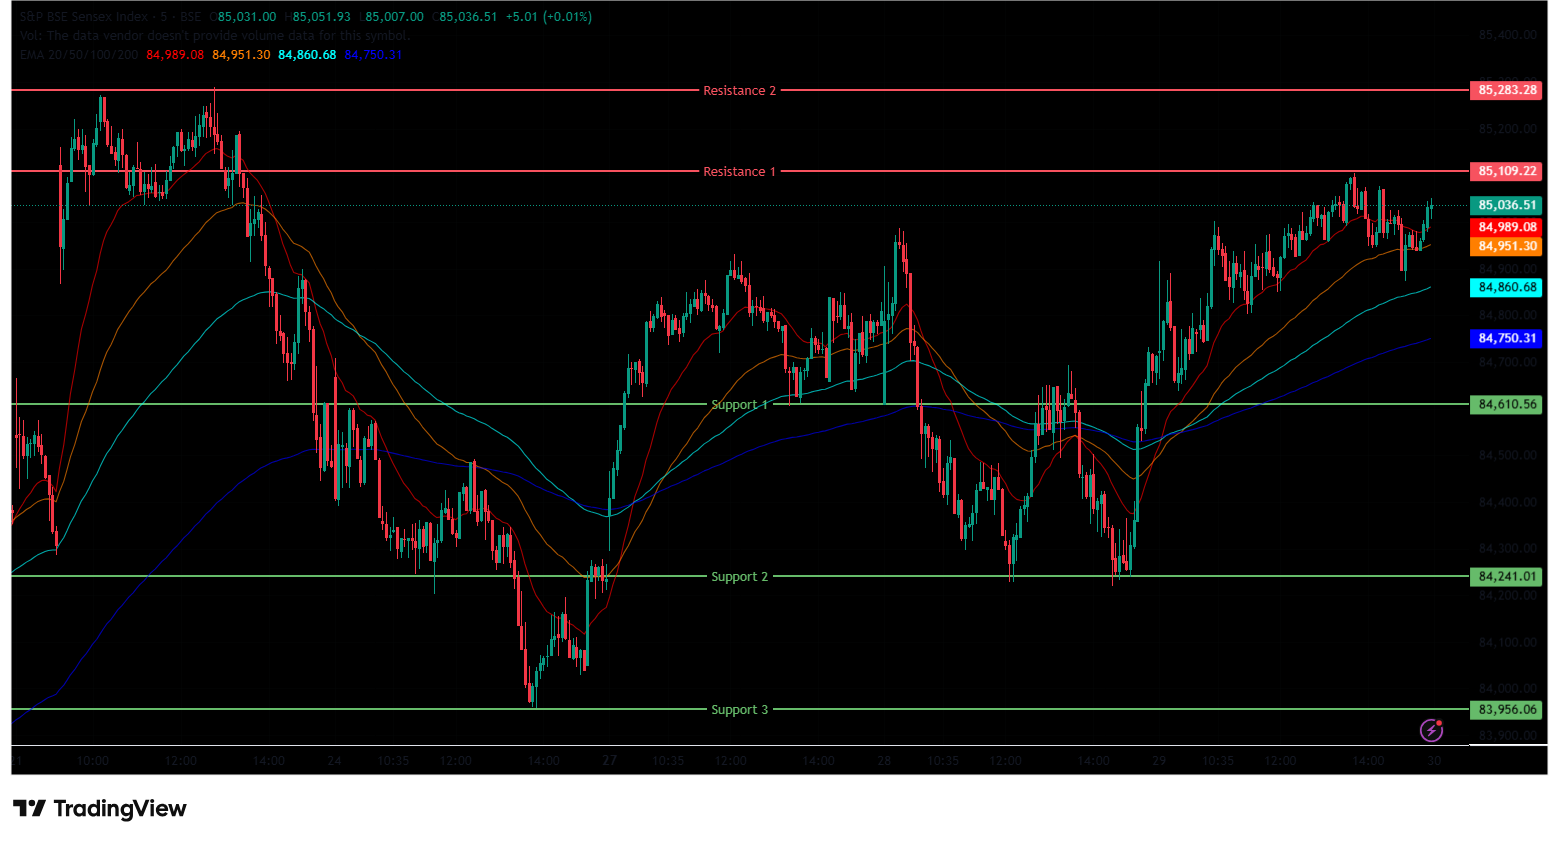
(In this analysis, we have used 20/50/100/200 EMAs, where 20 EMA (Red), 50 EMA (Orange), 100 EMA (Light Blue), and 200 EMA (Dark Blue)).
To view other technical reports, click here
The BSE Sensex Index also opened on a positive note at 84,663.68 on Wednesday, up by 35.52 points from Tuesday’s closing of 84,628.16. The index started its session on a bullish note and surged above the 85,000 mark. The Index was trading within the 84,600-85,050 range and was trading above the EMAs of 20/50/100/200 in the 15-minute time frame in the morning session.
In the afternoon session, the Index continued its bullish momentum and surged as high as 85,105, marking its day high. The Index was trading in the 84,850-85,150 range, maintaining its overall bullish trend and closed above all four EMAs of 20/50/100/200 in the 15-minute time frame. The BSE Sensex immediate resistance levels are R1 (85,109) and R2 (85,283), while immediate support levels are S1 (84,611), S2 (84,241), and S3 (83,956).
The BSE Sensex index had peaked at 85,105.83 and made a day’s low at 84,638.68. Finally, it had closed at 84,997.13 in green, gaining 368.98 points or 0.44%. The Relative Strength Index (RSI) stood at 71.48, above the overbought zone of 70 in the daily time frame, and the BSE Sensex closed above all four EMAs of 20/50/100/200 in the daily time frame.
India VIX
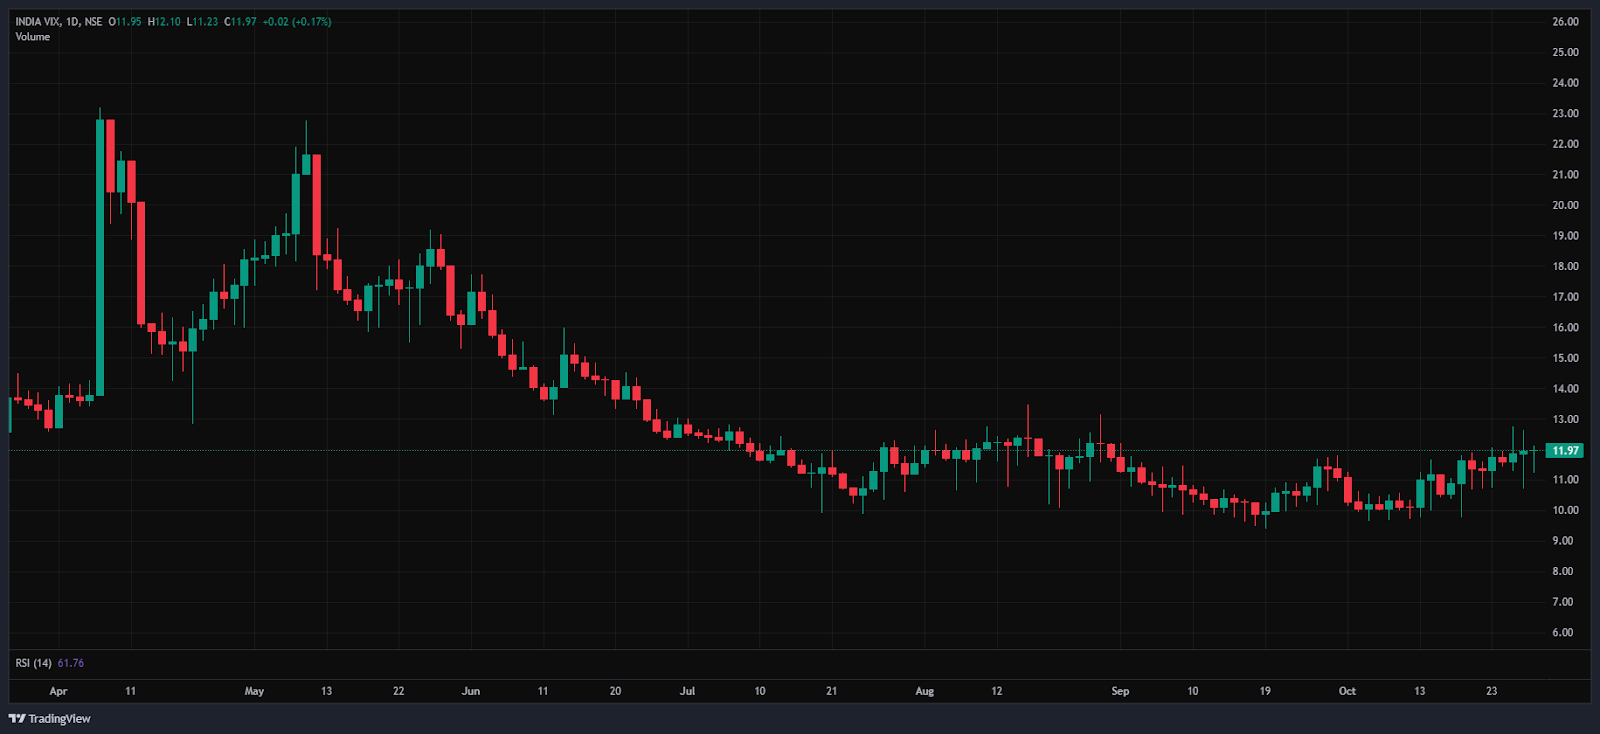
The India VIX increased by 0.02 points or 0.17%, from 11.95 to 11.97 during Wednesday’s session. An increase in the India VIX typically indicates higher price volatility in the stock market, suggesting a less stable market environment. However, a stable market environment and minimal volatility are anticipated when the India VIX is below 15.
Market Recap – 29th October 2025
On Wednesday, the Nifty 50 opened slightly higher at 25,939.95, up 21.7 points from its previous close of 25,936.2. The index hit an intraday high of 26,097.85, rising above the 26,000 level, closing at 26,053.9, up 117.7 points, or 0.45%. The index remained above all key moving averages (20/50/100/200-day EMAs) on the daily chart, indicating some technical support.
The BSE Sensex mirrored the Nifty’s trend, opening at 84,663.68, up 35.52 points from the previous close of 84,628.16. It followed a similar pattern, closing at 84,997.13, a gain of 368.98 points, or 0.44%. Both indices showed high momentum, with RSI values for Nifty 50 at 72.43 and Sensex at 71.48, crossing the overbought threshold of 70. Investor sentiment stayed upbeat ahead of the US Federal Reserve’s policy announcement later tonight, supported by optimism over a possible trade agreement between India and the United States.
The majority of indices remained positive on Wednesday. The Nifty Oil & Gas index was the biggest gainer, rising 2.1% or 249.35 points, and standing at 11,995.95. The reason for the index gain was that Oil India and BPCL entered into a collaborative framework for building the Rs 1 Lakh crore Integrated Ramayapatnam Greenfield Refinery & Petrochemical, the first in South India.
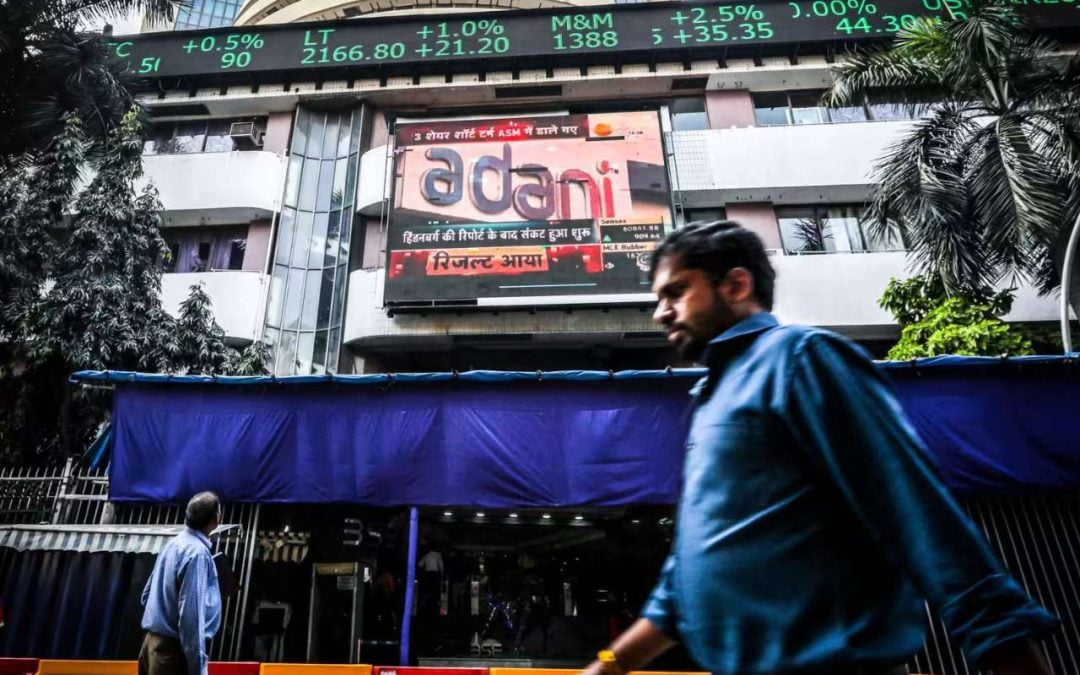
Stocks such as Indian Oil Corporation Ltd jumped 5.6% on Wednesday. While other oil & gas stocks like Hindustan Petroleum Ltd, GAIL India Ltd, and Bharat Petroleum also gained up to 3.7%. The Nifty Energy was also among the major gainers, rising 1.9% or 689.8 points, and standing at 36,347.95. Stocks such as Adani Green Energy Ltd rose 10.8%, followed by Reliance Power and Indian Oil Corporation, which gained up to 6% on Wednesday.
The Nifty Auto Index was the biggest and only loser on Wednesday, falling -0.73%, or -199.45 points, to 26,948.90. Auto Stocks like Bosch Ltd, TVS Motor Company Ltd, Mahindra & Mahindra Ltd, and Maruti Suzuki India Ltd saw declines of up to -3.01%.
Asian markets were broadly positive on Wednesday. Japan’s Nikkei 225 increased by 1,110.82 points or 2.16%, closing at 51,330. While China’s Shanghai Composite also rose by 28.11 points, or 0.70%, to 4,016.33. Conversely, Singapore’s Straits Times Index declined by 10.15 points or 0.23%, finishing at 4,440.21, but South Korea’s KOSPI increased by 70.74 points or 1.73%, closing at 4,081.15. At 4:44 p.m. IST, U.S. Dow Jones Futures were higher, up 0.21%, at 47,806.20, gaining 99.83 points.
Trade Setup Summary
The Nifty 50 opened on a positive note at 25,982.00 on Wednesday and ended the session in the green above the 26,050 level at 26,053.90. A break below 25,929 could trigger further selling towards 25,828, while breaking the next resistance level of 26,101 could trigger bullishness towards the 26,246 level.
Bank Nifty also started the session on a positive note at 58,316.25 and ended the session in the green at 58,385.25, above the 58,350 level. A break below 57,939 could trigger further selling towards 57,676, while breaking the next resistance level of 58,438 could trigger bullishness towards the 58,582 level.
Sensex also opened on a positive note at 84,663.68 and ended the session in the green at 84,997.13, below the 84,950 level. A break below 84,611 could trigger further selling towards 84,241, while breaking the next resistance level of 85,109 could trigger bullishness towards the 85,283 level.
Given the ongoing volatility and mixed sentiments, it’s advisable to avoid aggressive positions and wait for clear directional moves above resistance or below support. Traders should consider these key support and resistance levels when entering long or short positions following the price break from these critical levels. Additionally, traders can combine moving averages to identify more accurate entry and exit points.
Disclaimer

The views and investment tips expressed by investment experts/broking houses/rating agencies on tradebrains.in are their own, and not that of the website or its management. Investing in equities poses a risk of financial losses. Investors must therefore exercise due caution while investing or trading in stocks. Trade Brains Technologies Private Limited or the author are not liable for any losses caused as a result of the decision based on this article. Please consult your investment advisor before investing.
About: Trade Brains Portal is a stock analysis platform. Its trade name is Dailyraven Technologies Private Limited, and its SEBI-registered research analyst registration number is INH000015729.
Investments in securities are subject to market risks. Read all the related documents carefully before investing.
Registration granted by SEBI and certification from NISM in no way guarantee performance of the intermediary or provide any assurance of returns to investors.
