The equity market opened on a positive note but soon lost momentum, with both the Nifty 50 and Sensex slipping into negative territory by the close. Despite staying above key moving averages, the broader trend reflected caution, as investors grew wary ahead of the looming tariff deadline and awaited fresh domestic cues.
The mood across sectors was largely subdued. Realty and financial stocks led the decline, weighed down by profit booking and valuation concerns. Within the financial space, both private and public sector banking stocks witnessed selling pressure. The real estate sector faced headwinds, dragged down by weakness in key mid- and large-cap players. Metal stocks staged a notable rebound, supported by renewed buying interest and strength in global commodity trends. Consumer durable stocks also gained, helped by positive company-specific developments and steady demand expectations.
Market participants appeared to be in a wait-and-watch mode, shifting focus to the upcoming corporate earnings season. While global cues remained mixed, resilience in macroeconomic indicators like inflation trends, policy rates, and government spending continued to offer some underlying support to sentiment. Asian markets presented a mixed picture, reflecting a cautious global risk environment. Meanwhile, U.S. futures hinted at a mildly optimistic start for Wall Street.
In this overview, we will analyze the key technical levels and trend directions for Nifty and BSE Sensex to monitor in the upcoming trading sessions. All the charts mentioned below are based on the 5-minute timeframe.
NIFTY 50 Chart & Price Action Analysis
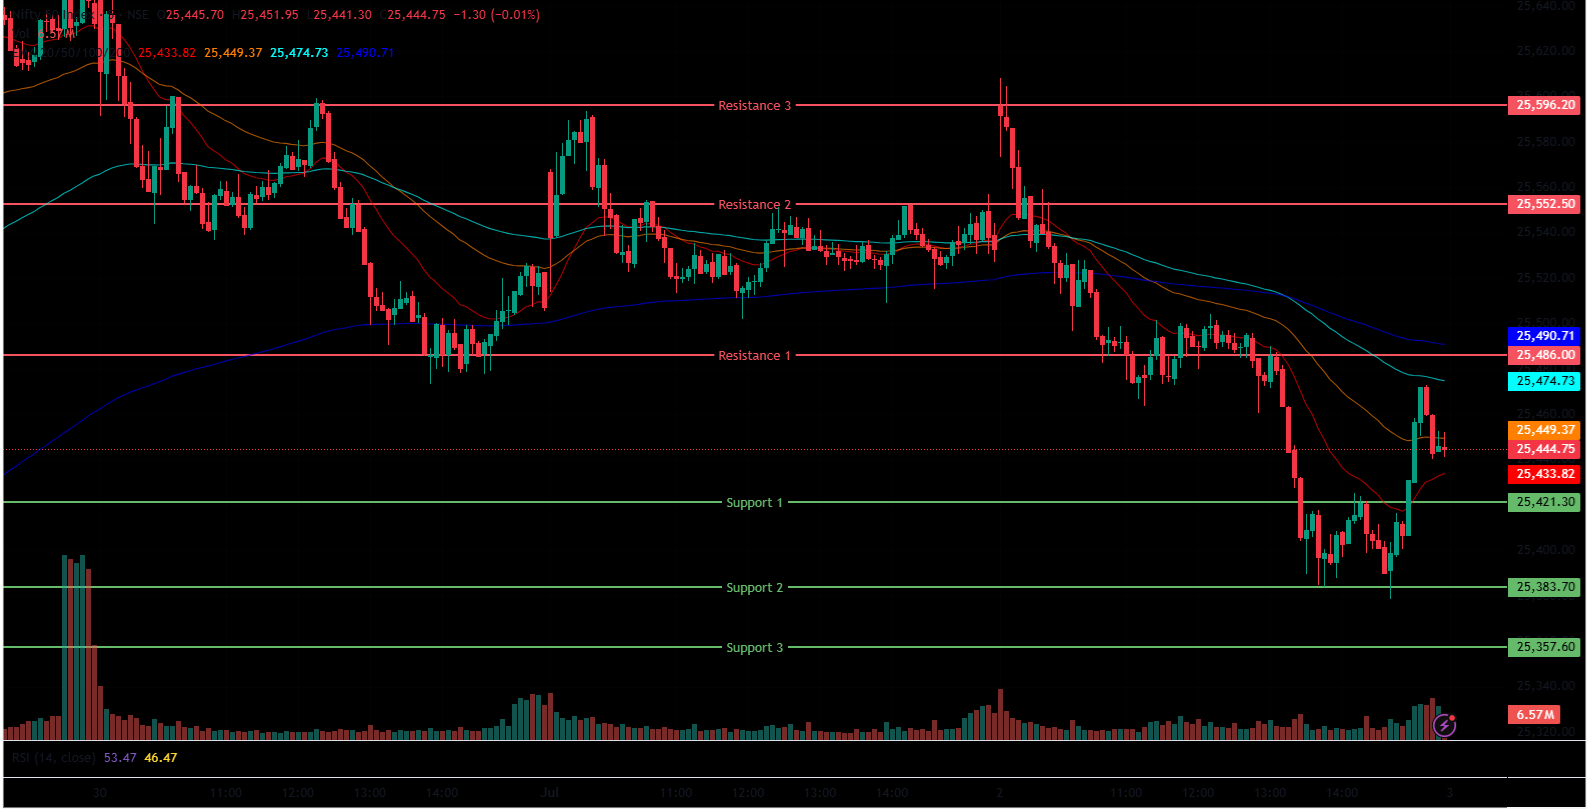
(In this analysis, we have used 20/50/100/200 EMAs, where 20 EMA (Red), 50 EMA (Orange), 100 EMA (Light Blue), 200 EMA (Dark Blue)).
The Nifty 50 Index opened on a slightly positive note at 25,588.30 on Wednesday, up by 46.5 points from Tuesday’s closing of 25,541.80. The Nifty Index traded in the red in the morning session, dragged down to 25,494 level. It was trading below the opening level, declining below 25,500 level, and was above 100/200 EMAs but below 20/50 EMAs in the 15-minute time frame in the morning session. In the afternoon session, the Nifty Index made a day’s low but rebounded from day’s low and closed in red at 25,453.40. It stayed above 200 EMAs but below in 20/50/100 EMAs in the 15-minute time frame. Nifty’s immediate resistance levels are R1 (25,486), R2 (25,553), and R3 (25,596), while immediate support levels are S1 (25,421), S2 (25,384), and S3 (25,358).
The Nifty index had reached a day’s high at 25,608.10, closed in red below the 25,500 mark, and saw a day’s low at 25,378.75. Finally, it had closed above the day’s low at 25,453.40, losing 88.4 points or 0.35%. The Relative Strength Index (RSI) stood at 61.34 (below the overbought zone of 70) in the daily time frame, and Nifty 50 closed above the four 20/50/100/200 EMAs in the daily time frame.
Bank Nifty Chart & Price Action Analysis
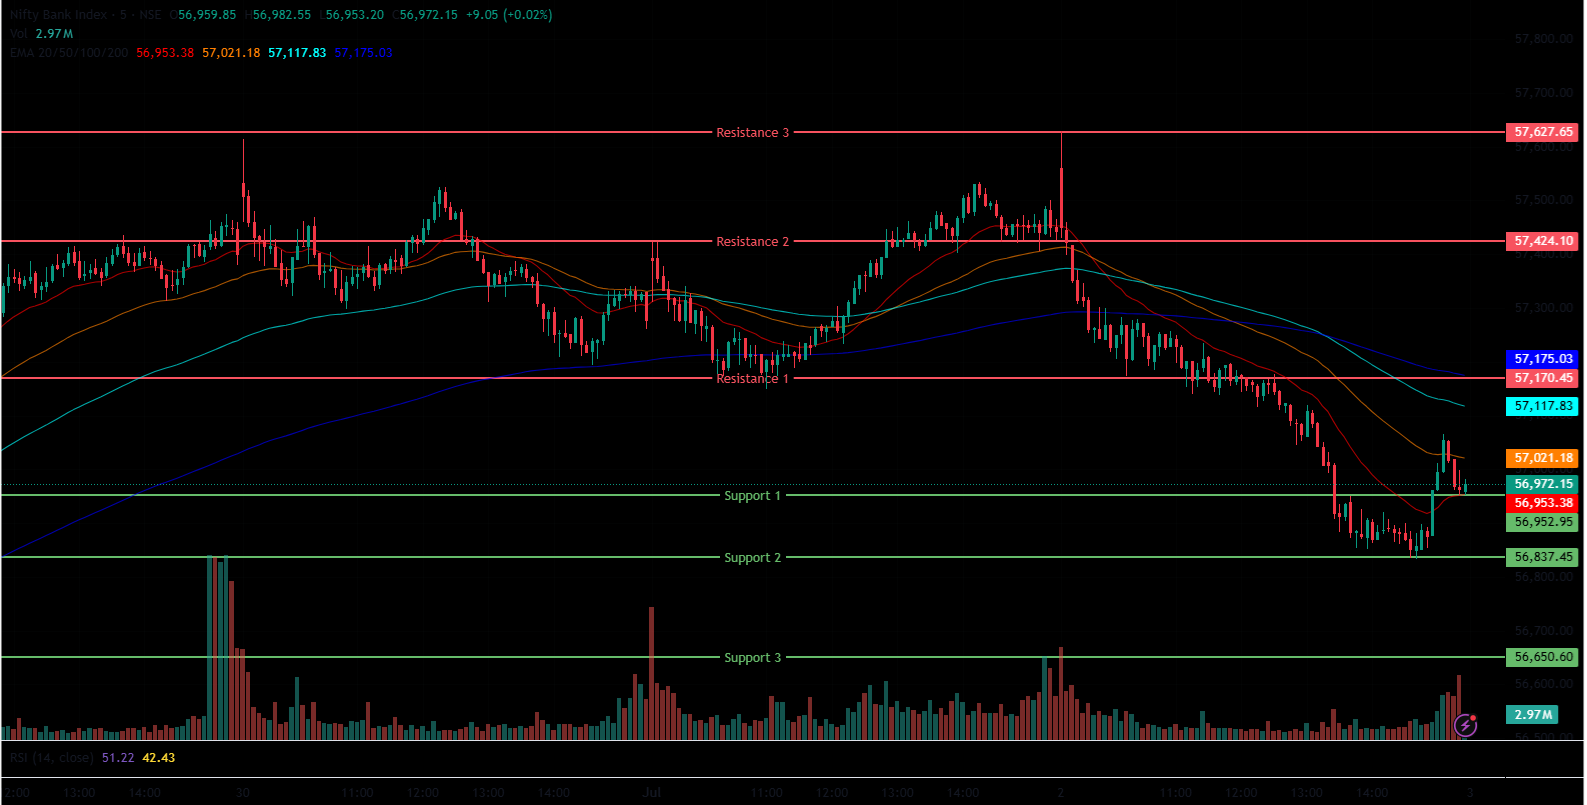
(In this analysis, we have used 20/50/100/200 EMAs, where 20 EMA (Red), 50 EMA (Orange), 100 EMA (Light Blue), 200 EMA (Dark Blue)).
The Bank Nifty Index also followed a similar trend, opening at 57,558.20 on Wednesday, up by 98.75 points from Tuesday’s closing of 57,459.45. It was trading below the opening level at the 57,123 level in the morning session, in red, was below all four 20/50/100 but above 200 EMAs in the 15-minute time frame. In the afternoon session, the Bank Nifty continued to fall reaching its day’s low at 56,833.80 and closed around 56,999.20 while staying above 200-day EMAs but below 20/50/100 EMAs in the 15-minute time frame. Bank Nifty immediate resistance levels are R1 (57,170), R2 (57,424), and R3 (57,628), while immediate support levels are S1 (56,953), S2 (56,837), and S3 (56,651).
The Bank Nifty index had peaked at 57,628.40 touched all-time high and had a day’s low at 56,833.80. Finally, it closed slightly above day’s low in red at 56,999.20, down by 460.25 points or 0.8%. The Relative Strength Index (RSI) stood at 59.57 (below the overbought zone of 70) in the daily time frame, and Bank Nifty was above the 20/50/100/200 EMAs in the daily time frame.
BSE Sensex Chart & Price Action Analysis
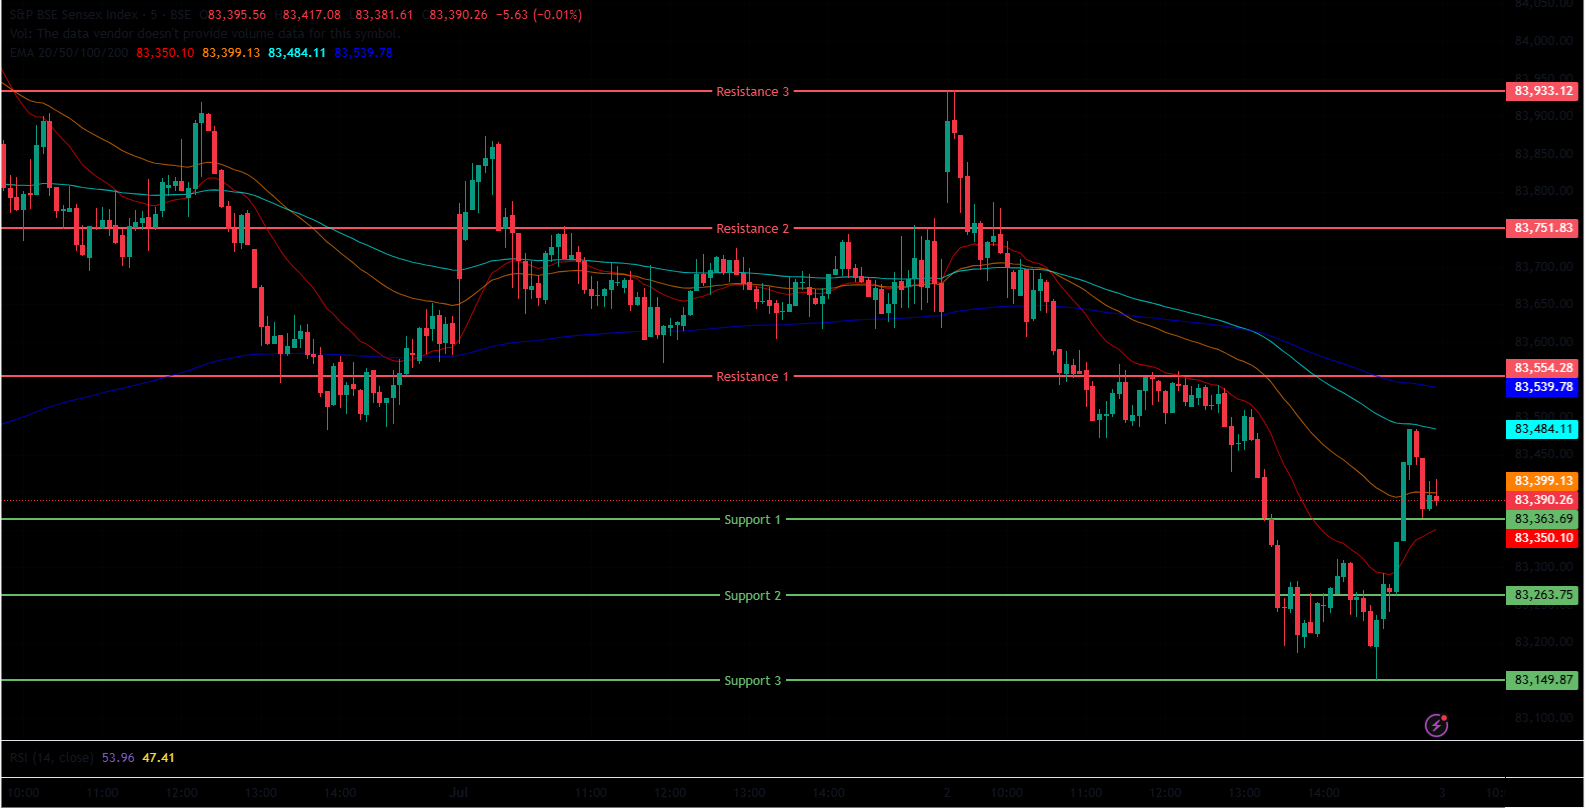
(In this analysis, we have used 20/50/100/200 EMAs, where 20 EMA (Red), 50 EMA (Orange), 100 EMA (Light Blue), 200 EMA (Dark Blue)).
The BSE Sensex Index followed the same trend, opening at 83,790.72 on Wednesday, up by 93.43 points from Tuesday’s closing of 83,697.29. It was trading below the opening level at 83,531 range in the morning session, in red, and above 50/100/200 EMAs but below 20 EMAs in the 15-minute time. In the afternoon session, the BSE Sensex rebounded from day’s low of 83,150.77 and closed in red and above the day’s low at 83,409.69 while staying below 20/50/100 EMAs but above the 200 EMAs in the 15-minute time frame.
BSE Sensex immediate resistance levels are R1 (83,554), R2 (83,752), and R3 (83,933), while immediate support levels are S1 (83,364), S2 (83,264), and S3 (83,150). The BSE Sensex index had peaked at 83,935.01 and had a day’s low at 83,150.77. Finally, it closed at 83,409.69, down by 287.6 points or 0.34%. The Relative Strength Index (RSI) stood at 60.16 (below the overbought zone of 70) in the daily time frame, and BSE Sensex was above all four 20/50/100/200 EMAs in the daily time frame.
Market Recap July 2nd, 2025
On Wednesday, the Nifty 50 opened on a mildly positive note at 25,588.30 but slipped into a bearish trend through most of the session, eventually closing 88.40 points lower at 25,453.40, down 0.35%. The Relative Strength Index (RSI) stood at 61.34, remaining below the overbought threshold of 70. Despite the decline, the index continued to trade above its 20, 50, 100, and 200-day Exponential Moving Averages (EMAs) on the daily chart.
A similar pattern was observed in the BSE Sensex, which opened at 83,790.72, touched an intraday low of 83,150.77, and settled at 83,409.69, marking a loss of 287.60 points or 0.34%. Its RSI stood at 60.16, and like the Nifty, it remained above all four key EMAs.
Investor sentiment on Wednesday remained mixed, as caution prevailed ahead of upcoming tariff deadlines. Attention is gradually shifting to the Q1 FY26 earnings season. However, positive macroeconomic indicators such as PMI, inflation trends, potential repo rate cuts, and sustained government spending continue to underpin market resilience.
Among sectoral indices, most ended in negative territory. The Nifty Realty Index was a major laggard, falling 1.44% or 14.15 points to close at 970.05. The drop was driven by declines in stocks like Phoenix Mills (-3.32%), Brigade Enterprises (-3.25%), Prestige Estates, and Anant Raj, both down over 2%.
The Nifty Finance Index also underperformed, shedding 262.50 points or 0.97% to end at 26,861. Stocks such as Cholamandalam Investment, Shriram Finance, HDFC Life Insurance, and Bajaj Finserv fell over 2% amid profit booking and valuation concerns. The Nifty PSU Bank Index closed at 7,193.65, down 59.95 points or 0.83%, dragged by declines in Bank of Maharashtra (-2.14%), Bank of Baroda (-1.81%), and Bank of India (-1.51%). On the positive side, the Nifty Metal Index emerged as one of the top performers, gaining 134.65 points or 1.41% to close at 9,699.20, led by strong gains in Tata Steel, SAIL, JSW Steel, and Welspun Corp all up more than 2.5%.
The Nifty Consumer Durables Index also ended in the green, advancing 399.95 points or 1.04% to settle at 38,908. Notable gainers included Kajaria Ceramics, PG Electroplast, Dixon Technologies, and Blue Star, each rising around 3%. In Asia, markets ended on a mixed note. South Korea’s Kospi declined 14.59 points (-0.47%) to close at 3,075.06, and Japan’s Nikkei 225 lost 223.85 points (-0.56%) to settle at 39,762.48. On the other hand, Hong Kong’s Hang Seng Index advanced 149.13 points (0.62%) to finish at 24,221.41. As of 4:50 p.m., Dow Jones Futures were trading up 138.19 points or 0.31% at 44,631.14.
India VIX
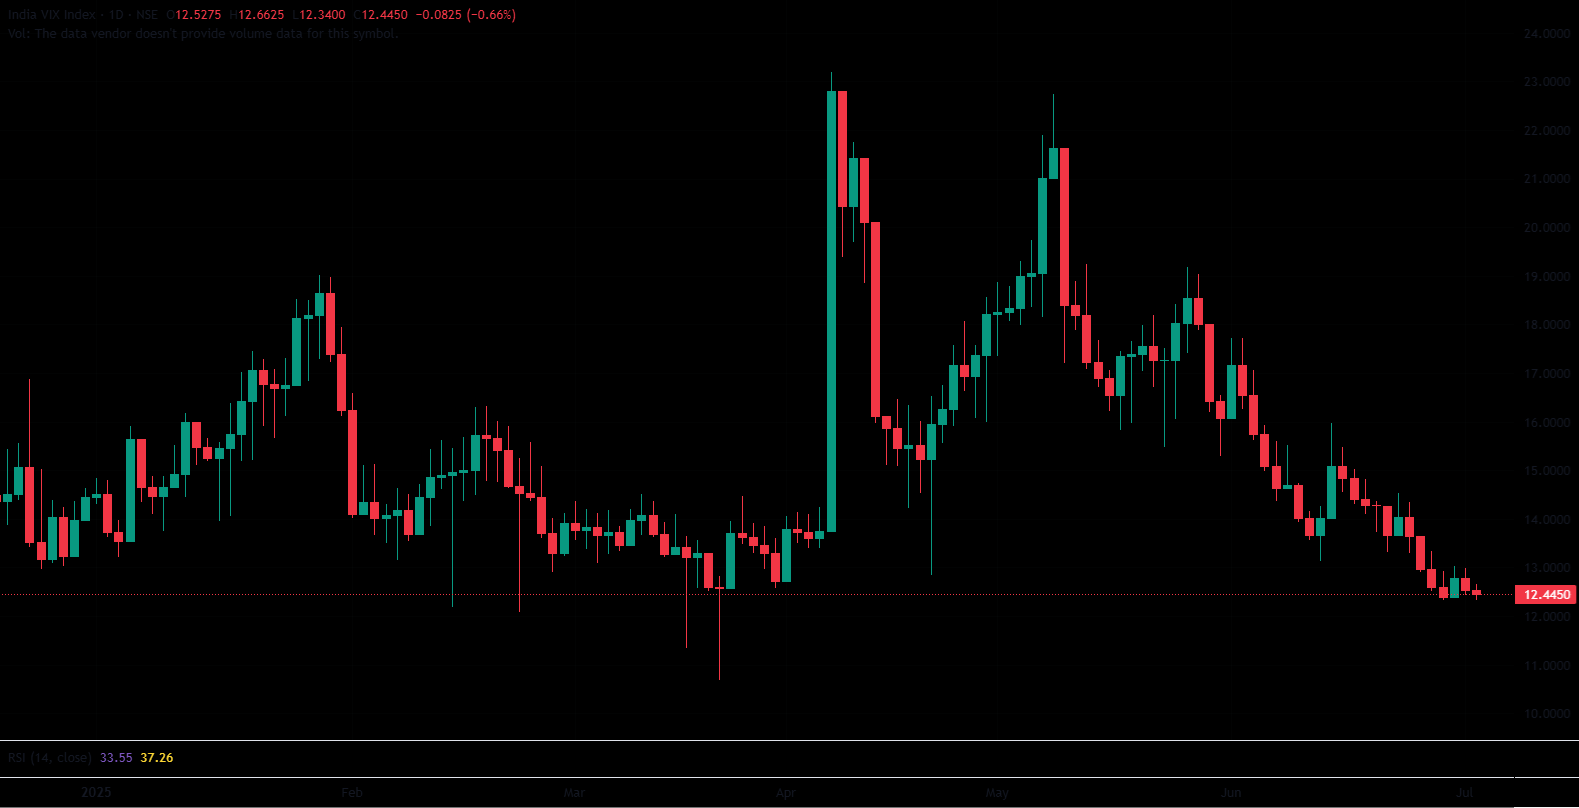
The India VIX decreased from 12.53 to 12.44 on Wednesday, down by 0.083 points or 0.66%. The decrease in the index shows an ease in market volatility.
Trade Setup Summary
The Nifty 50 opened on a positive note on Wednesday but did not sustain the 25,500 mark range throughout the morning to afternoon session, and closed on a negative note at 25,453.40, peaking at 25,608.10. A break below 25,421 could trigger further selling towards 25,384, while a break above 25,486 could trigger bullishness towards 25,553.
Bank Nifty opened on a similar trend, opening on positive but ended on a negative note and breaking below the 57,000 level. A break below 56,953 could trigger further selling towards 56,837, while a break above 57,170 could trigger bullishness towards 57,424.
Bank Nifty immediate resistance levels are R1 (57,170), R2 (57,424), and R3 (57,628), while immediate support levels are S1 (56,953), S2 (56,837), and S3 (56,651).
Sensex opened on a similar trend, opening on positive but ended on a negative note, and was below the 83,500 level. A break below 83,364 could trigger further selling towards 83,264, while breaking the next resistance level of 83,554 could lead towards the 83,752 level.
Given the ongoing volatility and mixed sentiments, it’s advisable to avoid aggressive positions and wait for clear directional moves above resistance or below support. Traders should consider these key support and resistance levels when entering long or short positions following the price break from these critical levels. Additionally, traders can combine moving averages to identify more accurate entry and exit points.
Disclaimer

The views and investment tips expressed by investment experts/broking houses/rating agencies on tradebrains.in are their own, and not that of the website or its management. Investing in equities poses a risk of financial losses. Investors must therefore exercise due caution while investing or trading in stocks. Trade Brains Technologies Private Limited or the author are not liable for any losses caused as a result of the decision based on this article. Please consult your investment advisor before investing.
About: Trade Brains Portal is a stock analysis platform. Its trade name is Dailyraven Technologies Private Limited, and its SEBI-registered research analyst registration number is INH000015729.
Investments in securities are subject to market risks. Read all the related documents carefully before investing.
Registration granted by SEBI and certification from NISM in no way guarantee performance of the intermediary or provide any assurance of returns to investors.
