

Markets exhibited a strong recovery on Wednesday after a prolonged losing streak, with major indices like the Nifty 50 and Sensex bouncing back sharply. The rebound was largely driven by renewed buying interest in key sectors such as banking, financials, autos, and pharma. Sentiment was buoyed by the Reserve Bank’s decision to hold interest rates steady, signalling a potentially accommodative stance going forward. Technical indicators showed that while the indices remained under short-term moving averages, they stayed comfortably above long-term support levels, hinting at underlying strength and resilience.

Broader market sentiment was further uplifted by a rally in the media and private banking sectors, with several stocks posting strong gains. However, some weakness persisted in public sector banks, which continued to face selling pressure. Internationally, most Asian markets mirrored the positive tone, although Japan’s benchmark index bucked the trend and ended lower.

US market sentiment was more cautious, reflecting anxiety over political gridlock and a looming government shutdown, which added a layer of uncertainty to the global outlook. Overall, domestic optimism seemed to outweigh global concerns.
In this overview, we will analyse the key technical levels and trend directions for Nifty and BSE Sensex to monitor in the upcoming trading sessions. All the charts mentioned below are based on the 5-minute timeframe.
Nifty 50
(In this analysis, we have used 20/50/100/200 EMAs, where 20 EMA (Red), 50 EMA (Orange), 100 EMA (Light Blue), and 200 EMA (Dark Blue)).
To view other technical reports, click here
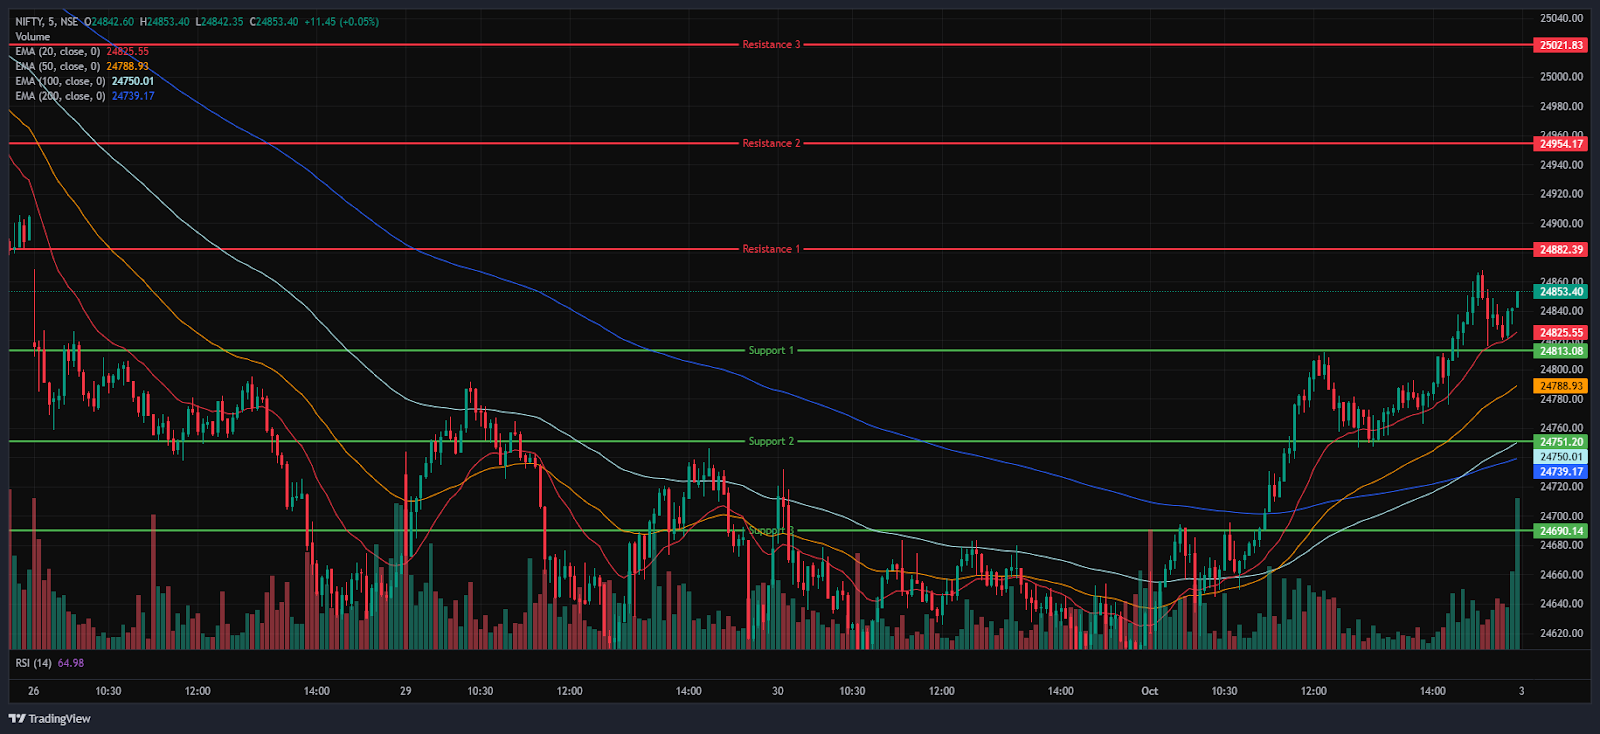
The Nifty 50 Index opened on a positive note at 24,620.55 on Wednesday, up by 9.45 points from Tuesday’s closing of 24,611.10. With a bullish start to the day, the index had a volatile morning session, trading in the 24,600 to 24,850 range. Additionally, the Index stood above the EMAs of 20/50/100 but below the 200-period EMA in the 15-minute time frame during the morning session.
Further, the index gained its momentum and surged as high as the 24,868 mark, the day’s high in the afternoon session, and was traded above its opening level, between the range of 24,700 and 24,900. During the afternoon session, the Nifty 50 traded above the EMAs of 20/50/100 but below the 200-period EMA in the 15-minute time frame. Nifty’s immediate resistance levels are R1 (24,882), R2 (24,954), and R3 (25,021), while immediate support levels are S1 (24,813), S2 (24,751), and S3 (24,690).
The Nifty index had reached a day’s high at 24,867.95 and saw a day’s low at 24,605.95. Finally, it had closed at 24,836.30, in green above the 24,800 level, gaining 225.20 points, or 0.92%. The Nifty 50 closed above the EMAs of 100/200 but below the 20/50 EMAs in the daily time frame.
Momentum Indicators
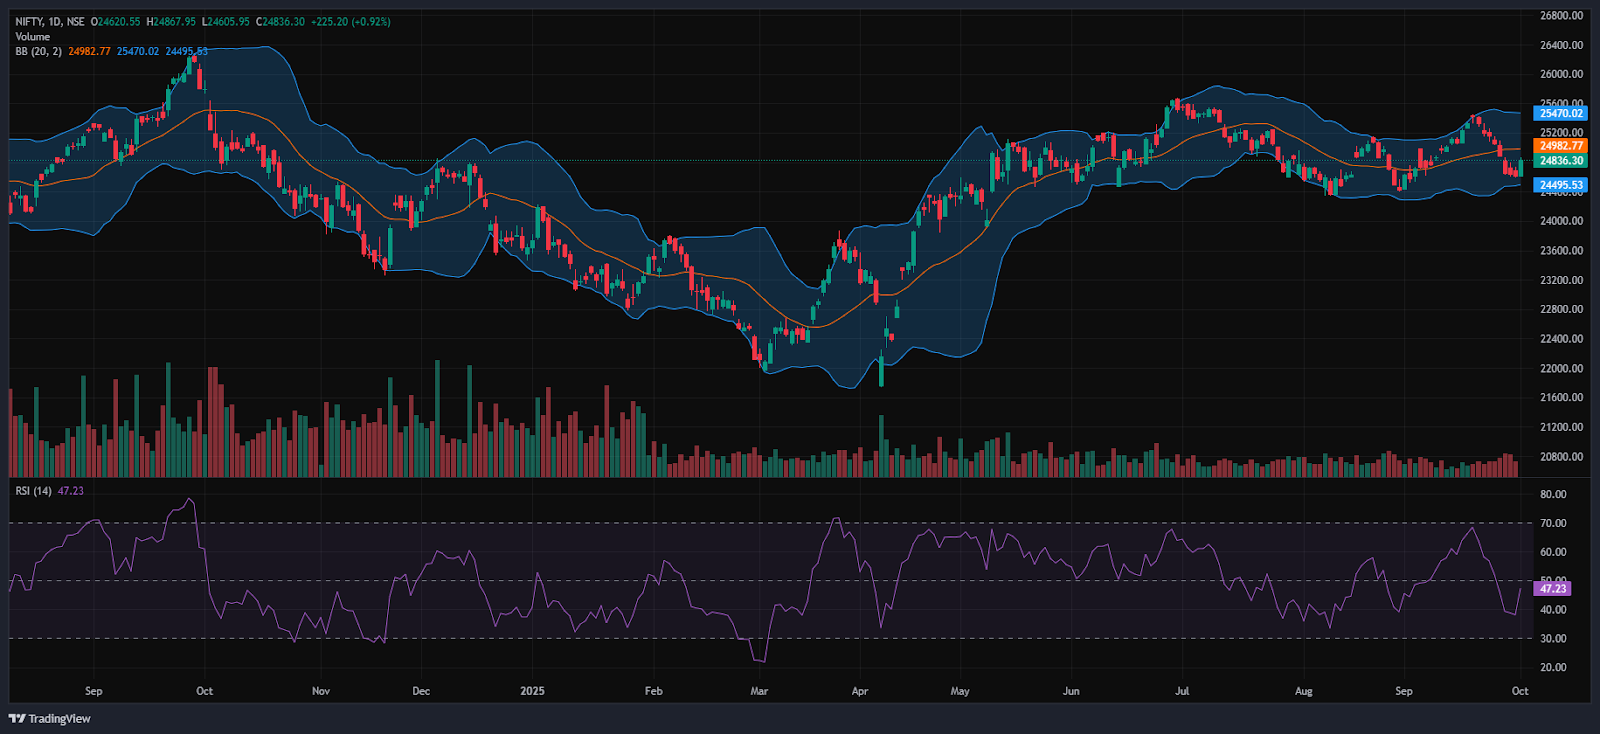
RSI (Daily): The Nifty 50’s RSI stood at 47.23, which is well below the overbought zone of 70 but near to the oversold zone, indicating a neutral market momentum.
Bollinger Bands (Daily): The index is trading in the lower band of its Bollinger Band range below the middle band (Simple Moving Average). Its position in the lower range indicates a bearish sentiment, but on Wednesday the Nifty Index formed Strong Bullish Candle in the daily time frame by breaking above the previous Resistance levels of 24,700 and 24,800. A sustained move above the middle band signals a bullish sentiment, while a drop back toward the lower band may reinforce bearish sentiment.
Volume Analysis: Wednesday’s trading session had above-average volumes, which stood at 308.9 Mn.
Derivatives Data: Options OI indicates strong Put writing at 24,800, following 24,700, establishing it as a firm support zone. On the upside, a significant Call OI buildup at 24,900 and 25,000 suggests a potential resistance supply. PCR (Put/Call Ratio) stands at 1.239 (>1), leaning towards bearish or cautious sentiment and the Long Build-up signals a Strong Bullish signal, with an overall mixed outlook for the next trading session.
Bank Nifty
(In this analysis, we have used 20/50/100/200 EMAs, where 20 EMA (Red), 50 EMA (Orange), 100 EMA (Light Blue), and 200 EMA (Dark Blue)).
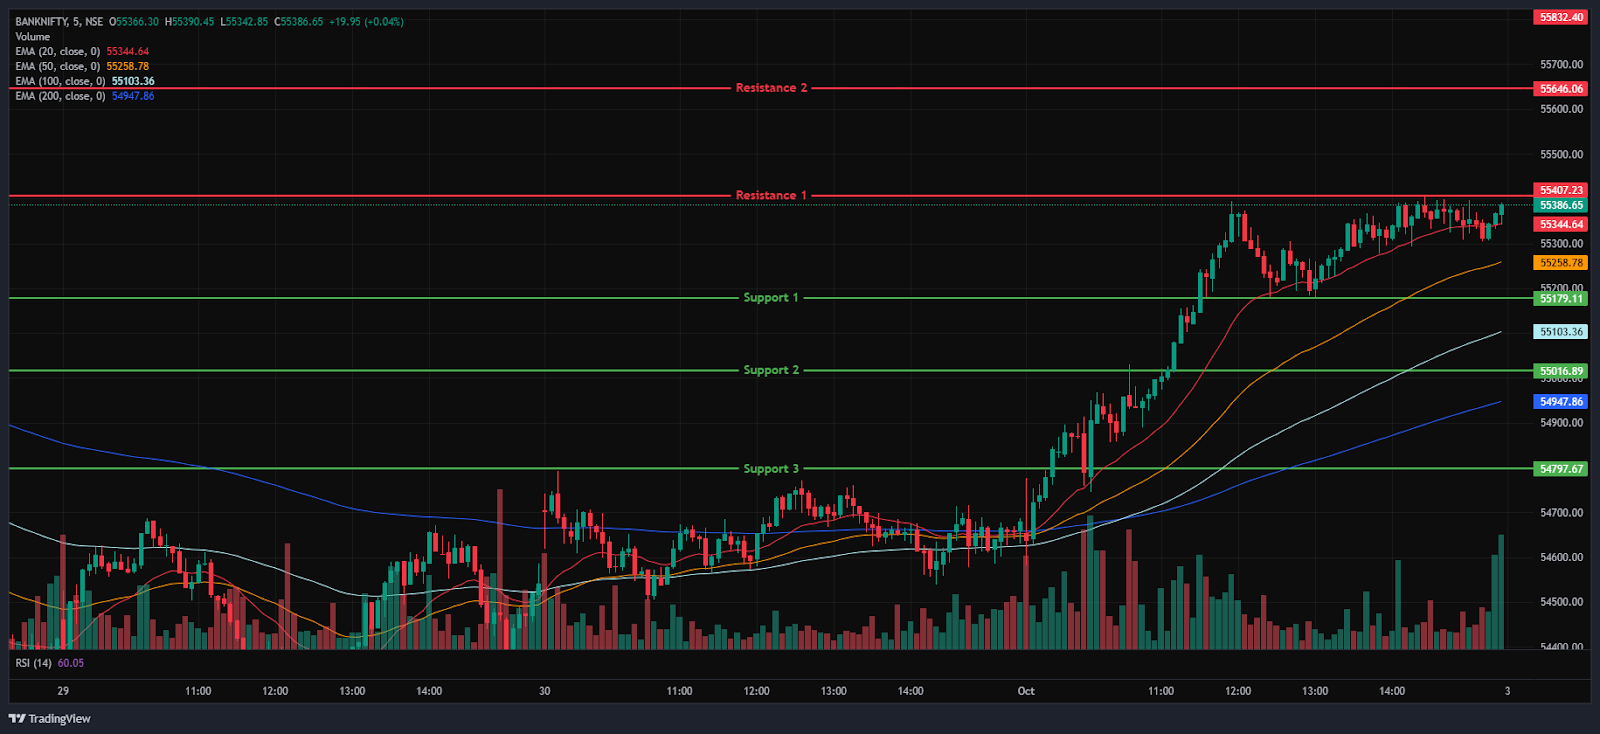
The Bank Nifty Index also started the session on a positive note at 54,653.90 on Wednesday, up by 18.05 points from Tuesday’s closing of 54,635.85. The index was trading between the range of 54,500 and 55,400 in the morning session, indicating high volatility. In addition, the index was trading above all four EMAs of 20/50/100/200 in the 15-minute time frame.
In the afternoon session, the Index consolidated and sustained above the 55,407, mark its day high and was traded around the range of 55,100 and 55,400, ending in green. During the afternoon session, Bank Nifty closed above all four EMAs of 20/50/100/200 in the 15-minute time frame. Bank Nifty immediate resistance levels are R1 (55,407), R2 (55,646), and R3 (55,832), while immediate support levels are S1 (55,179), S2 (55,017), and S3 (54,798).
The Bank Nifty index had peaked at 55,406.75 and made a day’s low at 54,582.55. Finally, it had closed in green at 55,347.95, closing above the 55,300 level, gaining 712.10 points or 1.3%. The Relative Strength Index (RSI) stood at 55.28 well below the overbought zone of 70 in the daily time frame, and Bank Nifty closed above all four EMAs of 20/50/100/200 in the daily time frame.
Sensex
(In this analysis, we have used 20/50/100/200 EMAs, where 20 EMA (Red), 50 EMA (Orange), 100 EMA (Light Blue), and 200 EMA (Dark Blue)).
To view other technical reports, click here
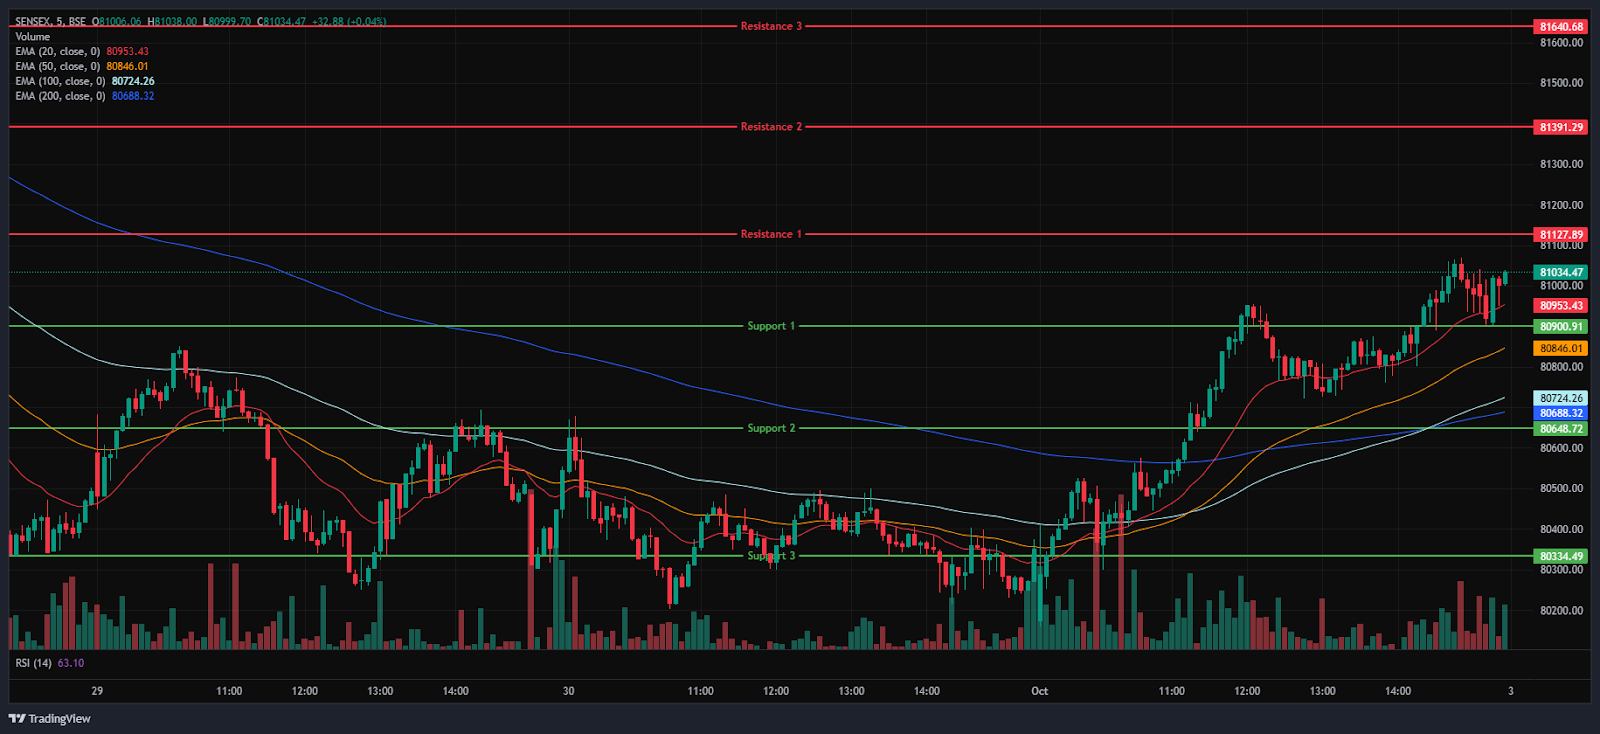
The BSE Sensex Index also opened on a negative note at 80,173.24 on Wednesday, down by 94.38 points from Tuesday’s closing of 80,267.62. The index started its session on a bearish note and was trading in the 80,100 to 81,000 range throughout the morning session’s 15-minute time frame, above the EMAs of the 20/50/100 but below the 200-period EMA.
In the afternoon session, the Index further surged to the 81,068 level, marking its day high and was traded between 80,700 and 81,100, maintaining its overall bullish trend and closing above the EMAs of 20/50/100 but below the 200-period EMA in the 15-minute time frame. BSE Sensex immediate resistance levels are R1 (81,128), R2 (81,391), and R3 (81,641), while immediate support levels are S1 (80,901), S2 (80,649), and S3 (80,334).
The BSE Sensex index had peaked at 81,068.43 and made a day’s low at 80,159.90. Finally, it had closed at 80,983.31 in green, gaining 715.70 points or 0.89%. The Relative Strength Index (RSI) stood at 46.41 (below the overbought zone of 70 but near to the oversold zone in the daily time frame), and the BSE Sensex closed below the EMAs of 20/50/100 but above the 200-period EMA in the daily time frame.
India VIX
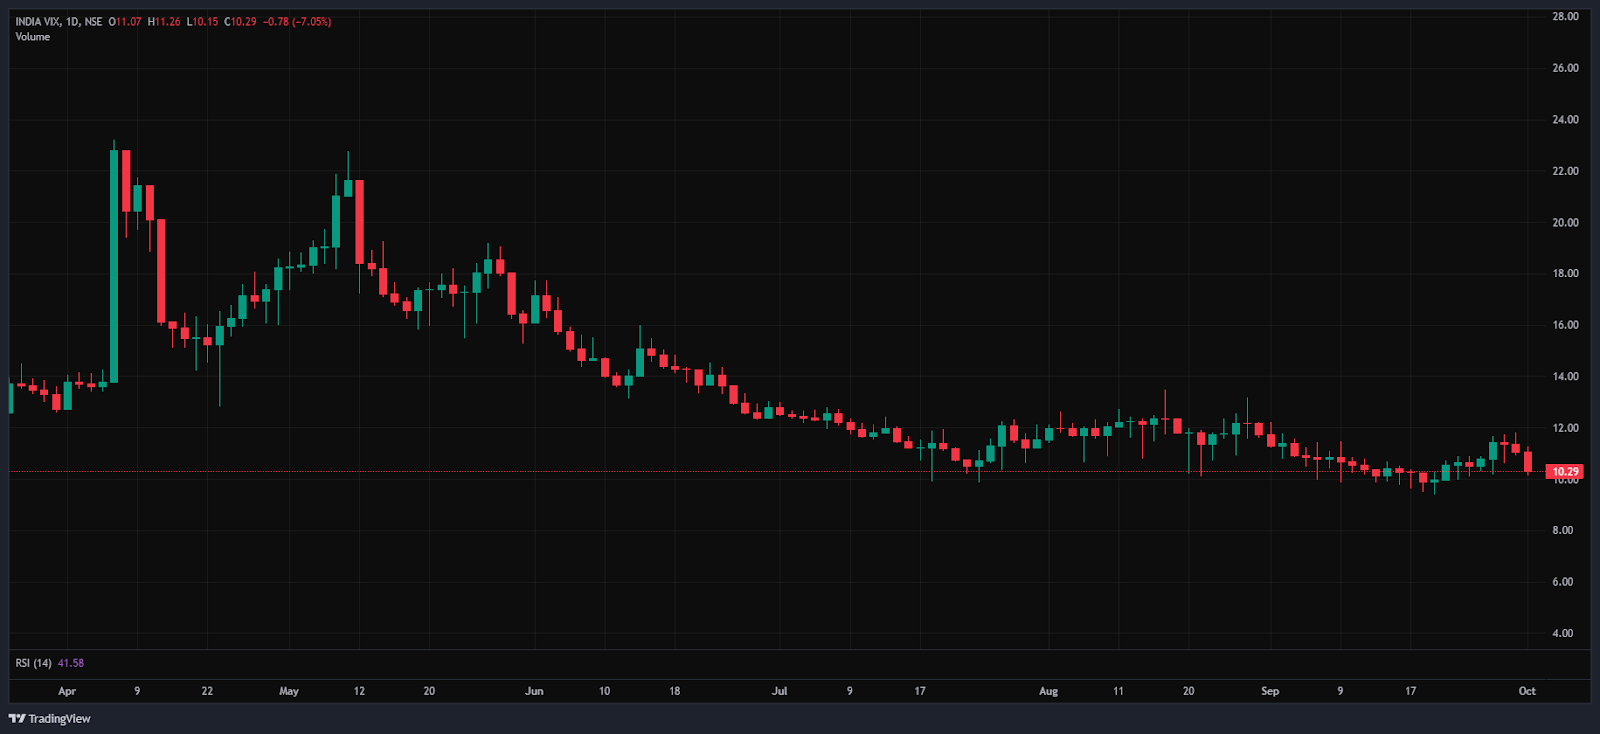
The India VIX decreased by 0.78 points or 7.03%, from 11.06 to 10.29 during Wednesday’s session. A decrease in the India VIX typically indicates lower price volatility in the stock market, suggesting a more stable market environment. However, a stable market environment and minimal volatility are anticipated when the India vix is below 15.
Market Recap on the 1st of October 2025
On Wednesday, the Nifty 50 opened slightly higher at 24,620.55, gaining 9.45 points from the previous close of 24,611.1. It reached an intraday high of 24,867.95 before settling just below 24,850 at 24,836.3, marking a rise of 225.2 points or 0.92%. Technically, the index stayed above its 100/200-day EMAs but remained below the 20/50-day EMAs. The BSE Sensex started lower at 80,173.24, down 94.38 points from 80,267.62, but later followed Nifty’s trend, closing above 80,950 at 80,983.31, up 715.7 points or 0.89%.
Momentum indicators showed moderate strength, with the RSI for Nifty at 47.23 and Sensex at 46.41, both far from overbought territory and close to oversold levels. The Bank Nifty Index also closed positively, rising 712.1 points (1.30%) to 55,347.95. Broad indices bounced back after an eight-day slide, driven by strong buying in banking, financial services, auto, and pharma sectors, supported by the RBI’s decision to keep the repo rate steady, leaving room for potential rate cuts.
Most sectors remained positive throughout the day. The Nifty Media Index led gains, rising 61.3 points (4%) to 1,604.25, with Sun TV Network surging 15.2%. Other key media stocks like Nazara Technologies, PVR Inox, and Zee Entertainment saw gains up to 8.9%. The Nifty Private Bank Index gained 522.15 points (2%) to 26,984.6, led by Kotak Mahindra Bank’s 3.5% increase, followed by Axis Bank, Yes Bank, and ICICI Bank, all rising up to 2.5%. The Nifty Financial Services Index climbed 360.1 points (1.4%) to 26,382.2.
The only sector in the red was the Nifty PSU Bank Index, which slipped 27.55 points (-0.4%) to 7,499.2. Indian Bank dropped 1.8%, while other PSU banks like State Bank of India, Central Bank, and Punjab National Bank declined up to 1%.
Asian markets mostly trended higher on Wednesday. Hong Kong’s Hang Seng Index rose 232.68 points (0.87%) to 26,855.56, China’s Shanghai Composite increased 20.25 points (0.52%) to 3,882.78, and South Korea’s KOSPI gained 31.23 points (0.91%) to 3,455.83. Japan’s Nikkei 225, however, fell 381.78 points (-0.85%) to 44,550.85.
Meanwhile, US Dow Jones futures were down 235 points (-0.5%) at 46,454 as investors reacted to the first government shutdown in nearly seven years, after Senate Democrats blocked a Republican funding bill, which fuelled market uncertainty amid concerns about potential delays in economic data and fiscal policy.
Trade Setup Summary
The Nifty 50 opened on a positive note at 24,620.55 on Wednesday and ended the session in the green above the 24,800 level at 24,836.30. A break below 24,813 could trigger further selling towards 24,751 while breaking the next resistance level of 24,882 could trigger bullishness towards the 24,954 level.
Bank Nifty started the session on a positive note at 54,653.90 and ended the session in the green at 55,347.95, above the 55,300 level. A break below 55,179 could trigger further selling towards 55,017, while breaking the next resistance level of 55,407 could trigger bullishness towards the 55,646 level.
Sensex also opened on a negative note at 80,173.24 but ended the session in the green at 80,983.31, above the 80,900 level. A break below 80,901 could trigger further selling towards 80,649, while breaking the next resistance level of 81,128 could lead towards the 81,391 level.
Given the ongoing volatility and mixed sentiments, it’s advisable to avoid aggressive positions and wait for clear directional moves above resistance or below support. Traders should consider these key support and resistance levels when entering long or short positions following the price break from these critical levels. Additionally, traders can combine moving averages to identify more accurate entry and exit points.
Disclaimer

The views and investment tips expressed by investment experts/broking houses/rating agencies on tradebrains.in are their own, and not that of the website or its management. Investing in equities poses a risk of financial losses. Investors must therefore exercise due caution while investing or trading in stocks. Trade Brains Technologies Private Limited or the author are not liable for any losses caused as a result of the decision based on this article. Please consult your investment advisor before investing.
About: Trade Brains Portal is a stock analysis platform. Its trade name is Dailyraven Technologies Private Limited, and its SEBI-registered research analyst registration number is INH000015729.
Investments in securities are subject to market risks. Read all the related documents carefully before investing.
Registration granted by SEBI and certification from NISM in no way guarantee performance of the intermediary or provide any assurance of returns to investors.
