Indian equity markets ended Thursday on a muted note, with the Nifty 50, Bank Nifty, and BSE Sensex all closing lower, reflecting a mildly bearish sentiment. However, the broader market structure remained resilient, as key indices continued to trade above important moving averages. Additionally, volatility stayed at multi-month lows, indicating sustained investor confidence. Sectoral performance was mixed. Media and consumer durables stocks led the gains, while PSU banks and metal stocks weighed on the indices, dragging the market lower.
On the global front, most Asian markets closed in the green, reflecting a generally positive trend, although Hong Kong’s market lagged behind. Meanwhile, U.S. futures pointed to a positive start, offering some support from global cues despite sector-specific weakness in domestic markets.
In this overview, we will analyze the key technical levels and trend directions for Nifty and BSE Sensex to monitor in the upcoming trading sessions. All the charts mentioned below are based on the 5-minute timeframe.
Nifty 50
(In this analysis, we have used 20/50/100/200 EMAs, where 20 EMA (Red), 50 EMA (Orange), 100 EMA (Light Blue), 200 EMA (Dark Blue)).
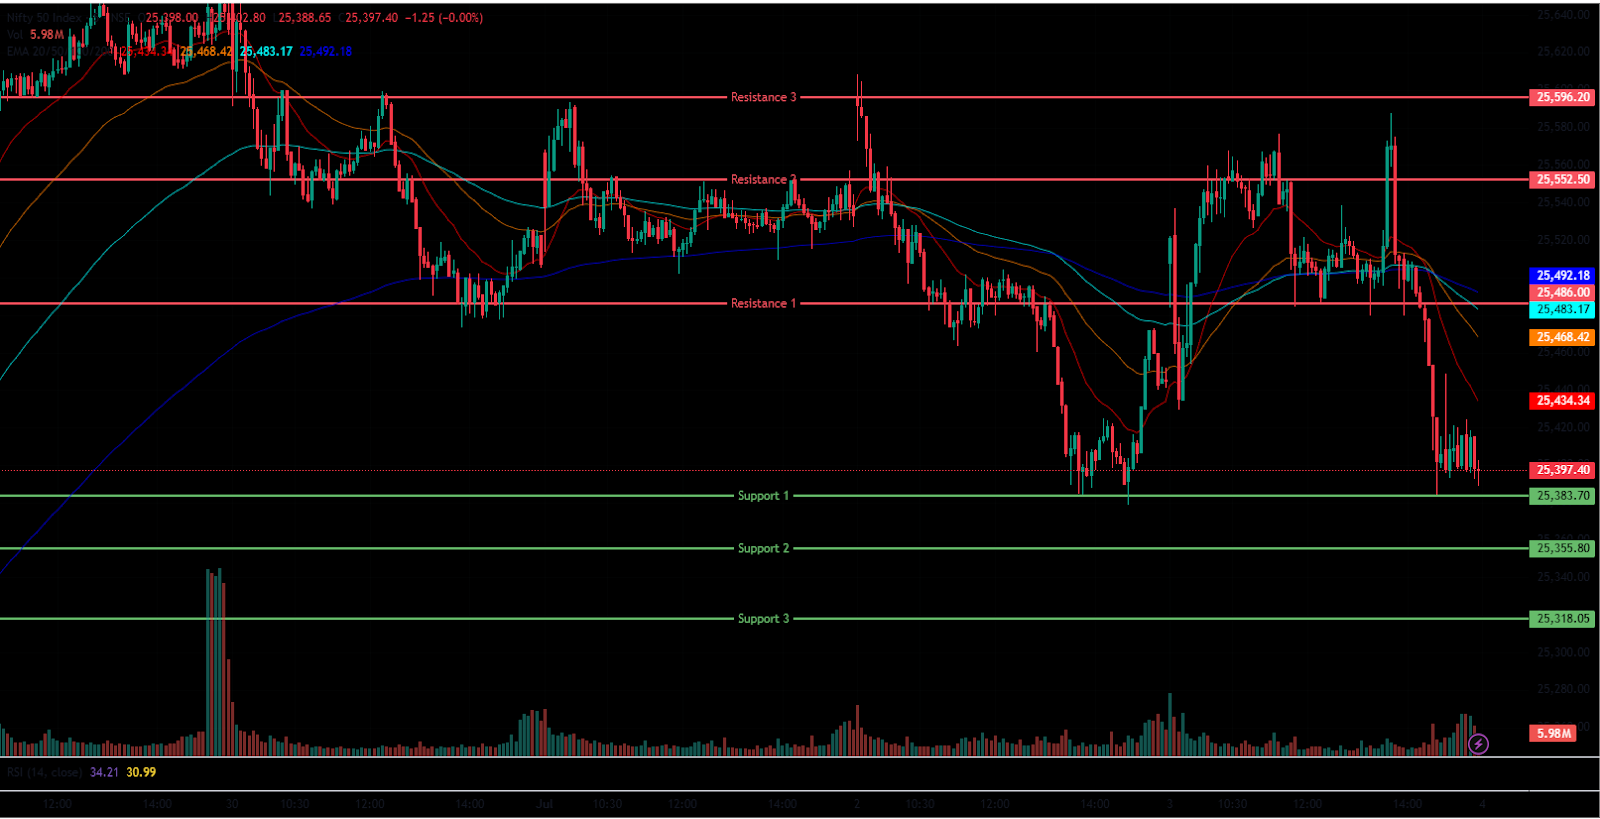
The Nifty 50 Index opened on a positive note at 25,505.10 on Thursday, up by 51.7 points from Wednesday’s closing of 25,453.40. The Nifty Index traded in the green in the morning session, rallied to 25,518 level. It was trading above the opening level, and was above all four 20/50/100/200 EMAs in the 15-minute time frame in the morning session. In the afternoon session, the Nifty Index dragged down after making day’s high of 25,587.50 and closed in red at 25,405.30. It stayed above 200 EMAs but below in 20/50/100 EMAs in the 15-minute time frame in the afternoon session.
Nifty’s immediate resistance levels are R1 (25,486), R2 (25,553), and R3 (25,596), while immediate support levels are S1 (25,384), S2 (25,356), and S3 (25,318). The Nifty index had reached a day’s high at 25,587.50, closed in red below the 25,450 mark, and saw a day’s low at 25,384.35. Finally, it had closed above the day’s low at 25,405.30, losing 48.1 points or 0.19%. The Relative Strength Index (RSI) stood at 59.74 (below the overbought zone of 70) in the daily time frame, and Nifty 50 closed above the four 20/50/100/200 EMAs in the daily time frame.
Bank Nifty
(In this analysis, we have used 20/50/100/200 EMAs, where 20 EMA (Red), 50 EMA (Orange), 100 EMA (Light Blue), 200 EMA (Dark Blue)).
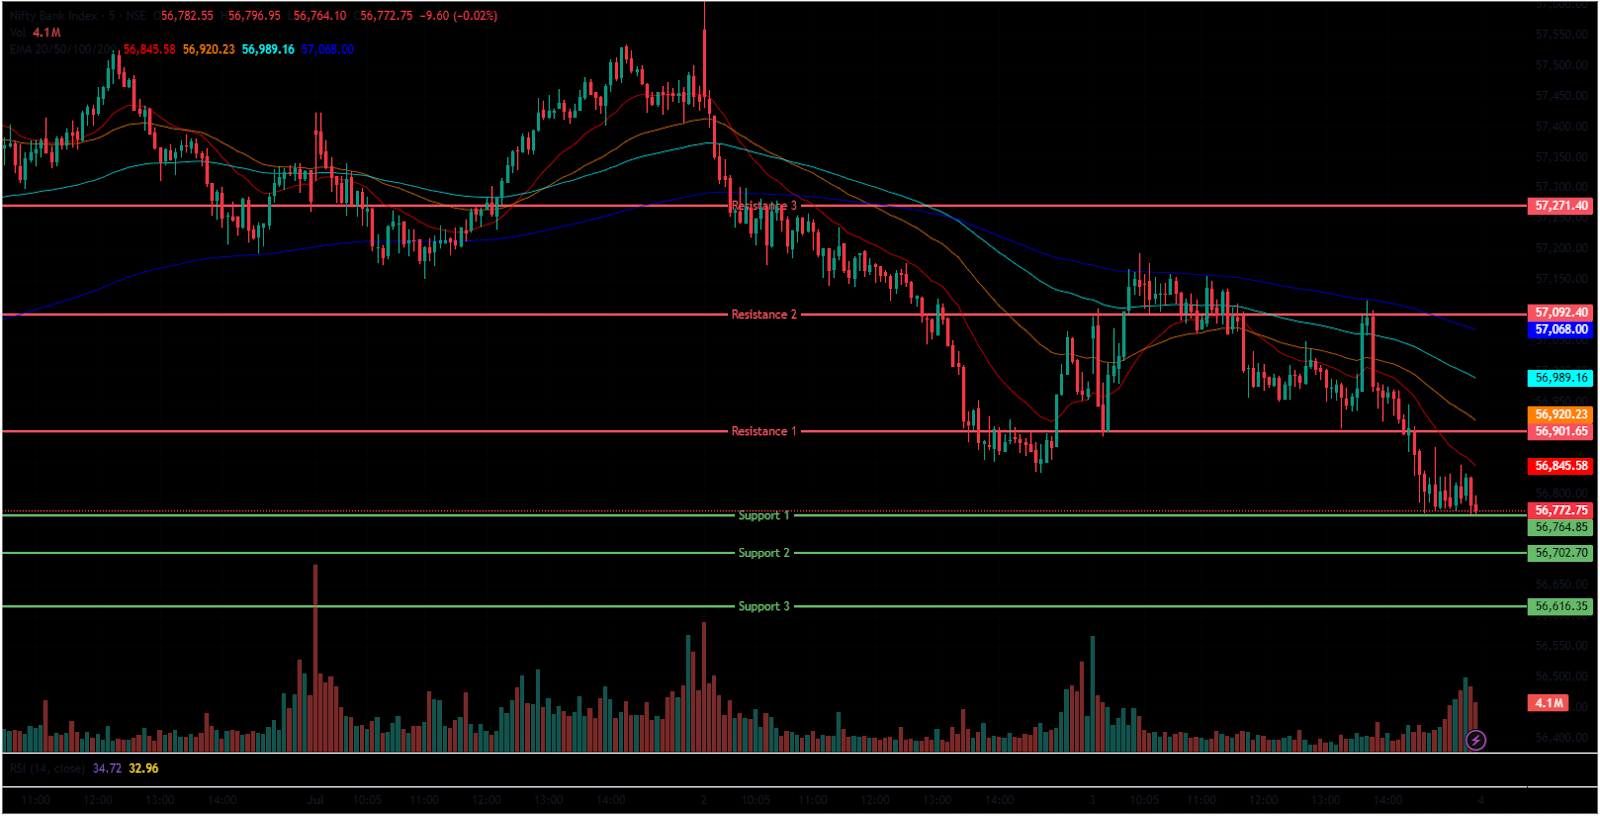
The Bank Nifty Index also followed a similar trend, opening at 57,050.40 on Thursday, up by 51.2 points from Wednesday’s closing of 56,999.20. It was trading below the opening level at the 57,009 level in the morning session, in red, was below the 20/50/100 but above 200 EMAs in the 15-minute time frame and made a day’s high of 57,193.25. In the afternoon session, the Bank Nifty dragged down its day’s low at 56,764.10 and closed around 56,791.95 by breaking below all four 20/50/100/200-day EMAs in the 15-minute time frame.
Bank Nifty immediate resistance levels are R1 (56,901), R2 (57,092), and R3 (57,271), while immediate support levels are S1 (56,765), S2 (56,703), and S3 (56,616). The Bank Nifty index had peaked at 57,193.25 and had a day’s low at 56,764.10. Finally, it had closed slightly above day’s low but in red at 56,791.95, down by 207.25 points or 0.36%. The Relative Strength Index (RSI) stood at 56.70 (below the overbought zone of 70) in the daily time frame, and Bank Nifty was above the 20/50/100/200 EMAs in the daily time frame.
Sensex

(In this analysis, we have used 20/50/100/200 EMAs, where 20 EMA (Red), 50 EMA (Orange), 100 EMA (Light Blue), 200 EMA (Dark Blue)).
The BSE Sensex Index followed the same trend, opening at 83,540.74 on Thursday, up by 131.05 points from Wednesday’s closing of 83,540.74. It was trading above the opening level at 83,640 range in the morning session, in green, and above all four 20/50/100/200 EMAs in the 15-minute time. In the afternoon session, the BSE Sensex rebounded and made day’s high of 83,850.09 but dragged down to red and made day’s low at 83,186.74. Finally, it had closed above day’s low at 83,239.47 while staying below 20/50/100 EMAs but above the 200 EMAs in the 15-minute time frame.
BSE Sensex immediate resistance levels are R1 (83,352), R2 (83,501), and R3 (83,629), while immediate support levels are S1 (83,183), S2 (83,103), and S3 (82,981). The BSE Sensex index had peaked at 83,850.09 and had a day’s low at 83,186.74. Finally, it closed at 83,239.47, down by 170.22 points or 0.20%. The Relative Strength Index (RSI) stood at 58.46 (below the overbought zone of 70) in the daily time frame, and BSE Sensex was above all four 20/50/100/200 EMAs in the daily time frame.
India VIX
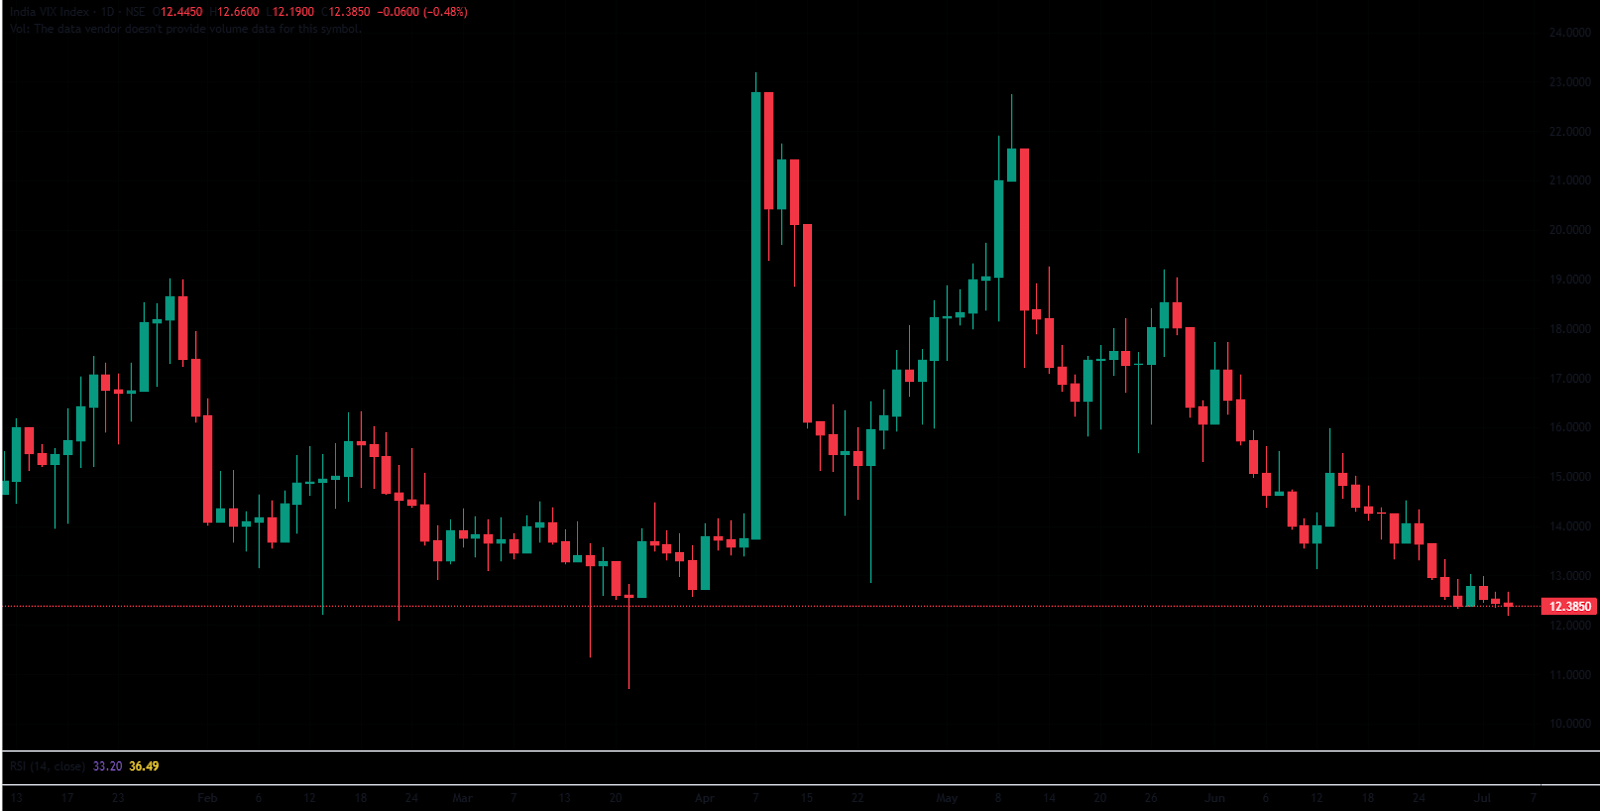
The India VIX decreased from 12.38 to 12.44 on Thursday, down by 0.060 points or 0.48%. The slight decrease in the VIX index shows an ease in market volatility.
Market Recap, July 3rd, 2025
The Nifty 50 ended Thursday on a negative note, slipping 48.10 points or 0.19% to close at 25,405.30. The index opened at 25,505.10 and reached an intraday high of 25,587.50. The BSE Sensex followed a similar trend, starting the session at 83,540.74 and ending 170.22 points lower at 83,239.47, marking a decline of 0.20%. Despite the dip, both benchmarks continued to trade above their key 50-, 100-, and 200-day exponential moving averages. The Relative Strength Index (RSI) stood at 59.74 for the Nifty 50 and 58.46 for the Sensex comfortably below the overbought level of 70. Notably, market volatility eased as the India VIX dropped to a nine-month low of 12.39, a level last seen in October 2024, offering some confidence to investors.
Sector-wise, market sentiment was mixed. The Nifty Media index led the gainers, rising 1.45% to settle at 1,750.15, driven by strong performances from Nazara Technologies (up 2.96%) and Zee Entertainment (up 2.08%). Network 18 Media and PVR Inox also contributed, gaining up to 1.91%.
The Nifty Consumer Durables index also posted gains, adding 218.50 points or 0.56% to close at 39,126. Blue Star led the rally with a 4.91% jump, followed by V-Guard Industries (up 2.88%), while Voltas and PG Electroplast each advanced over 2%.
On the downside, the Nifty PSU Bank index declined 0.89% to 7,129.90, dragged down by losses in Punjab National Bank, Union Bank of India, and UCO Bank, each falling by as much as 3%. The Nifty Metal index also closed in the red, losing 75.75 points or 0.78% to end at 9,623.45, with Vedanta Ltd, Welspun Corp, JSW Steel, and Jindal Steel & Power among the top losers, slipping up to 2.38%.
In global markets, most major Asian indices ended higher. South Korea’s Kospi gained 1.32% or 41.21 points to close at 3,116.27, while Japan’s Nikkei 225 inched up by 0.06% or 23.42 points to 39,785.90. The Shanghai Composite rose 0.18% to settle at 3,461.15. However, Hong Kong’s Hang Seng index fell 0.63%, losing 151.47 points to finish at 24,069.94. In the U.S., Dow Jones Futures were trading higher, up 70.65 points or 0.16%, at 44,555.07 as of 4:28 PM.
Trade Setup Summary
The Nifty 50 opened on a positive note on Thursday but did not sustain the (25,550-25,450) level and came down to 25,400 range throughout the morning to afternoon session, and closed on a negative note at 25,405.30, peaking at 25,587.50. A break below 25,384 could trigger further selling towards 25,356, while a break above 25,486 could trigger bullishness towards 25,553.
Bank Nifty opened on a similar trend, opening on positive but ended on a negative note and breaking below the 56,800 level. A break below 56,765 could trigger further selling towards 56,703, while a break above 56,901 could trigger bullishness towards 57,092.
Sensex opened on a similar trend, opening on positive but ended on a negative note, and was below the 83,300 level. A break below 83,183 could trigger further selling towards 83,103 while breaking the next resistance level of 83,352 could lead towards the 83,501 level.
Given the ongoing volatility and mixed sentiments, it’s advisable to avoid aggressive positions and wait for clear directional moves above resistance or below support. Traders should consider these key support and resistance levels when entering long or short positions following the price break from these critical levels. Additionally, traders can combine moving averages to identify more accurate entry and exit points.
Disclaimer

The views and investment tips expressed by investment experts/broking houses/rating agencies on tradebrains.in are their own, and not that of the website or its management. Investing in equities poses a risk of financial losses. Investors must therefore exercise due caution while investing or trading in stocks. Trade Brains Technologies Private Limited or the author are not liable for any losses caused as a result of the decision based on this article. Please consult your investment advisor before investing.
About: Trade Brains Portal is a stock analysis platform. Its trade name is Dailyraven Technologies Private Limited, and its SEBI-registered research analyst registration number is INH000015729.
Investments in securities are subject to market risks. Read all the related documents carefully before investing.
Registration granted by SEBI and certification from NISM in no way guarantee performance of the intermediary or provide any assurance of returns to investors.
