

![]()
![]()
The market showed a cautiously optimistic tone on Wednesday, with major Indian indices closing higher, reflecting a positive investor sentiment. The overall momentum suggested confidence, particularly in sectors like metals, pharmaceuticals, and healthcare, which led the gains. This indicates a preference for cyclical and defensive stocks amid a backdrop of mixed global cues. The banking sector also contributed positively, signalling underlying strength in financial stocks despite some technical resistance near shorter-term averages.

However, the technology and media sectors experienced selling pressure, reflecting a more selective risk appetite among investors. The underperformance in IT stocks suggests some profit-taking or concerns over near-term growth prospects in the tech space. Globally, Asian markets mostly declined, highlighting regional uncertainties, while South Korea bucked the trend with gains. The slight positive movement in US futures indicates cautious optimism but also a wait-and-see approach.

In this overview, we will analyse the key technical levels and trend directions for Nifty and BSE Sensex to monitor in the upcoming trading sessions. All the charts mentioned below are based on the 5-minute timeframe.
Nifty 50
(In this analysis, we have used 20/50/100/200 EMAs, where 20 EMA (Red), 50 EMA (Orange), 100 EMA (Light Blue), and 200 EMA (Dark Blue)).
To view other technical reports, click here
The Nifty 50 Index opened on a positive note at 24,616.50 on Wednesday, up by 36.9 points from Tuesday’s closing of 24,579.60. Although it started the morning session on a positive note, the Nifty Index was erratic, fluctuating between 24,550 and 24,650. In the morning session, the Index traded above its opening level at 24,627 and was traded above the EMAs of 20/50 but remained below the EMAs of 100/200 in the 15-minute time frame.
Later, in the afternoon session, the index surged further to the 24,750 level from the 24,650 level; the Nifty Index held above the 24,700 level, trading in green. Overall, the index ended on a positive note on Wednesday session. During the afternoon session, the Nifty 50 was traded above all four EMAs of 20/50/100/200 in the 15-minute time frame. Nifty’s immediate resistance levels are R1 (24,812), R2 (25,020), and R3 (25,187), while immediate support levels are S1 (24,537), S2 (24,406), and S3 (24,232).
The Nifty index had reached a day’s high at 24,737.05 and saw a day’s low at 24,533.20. Finally, it had closed at 24,715.05, in green above the 24,700 level, gaining 135.45 points, or 0.55%. The Nifty 50 closed above the 100/200 EMAs but remained above the 20/50 EMAs in the daily time frame.
Momentum Indicators
RSI (Daily): The Nifty 50’s RSI stood at 48.51, which is well below the overbought zone of 70, but closer to the oversold zone of 30.
Bollinger Bands (Daily): Nifty 50 is currently trading at the upper band and near the middle band (Simple Moving Average), reflecting bullishness. A sustained move above the middle band could signal a potential bullish shift, while a drop back toward the lower band may reinforce bearish sentiment.
Volume Analysis: Wednesday’s trading session was accompanied by above-average volumes (340.28 Mn), encouraged by anticipations of a stimulus driven by consumption as a result of the possible rationalisation of the GST slab.
Derivatives Data: Options OI indicates strong Put writing at 24,700, following 24,600, establishing it as a firm support zone. On the upside, a significant Call OI buildup at 24,800 and 25,000 suggests a potential resistance supply. PCR (Put/Call Ratio) stands at 1.2634 (>1), leaning towards Bearish sentiment and the short buildup signals the expectation of downside.
Bank Nifty
(In this analysis, we have used 20/50/100/200 EMAs, where 20 EMA (Red), 50 EMA (Orange), 100 EMA (Light Blue), and 200 EMA (Dark Blue)).
The Bank Nifty Index started the session on a negative note at 53,630.75 on Wednesday, down by 30.25 points from Tuesday’s closing of 53,661.00. The index began on a bearish note but later rebounded to the 53,850 mark from the opening low and traded above its opening level at 53,745 in the morning session. The index was traded below all four EMAs of 20/50/100/200 in the 15-minute time frame and was trading between the 53,550 and 53,850 levels in the morning session.
The Bank Nifty index further gained its momentum and surged to the day’s high at the 54,136 mark and held above the 54,000 mark during the afternoon session and traded in the green. During the afternoon session, Bank Nifty closed above the EMAs of 20/50/100 but remained below the 200 EMAs in the 15-minute time frame. Bank Nifty immediate resistance levels are R1 (54,176), R2 (54,720), and R3 (55,301), while immediate support levels are S1 (53,594), S2 (52,796), and S3 (52,080).
The Bank Nifty index had peaked at 54,136.15 and made a day’s low at 53,561.75. Finally, it had closed in green at 54,067.55, breaking above the 54,000 level, gaining 406.55 points or 0.76%. The Relative Strength Index (RSI) stood at 37.16 and was near the oversold zone in the daily time frame, and Bank Nifty closed below the EMAs of 20/50/100 but remained above the 200 EMA in the daily time frame.
Sensex
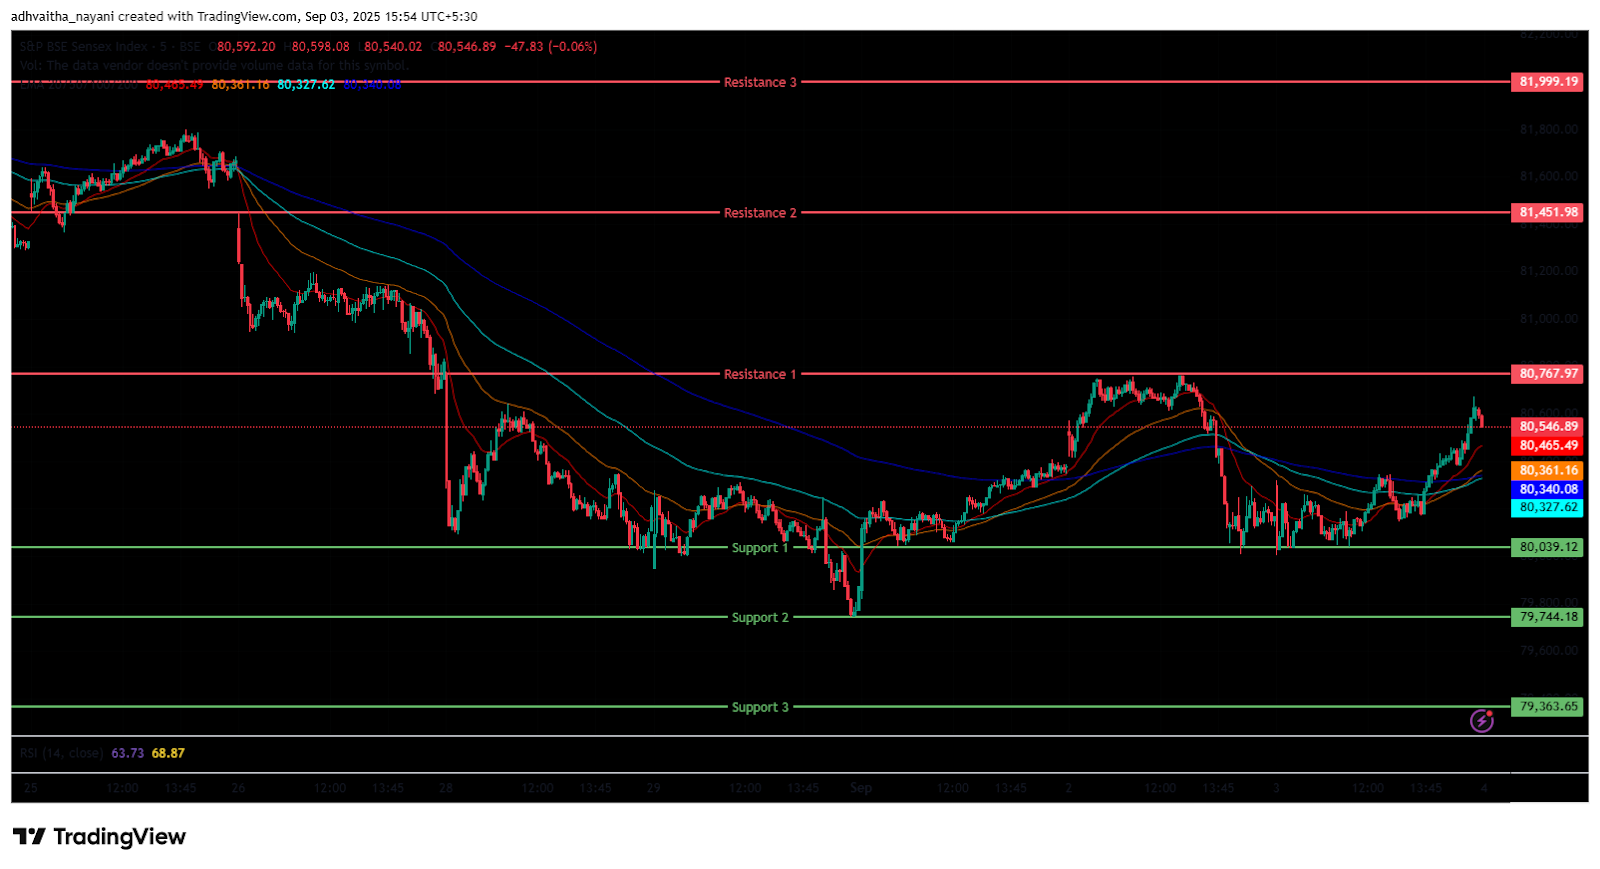
(In this analysis, we have used 20/50/100/200 EMAs, where 20 EMA (Red), 50 EMA (Orange), 100 EMA (Light Blue), and 200 EMA (Dark Blue)).
To view other technical reports, click here
The BSE Sensex Index opened on a positive note at 80,295.99 on Wednesday, up by 138.11 points from Tuesday’s closing of 80,157.88. The Index was more volatile in the morning session; after a bullish start, the Index surged above the 80,300 mark and was trading below its opening level in the morning session at 80,255. The Index was traded above the EMA of 20 but remained below the 50/100/200 EMAs in the 15-minute time frame and was trading between 80,000 and 80,350 in the morning session.
The Sensex Index further gained its momentum and surged to the 80,650 mark in the afternoon session and held above the 80,550 mark, maintaining its overall positive trend, and was trading above the EMAs of 20/50/100 but remained below the 200 EMA in the 15-minute time frame. BSE Sensex immediate resistance levels are R1 (80,768), R2 (81,452), and R3 (81,999), while immediate support levels are S1 (80,039), S2 (79,744), and S3 (79,364).
The BSE Sensex index had peaked at 80,671.28 and made a day’s low at 80,004.60. Finally, it had closed at 80,567.71 in green, gaining 409.83 points, or 0.51%. The Relative Strength Index (RSI) stood at 46.01 (below the overbought zone of 70 but nearing the oversold zone in the daily time frame), and the BSE Sensex closed below the EMAs of 20/50/100 but remained above the 200 EMA in the daily time frame.
India VIX
The India VIX decreased by 0.47 points or 4.12%, from 11.40 to 10.93 during Wednesday’s session. A decrease in the India VIX typically indicates lower expected volatility in the stock market, suggesting a calmer and more stable market environment.
Market Recap on the 3rd of September 2025
On Wednesday, the Nifty 50 opened at 24,616.50, up 36.90 points from its previous close of 24,579.60. It hit an intraday high of 24,737.05 and closed the day at 24,715.05, gaining 135.45 points or 0.55%. It finished below 20/50-day EMAs but stayed above 100/200-day EMAs on a daily basis. The BSE Sensex followed a similar trajectory, rising 409.83 points, or 0.51%, after opening at 80,295.99 and settling at 80,567.71.
In terms of momentum, the Nifty 50’s Relative Strength Index (RSI) stood at 48.51, while the Sensex RSI was at 46.01, both remaining below the overbought threshold of 70. The Bank Nifty Index also followed the bullish trend and ended in green, rising 406.55 points, or 0.76%, to close at 54,067.55.
The majority of the sectoral indices ended the day in green, except for a few losers. The Nifty Metal Index was the top gainer, closing at 9,676.40, up by 292.05 points, or 3.11%. Metal stocks, including Tata Steel Ltd, Jindal Steel Ltd, SAIL, and Hindustan Copper Ltd, rose up to 5.97%. The Nifty Pharma Index followed the gains, closing at 21,959.60, up by 239.65 points, or 1.10%.
Glenmark Pharma was the biggest gainer, increasing by 4.46%, followed by Lupin Ltd, which gained 3.25%, and Ajanta Pharma Ltd, up 3.1%. The Nifty Healthcare Index also remains one of the top gainers, closing at 14,496.65, up by 154.35 points, or 1.08%.
Among the major losers, the Nifty IT index plunged the most on Wednesday’s trading session. The index decreased by -262.95 points, or -0.74%, closing at 35,474.95. Infosys Ltd was the major loser, dropping -1.31%, followed by Other IT stocks, including Coforge Ltd, LTIMindtree Ltd, and Oracle Financial Services, which declined by up to -1.30%. The Nifty Media Index also closed in red, closing at 1,621.95, declining marginally by -0.65 points, or -0.04%. Major losers include Nazara Technologies Ltd, Tips Music Ltd, Sun TV Network Ltd, and Dish TV India Ltd, whose shares declined by up to -1.98%.
In contrast, Asian markets showed a bearish trend on Wednesday, with Hong Kong’s Hang Seng Index ending in red at 25,327.00, declining -169.55 points, or -0.67%. Following the same trend, the Shanghai Composite Index closed at 3,813.56, losing -44.57 points, or -1.17%. However, South Korea’s KOSPI Index closed in green at 3,184.42, up 12.07 points, or 0.38%. Japan’s Nikkei 225 Index also closed in the red at 42,930, down -380.49 points, or -0.91%. The US Dow Jones Futures were trading at 45,308.56, up 12.75 points, or 0.03%, as of 4:50 p.m. IST.
Trade Setup Summary
The Nifty 50 opened on a positive note at 24,616.50 on Wednesday and ended the day in the green above the 24,700 level at 24,715.05. A break below 24,537 could trigger further selling towards 24,406, while a break above 24,812 could trigger bullishness towards 25,020.
Bank Nifty started the session on a negative note at 53,630.75 but ended the session in the green at 54,067.55, above the 54,000 level. A break below 53,594 could trigger further selling towards 52,796, while a break above 54,176 could trigger bullishness towards 54,720.
Sensex opened on a positive note at 80,295.99 on Wednesday and ended in the green at 80,567.71, breaking above the 80,550 level. A break below 80,039 could trigger further selling towards 79,744, while breaking the next resistance level of 80,768 could lead towards the 81,452 level.
Given the ongoing volatility and mixed sentiments, it’s advisable to avoid aggressive positions and wait for clear directional moves above resistance or below support. Traders should consider these key support and resistance levels when entering long or short positions following the price break from these critical levels. Additionally, traders can combine moving averages to identify more accurate entry and exit points.
Disclaimer

The views and investment tips expressed by investment experts/broking houses/rating agencies on tradebrains.in are their own, and not that of the website or its management. Investing in equities poses a risk of financial losses. Investors must therefore exercise due caution while investing or trading in stocks. Trade Brains Technologies Private Limited or the author are not liable for any losses caused as a result of the decision based on this article. Please consult your investment advisor before investing.
About: Trade Brains Portal is a stock analysis platform. Its trade name is Dailyraven Technologies Private Limited, and its SEBI-registered research analyst registration number is INH000015729.
Investments in securities are subject to market risks. Read all the related documents carefully before investing.
Registration granted by SEBI and certification from NISM in no way guarantee performance of the intermediary or provide any assurance of returns to investors.

