The Indian stock markets ended Tuesday in negative territory, with both the Nifty 50 and Sensex showing a downward bias throughout the session. Despite opening slightly lower, the indices faced selling pressure and moved further down, reflecting cautious investor sentiment. While the broader market retained technical support above key moving averages, sectoral performance was mixed. Consumer durables managed to outperform, supported by gains in select companies, while public sector, capital market, and defence-related stocks dragged the overall indices lower. The Bank Nifty also closed in the red, adding to the overall subdued mood.
Across Asia, major markets largely mirrored the cautious sentiment seen in India, with key indices in Japan, Hong Kong, China, and South Korea registering declines. The losses were broad-based, indicating risk-off sentiment among investors amid regional concerns. U.S. futures were also trading lower, suggesting that global market participants were apprehensive, which further reinforced the cautious tone in domestic markets. Overall, both domestic and international markets reflected a mood of caution, with defensive and selective sectoral interest prevailing.
In this overview, we will analyse the key technical levels and trend directions for Nifty and BSE Sensex to monitor in the upcoming trading sessions. All the charts mentioned below are based on the 5-minute timeframe.
NIFTY 50 Chart & Price Action Analysis
(In this analysis, we have used 20/50/100/200 EMAs, where 20 EMA (Red), 50 EMA (Orange), 100 EMA (Light Blue), 200 EMA (Dark Blue)).
To view other technical reports, click here
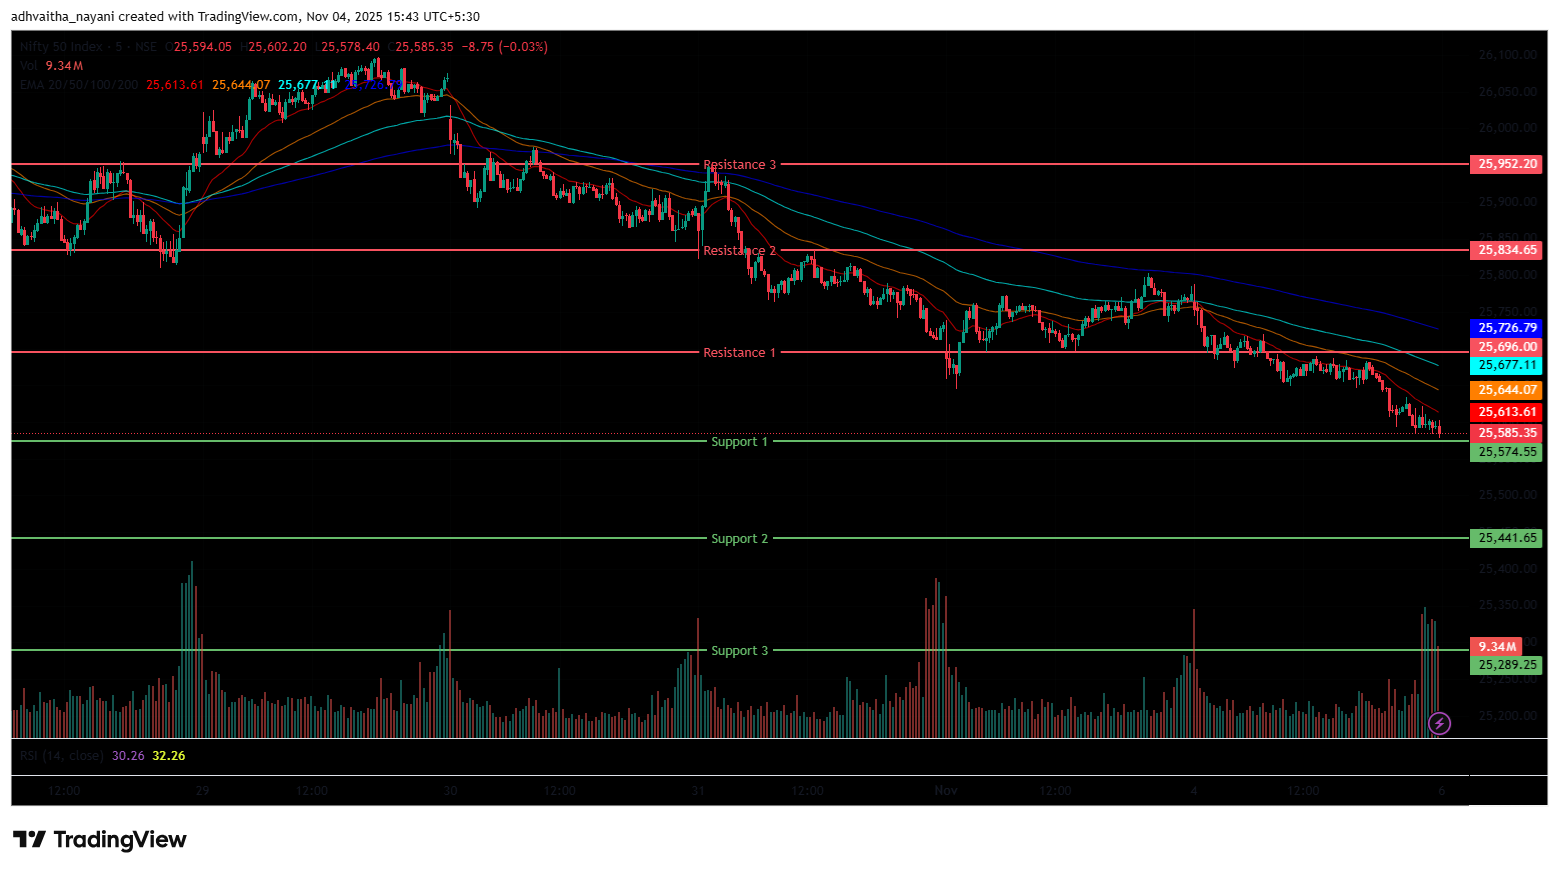
The Nifty 50 Index opened on a negative note at 25,744.75 on Tuesday, down by 18.6 points from Monday’s closing of 25,763.35. The index opened on a bearish note and continued to decline during the morning session and traded within the 25,750-25,650 range. It traded below all four EMAs of 20/50/100/200 in the 15-minute chart. In the afternoon session, the index further moved downwards and hit an intraday low of 25,578.4, falling below the 25,600 level.
Overall, the Index traded within a 25,650-25,600 range throughout the afternoon session. During the afternoon session, the Nifty 50 closed below all four 20/50/100/200 EMAs in the 15-minute time frame. The Nifty’s immediate resistance levels are R1 (25,696), R2 (25,834), and R3 (25,952), while immediate support levels are S1 (25,575), S2 (25,442) and S3 (25,289).
The Nifty index had reached a day’s high at 25,787.4 and saw a day’s low at 25,578.4. Finally, it had closed at 25,597.65, in the red and below the 25,600 level, down 165.70 points, or 0.64%. The Nifty 50 closed above the EMAs of 50/100/200 but below the 20-day EMA in the daily time frame.
NIFTY 50 Momentum Indicators Analysis
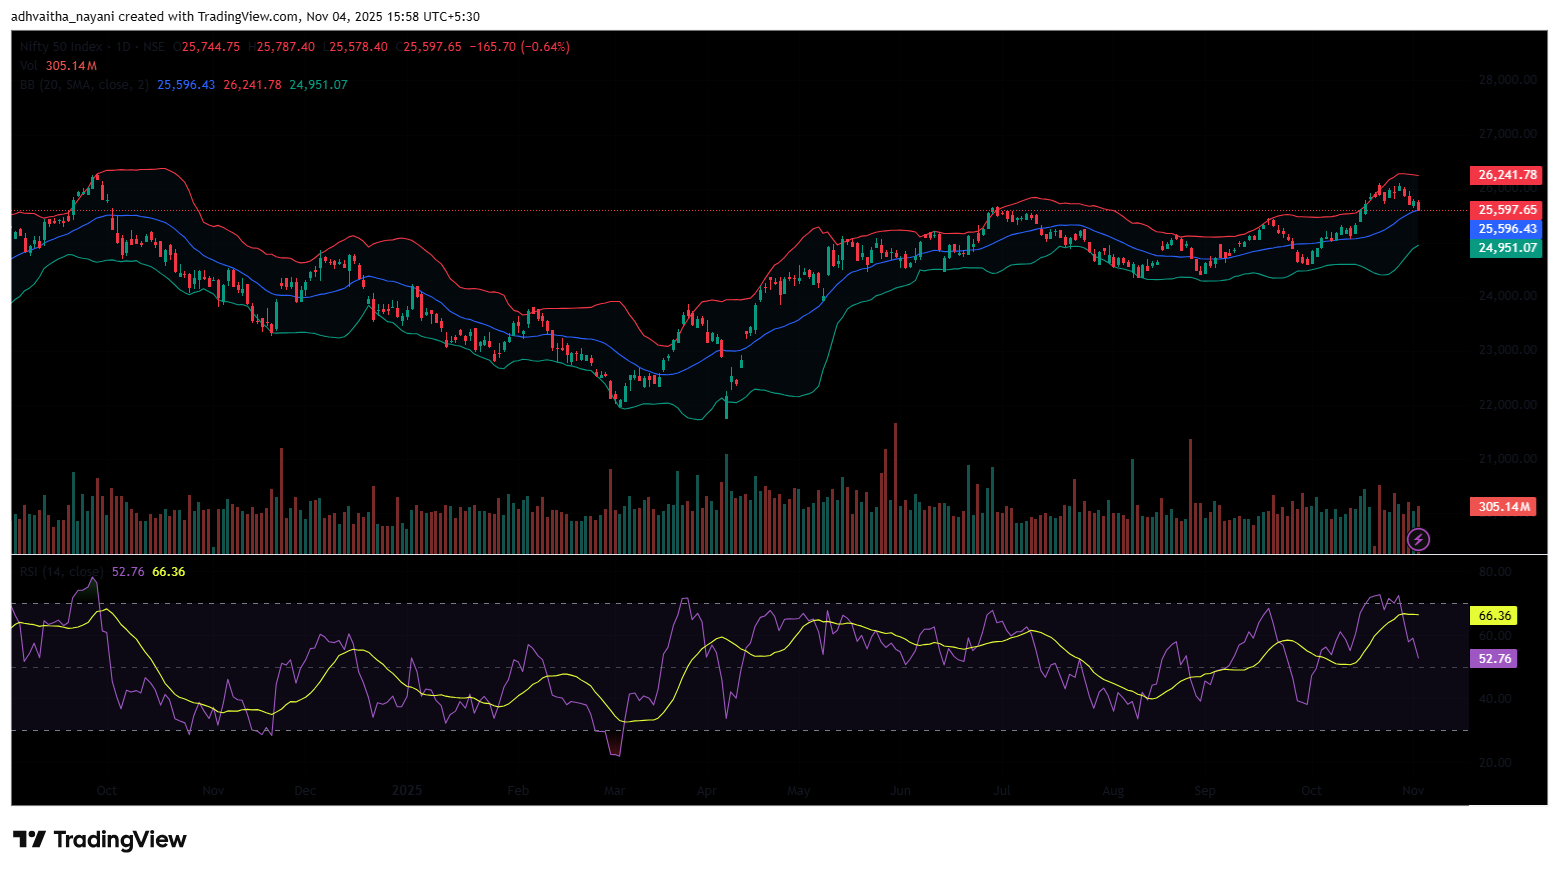
RSI (Daily): The Nifty 50’s RSI stood at 52.76, which is below the overbought zone of 70, near the support zone of 40-50.
Bollinger Bands (Daily): The index is trading in the upper band of the Bollinger Band range but has touched the middle band (Simple Moving Average). Its position in the upper range suggests a bullish sentiment, yet the index remains close to the middle band on the daily timeframe, potentially using the middle band as support. The index took support near 25,575, and 25,696 acted as a resistance level. A sustained move above the middle band signals a bullish sentiment, while a drop back toward the lower band may reinforce bearish sentiment.
Volume Analysis: Tuesday’s trading session had an average volume of 305.14 Mn.
Derivatives Data: Options OI indicates strong Put writing at 25,550, followed by 25,500, establishing it as a firm support zone. On the upside, a significant Call OI buildup at 25,600 and 25,650 suggests a potential resistance supply. PCR (Put/Call Ratio) stands at 0.62 (<1), leaning towards bullish sentiment, but the short Buildup indicates a Bearish outlook, thus indicating near-term volatility for the next trading session.
Bank Nifty Chart & Price Action Analysis
(In this analysis, we have used 20/50/100/200 EMAs, where 20 EMA (Red), 50 EMA (Orange), 100 EMA (Light Blue), 200 EMA (Dark Blue)).
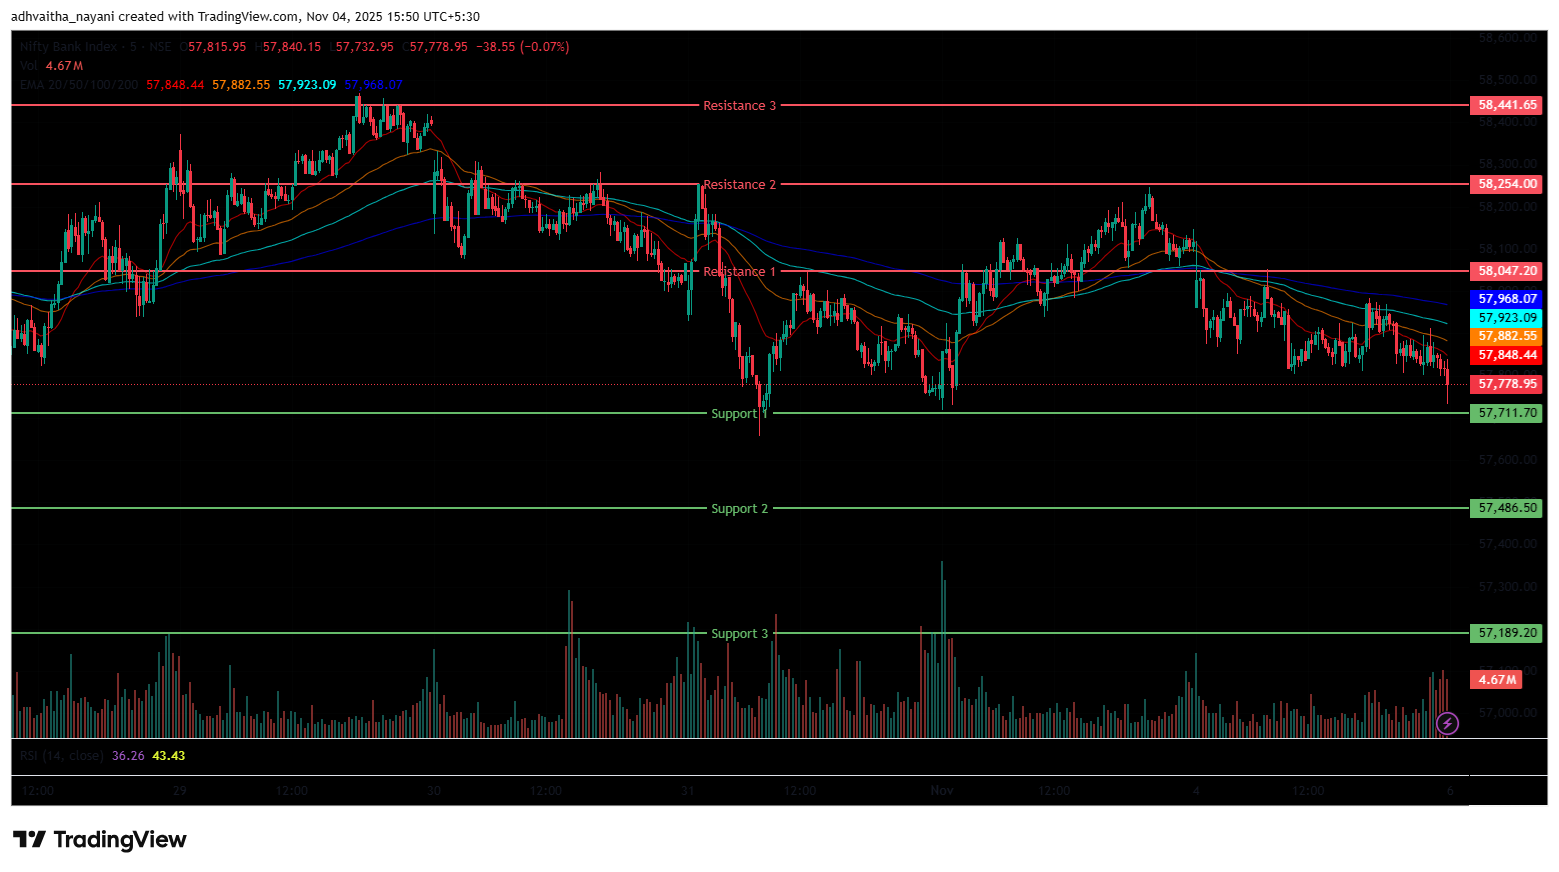
The Bank Nifty Index started the session on a negative note at 57,966.65 on Tuesday, down by 134.8 points from Monday’s closing of 58,101.45. The index started on a Bearish note, but was trading in a range-bound manner around the 58,000 level. In addition, the index was trading above the EMA of 200 and below the 20/50/100 EMAs in the 15-minute time frame in the morning session. In the afternoon session, the Index hit an intraday low at 57,732.92, nearing the 57,700 level.
Further, the Index was trading in the range of 57,850-57,750, and ended with losses in red. During the afternoon session, Bank Nifty closed below all four EMAs of 20/50/100/200 in the 15-minute time frame. The Bank Nifty’s immediate resistance levels are R1 (58,047), R2 (58,254) and R3 (58,442), while immediate support levels are S1 (57,712), S2 (57,487), and S3 (57,189).
The Bank Nifty index had peaked at 58,119.65 and made a day’s low at 57,733. Finally, it had closed in red at 57,827.05, dropping below the 58,000 level, losing 274.40 points or 0.47%. The Relative Strength Index (RSI) stood at 60.75, below the overbought zone of 70 in the daily time frame, and Bank Nifty closed above all four EMAs of 20/50/100/200 in the daily time frame.
BSE Sensex Chart & Price Action Analysis
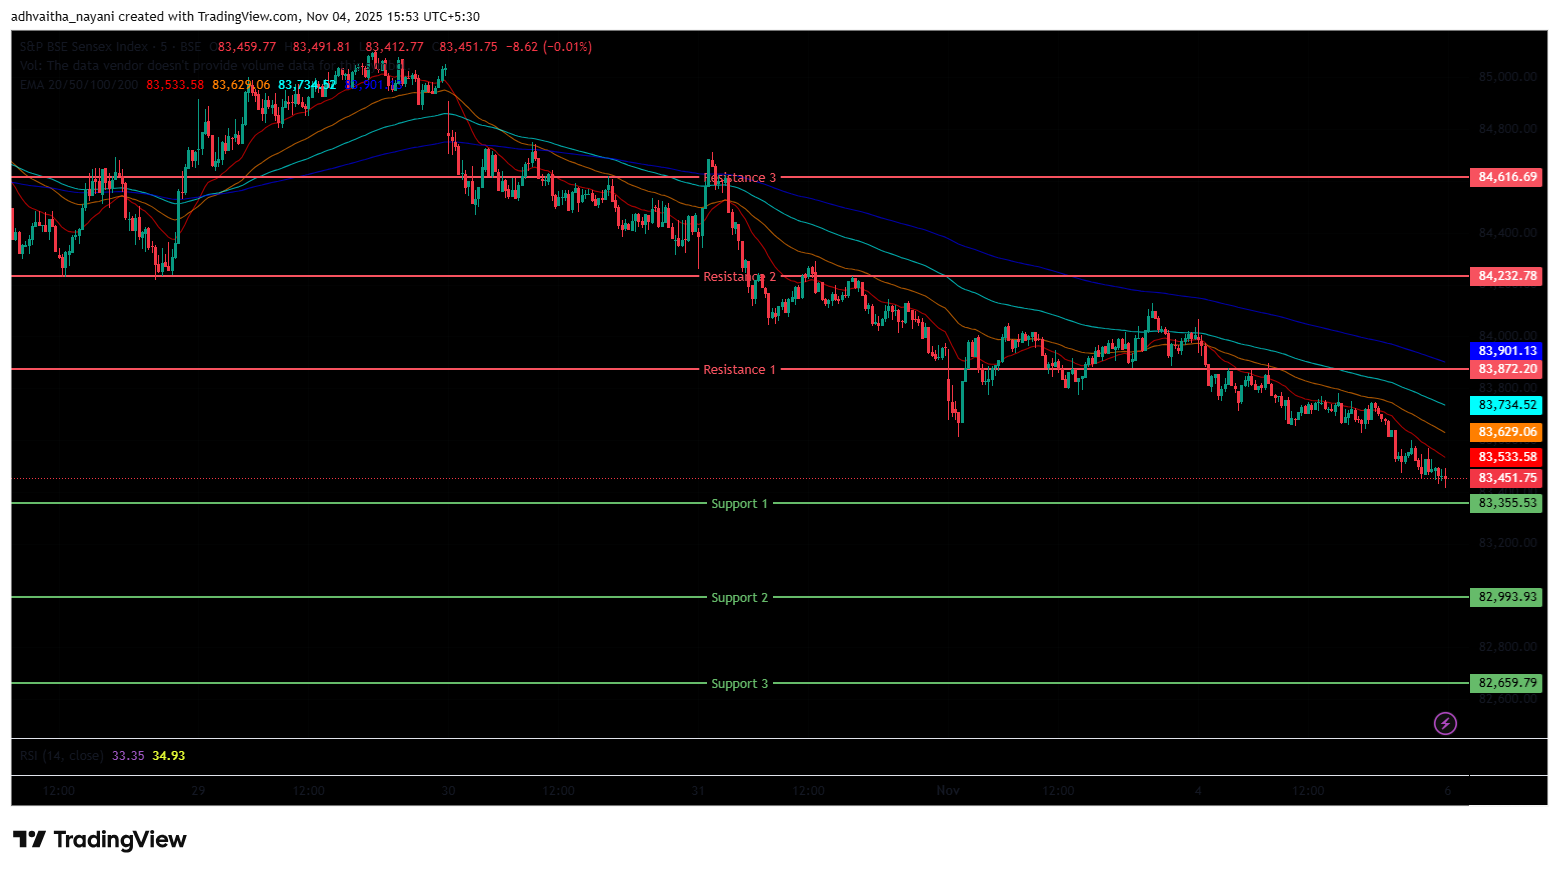
(In this analysis, we have used 20/50/100/200 EMAs, where 20 EMA (Red), 50 EMA (Orange), 100 EMA (Light Blue), 200 EMA (Dark Blue)).
To view other technical reports, click here
The BSE Sensex Index opened on a muted note at 84,000.64 on Tuesday, down by 22.15 points from Monday’s closing of 83,978.5. The index started its session on a flat note, but later, it moved slightly downwards and was trading within the 83,850-83,750 range. It traded below all four EMAs of 20/50/100/200 EMA in the 15-minute time frame in the morning session.
In the afternoon session, the Index further dropped and touched 83,413, marking its day’s low, falling below 83,500. The Index was trading in the 83,700-83,450 range, following a bearish trend and closed below all four EMAs of 20/50/100/200 EMA in the 15-minute time frame. The BSE Sensex immediate resistance levels are R1 (83,872), R2 (84,233) and R3 (84,617), while immediate support levels are S1 (83,356), S2 (82,994), and S3 (82,660).
The BSE Sensex index had peaked at 84,068 and made a day’s low at 83,413. Finally, it had closed at 83,459.15 in red, declining 519.34 points or 0.62%. The Relative Strength Index (RSI) stood at 52.08, below the overbought zone of 70 in the daily time frame, and the BSE Sensex closed above the EMAs of 50/100/200 but below the 20-day EMA in the daily time frame.
India VIX
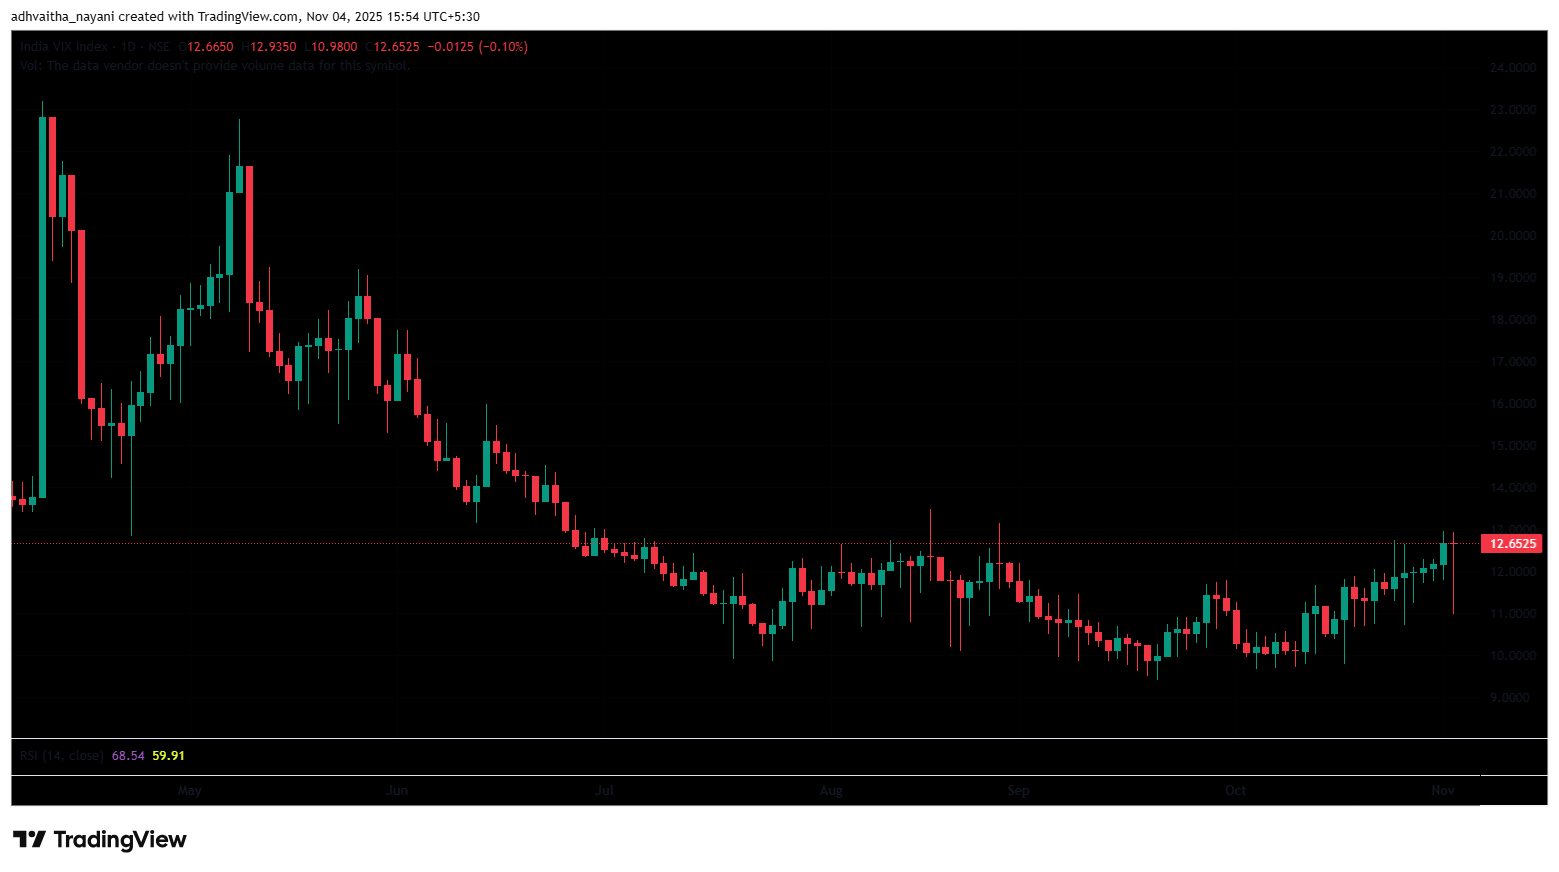
The India VIX was down 0.0125 points or 0.10%, from 12.67 to 12.65 during Tuesday’s session. The India VIX was more on a flatter note, thus giving a more mixed outlook regarding volatility. However, a stable market environment and minimal volatility are anticipated when the India VIX is below 15.
Market Recap on November 4th, 2025
On Tuesday, the Nifty 50 started on a slightly negative note at 25,744.75, down -18.6 points from its previous close of 25,763.35. The index moved towards a downward trajectory, hitting an intraday low of 25,578.4 before closing at 25,597.65, down -165.7 points (0.64%), near the 25,600 mark. Except for the 20-day EMA, the Nifty stayed above all major moving averages (50/100/200-day EMAs), reflecting strong underlying technical support.
The BSE Sensex followed a similar trajectory, opening lower at 84,000.64 (lower by -67.37 points from the previous close of 84,068.01), went below the 83,500 mark, and eventually settled at 83,459.15, down -519.34 points (0.62%). Both benchmarks ended the day in negative territory, with RSI values below the overbought zone (over 70), 52.76 for Nifty 50 and 52.08 for Sensex. The Bank Nifty also closed with losses of -274.4 points (0.47%) at 57,827.05.
Among sectoral indices, most ended in the red except the Nifty Consumer Durable Index, which remained the top performer for Tuesday, rising 0.4% (151.9 points) to 38,654.95, driven by decent gains in Titan Company Ltd, Kalyan Jewellers India Ltd, and V-Guard Ltd, which advanced up to 2.4%.
On the downside, the Nifty CPSE Index was the biggest laggard, falling 1.7% (-112.5 points) to 6,494.1. NBCC Ltd led the declines with a 3.1% drop, followed by losses in Powergrid Corp Ltd, Coal India Ltd, and ONGC Ltd (up to -3.1%). The Nifty Capital Markets Index slipped 1.5% (-69.05 points) to 4,527.35, dragged by CDSL Ltd, KFin Technologies Ltd, and CAMS Ltd, which fell as much as 3.4%. The Nifty India Defence Index also closed lower by 1.5% (-121.8 points) at 8,053.10.
In the broader Asian markets, sentiment was mostly negative. Japan’s Nikkei 225 fell 1.74% (-914.14 points) to 51,497.20, Hong Kong’s Hang Seng also fell 0.79% (-205.96 points) to 25,952.40, China’s Shanghai Composite plunged 0.41% (-16.33 points) to 3,960.19, and South Korea’s KOSPI fell 2.37% (-100.13 points) to 4,121.74. As of 5:03 p.m. IST, U.S. Dow Jones Futures were down 0.69% (-324.37 points) at 47,009.31.
Trade Setup Summary
The Nifty 50 opened on a negative note at 25,745 on Tuesday and ended the session in the red below the 25,600 level at 25,597.65. A break below 25,575 could trigger further selling towards 25,442, while breaking the next resistance level of 25,696 could trigger bullishness towards the 25,835 level.
The Bank Nifty also started the session on a negative note at 57,967 and ended the session in the red at 57,827.05, near the 57,800 level. A break below 57,712 could trigger further selling towards 57,487, while breaking the next resistance level of 58,047 could trigger bullishness towards the 58,254 level.
The Sensex opened on a flat note at 84,000.64 but ended the session on a negative note at 83,459.15, below the 83,500 level. A break below 83,355 could trigger further selling towards 82,994, while breaking the next resistance level of 83,872 could trigger bullishness towards the 84,233 level.
Given the ongoing volatility and mixed sentiments, it’s advisable to avoid aggressive positions and wait for clear directional moves above resistance or below support. Traders should consider these key support and resistance levels when entering long or short positions following the price break from these critical levels. Additionally, traders can combine moving averages to identify more accurate entry and exit points.
Disclaimer

The views and investment tips expressed by investment experts/broking houses/rating agencies on tradebrains.in are their own, and not that of the website or its management. Investing in equities poses a risk of financial losses. Investors must therefore exercise due caution while investing or trading in stocks. Trade Brains Technologies Private Limited or the author are not liable for any losses caused as a result of the decision based on this article. Please consult your investment advisor before investing.
About: Trade Brains Portal is a stock analysis platform. Its trade name is Dailyraven Technologies Private Limited, and its SEBI-registered research analyst registration number is INH000015729.
Investments in securities are subject to market risks. Read all the related documents carefully before investing.
Registration granted by SEBI and certification from NISM in no way guarantee performance of the intermediary or provide any assurance of returns to investors.
