
Indian equity markets extended their gains for the third consecutive session on Monday, supported by strong buying in financial and IT stocks, along with encouraging Q2 business updates. The Nifty 50 opened on a slightly positive note and maintained upward momentum throughout the session. It touched an intraday high but settled just below the key psychological level of 25,100. Technically, the index continued to trade above all major moving averages on the daily chart, indicating sustained bullish sentiment. Momentum indicators also reflected moderate strength, suggesting further room for upside.

Sector-wise, IT led the gains, followed by capital markets and digital stocks, with notable performances from major players in these segments. On the other hand, media and metal stocks saw selling pressure, dragging their respective indices lower.

The broader market sentiment remained positive, with the Bank Nifty also closing in the green. Globally, Asian markets had a mixed session, Japan rallied sharply on political developments, while Hong Kong slipped. Markets in China and South Korea were closed. U.S. futures traded in the green during Indian market hours, adding to the overall positive tone.
In this overview, we will analyse the key technical levels and trend directions for Nifty and BSE Sensex to monitor in the upcoming trading sessions. All the charts mentioned below are based on the 5-minute timeframe.
Nifty 50
(In this analysis, we have used 20/50/100/200 EMAs, where 20 EMA (Red), 50 EMA (Orange), 100 EMA (Light Blue), and 200 EMA (Dark Blue)).
To view other technical reports, click here
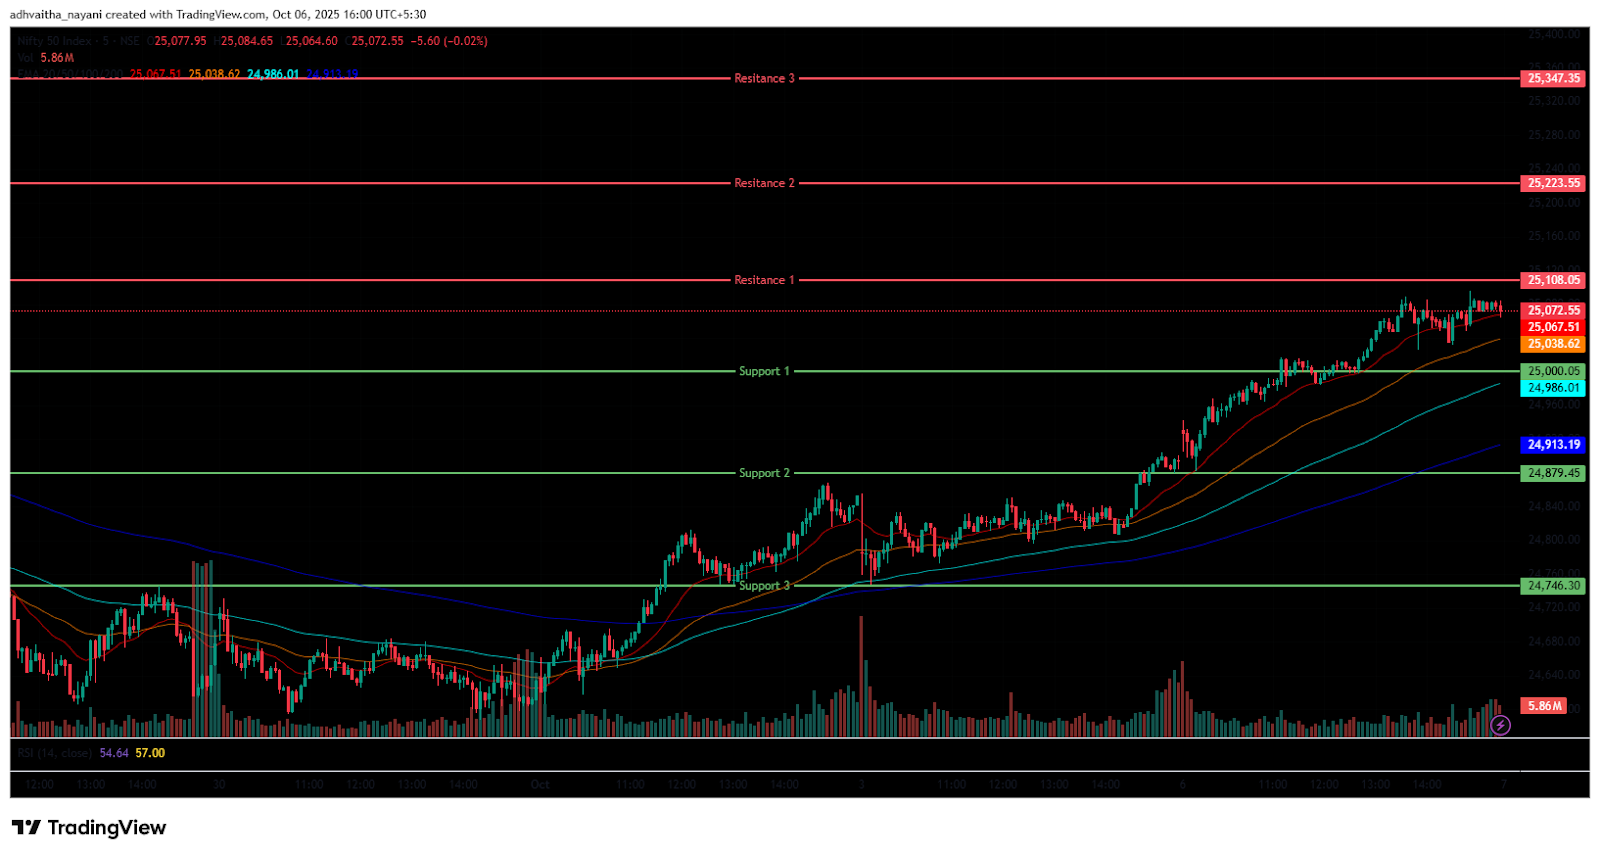
The Nifty 50 Index opened on a positive note at 24,916.55 on Monday, up by 22.3 points from Friday’s closing of 24,894.25. With a bullish start to the day, the index had a volatile morning session, trading in the 24,850 to 25,050 range. Additionally, the Index stood above all four EMAs of 20/50/100/200 in the 15-minute time frame during the morning session.
Further, the index gained its momentum and surged as high as the 25,096 mark, the day’s high in the afternoon session, and was traded above its opening level, between the range of 25,000 and 25,100. During the afternoon session, the Nifty 50 traded above all four EMAs of 20/50/100/200 in the 15-minute time frame. Nifty’s immediate resistance levels are R1 (25,108), R2 (25,223), and R3 (25,347), while immediate support levels are S1 (25,000), S2 (24,879), and S3 (24,746).
The Nifty index had reached a day’s high at 25,095.95 and saw a day’s low at 24,881.65. Finally, it had closed at 25,077.65, in green above the 25,050 level, gaining 183.40 points, or 0.74%. The Nifty 50 closed above all four EMAs of 20/50/100/200 in the daily time frame.
Momentum Indicators
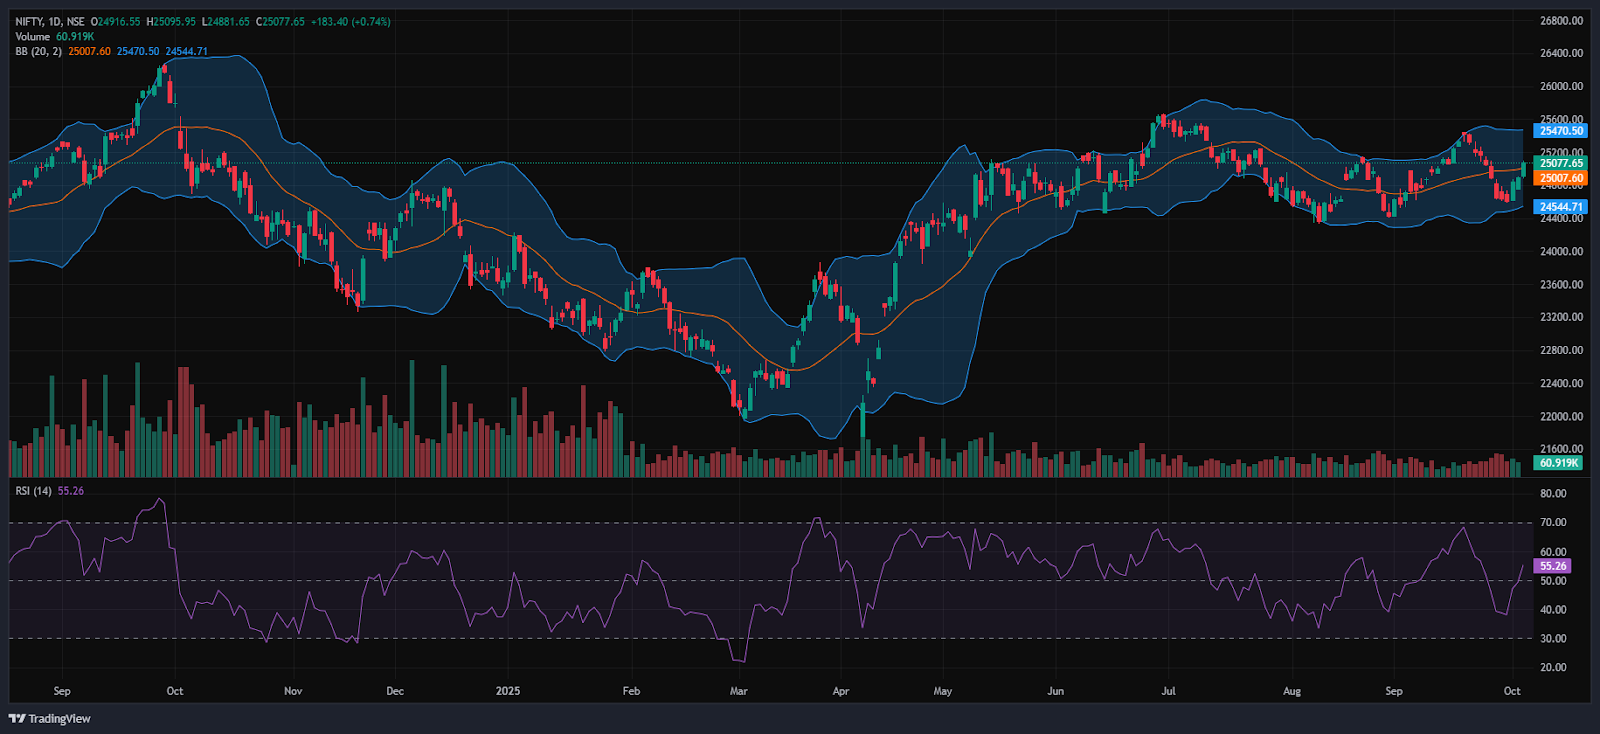
RSI (Daily): The Nifty 50’s RSI stood at 55.26, which is well below the overbought zone of 70, indicating a bullish sentiment with rising volumes.
Bollinger Bands (Daily): The index is trading in the upper band of its Bollinger Band range above the middle band (Simple Moving Average). Its position in the upper range indicates a bullish sentiment and on Monday the Nifty Index formed Strong Bullish Candle in the daily time frame by breaking above the previous Resistance levels of 24,900 and 25,000. A sustained move above the middle band signals a bullish sentiment, while a drop back toward the lower band may reinforce bearish sentiment.
Volume Analysis: Monday’s trading session had average volumes, which stood at 271.95 Mn.
Derivatives Data: Options OI indicates strong Put writing at 25,000, following 24,900, establishing it as a firm support zone. On the upside, a significant Call OI buildup at 25,100 and 25,200 suggests a potential resistance supply. PCR (Put/Call Ratio) stands at 1.5174 (>1), leaning towards bearish sentiment and the Long Unwinding signals a Strong bearish signal, with an overall bearish outlook for the next trading session.
Bank Nifty
(In this analysis, we have used 20/50/100/200 EMAs, where 20 EMA (Red), 50 EMA (Orange), 100 EMA (Light Blue), and 200 EMA (Dark Blue)).
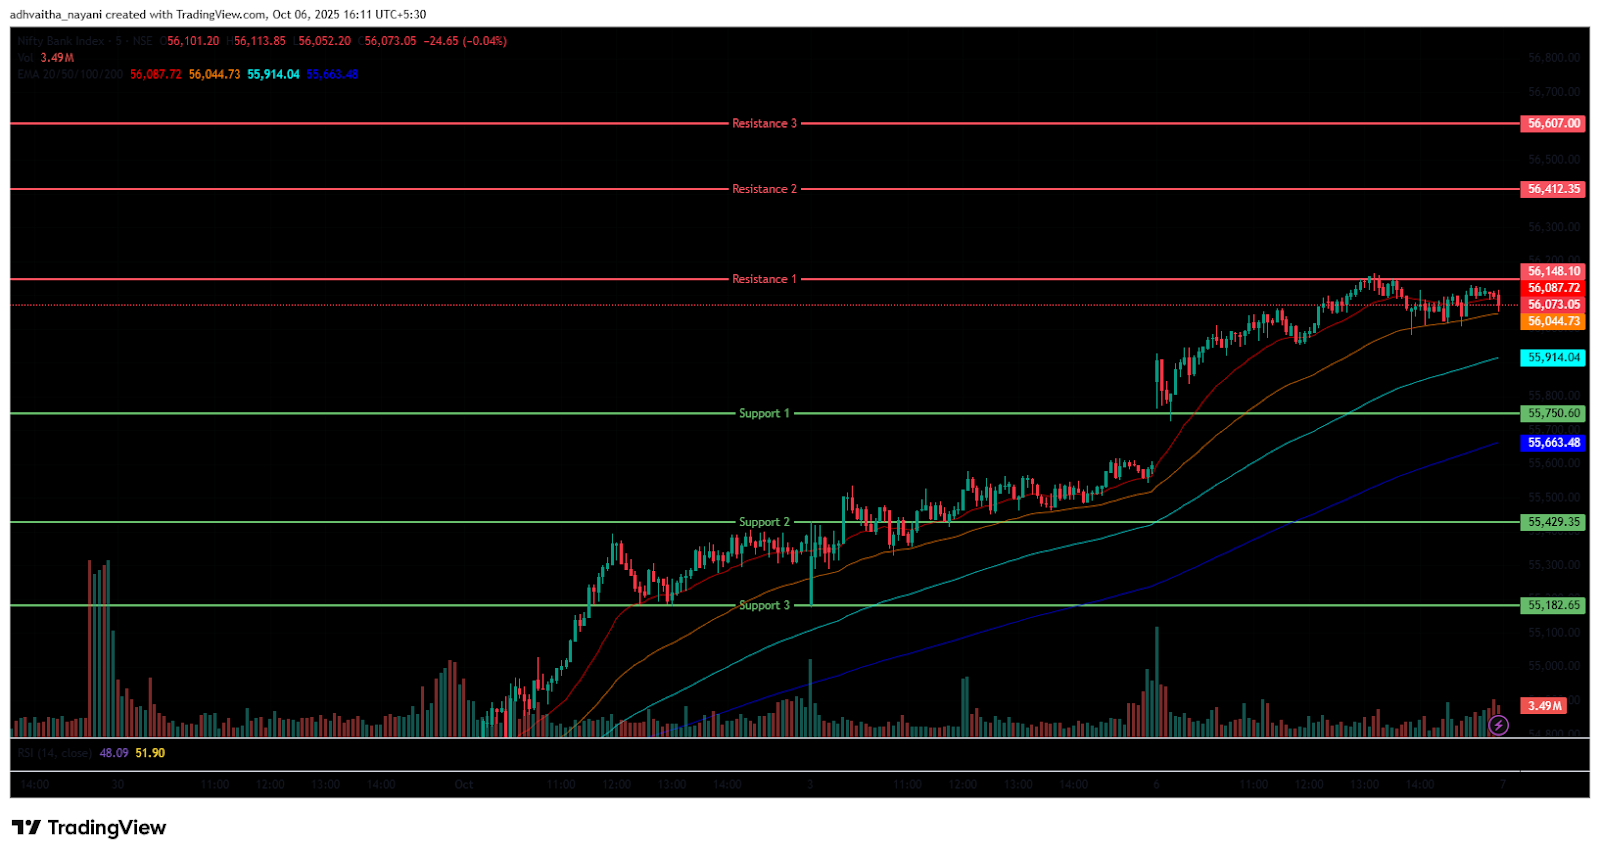
The Bank Nifty Index also started the session on a positive note with a gap-up at 55,834.70 on Monday, up by 245.45 points from Friday’s closing of 55,589.25. The index was trading between the range of 55,750 and 56,150 in the morning session, indicating high volatility. In addition, the index was trading above all four EMAs of 20/50/100/200 in the 15-minute time frame.
In the afternoon session, the Index consolidated and sustained above the 56,164, mark its day high and was traded around the range of 55,950 and 56,200, ending in green. During the afternoon session, Bank Nifty closed above all four EMAs of 20/50/100/200 in the 15-minute time frame. Bank Nifty immediate resistance levels are R1 (56,148), R2 (56,412), and R3 (56,607), while immediate support levels are S1 (55,750), S2 (55,429), and S3 (55,183).
The Bank Nifty index had peaked at 56,164.20 and made a day’s low at 55,727.25. Finally, it had closed in green at 56,104.85, closing above the 56,100 level, gaining 515.60 points or 0.93%. The Relative Strength Index (RSI) stood at 63.42 well below the overbought zone of 70 in the daily time frame, and Bank Nifty closed above all four EMAs of 20/50/100/200 in the daily time frame.
Sensex
(In this analysis, we have used 20/50/100/200 EMAs, where 20 EMA (Red), 50 EMA (Orange), 100 EMA (Light Blue), and 200 EMA (Dark Blue)).
To view other technical reports, click here
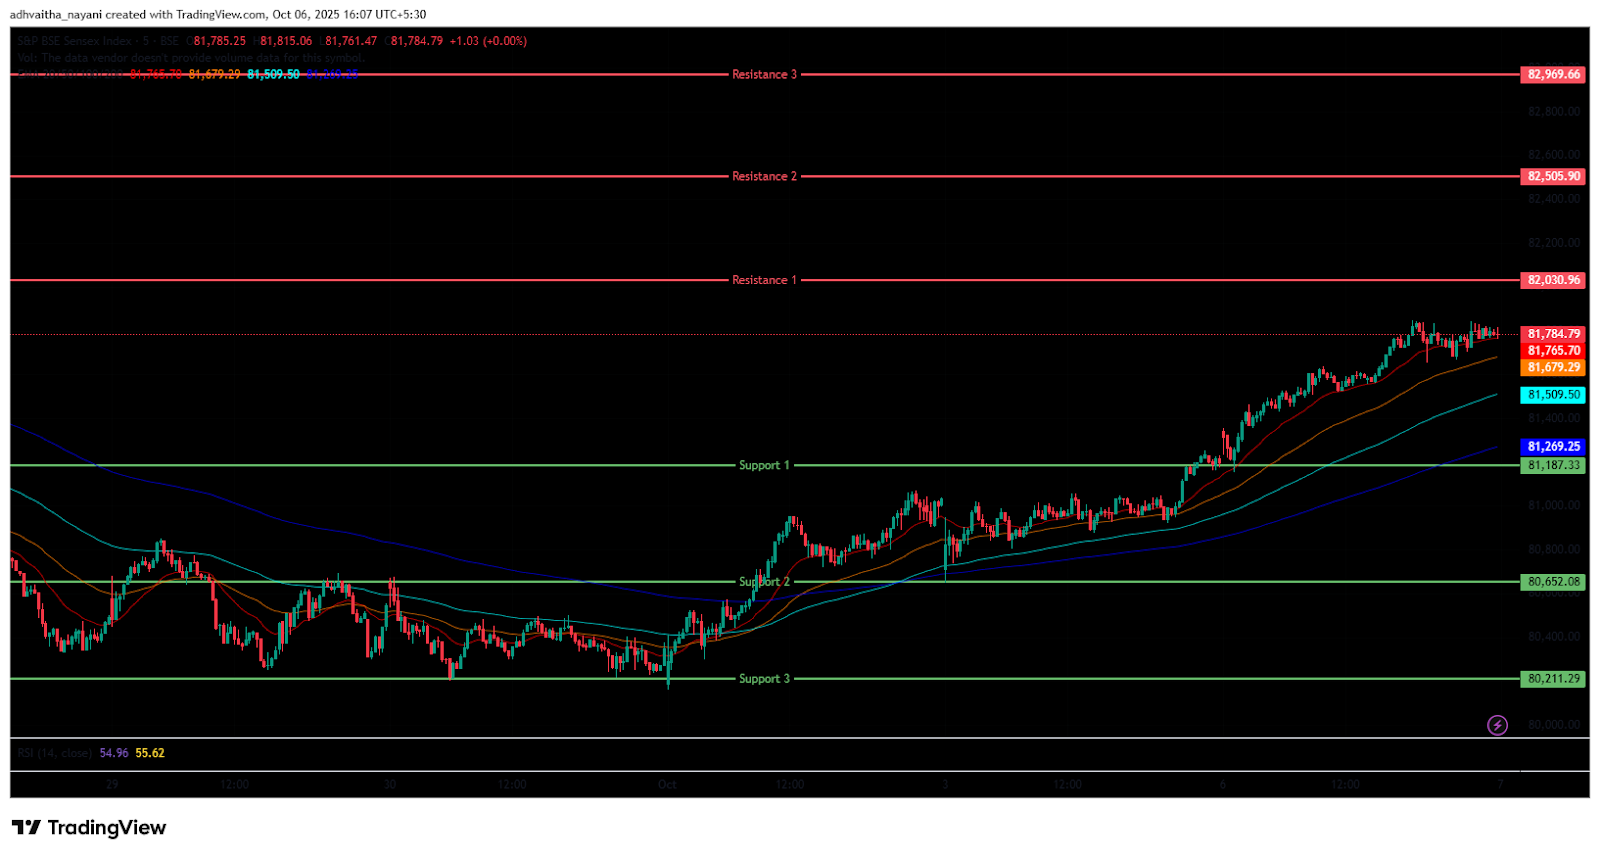
The BSE Sensex Index also opened on a positive note at 81,274.79 on Monday, up by 67.62 points from Friday’s closing of 81,207.17. The index started its session on a bullish note and was trading in the 81,100 to 81,650 range throughout the morning session’s 15-minute time frame, above all four EMAs of the 20/50/100/200.
In the afternoon session, the Index further surged to the 81,846 level, marking its day high and was traded between 81,550 and 81,850, maintaining its overall bullish trend and closing above all four EMAs of 20/50/100/200 in the 15-minute time frame. BSE Sensex immediate resistance levels are R1 (82,031), R2 (82,506), and R3 (82,970), while immediate support levels are S1 (81,187), S2 (80,652), and S3 (80,211).
The BSE Sensex index had peaked at 81,846.42 and made a day’s low at 81,155.88. Finally, it had closed at 81,790.12 in green, gaining 582.95 points or 0.72%. The Relative Strength Index (RSI) stood at 54.64 (below the overbought zone of 70) in the daily time frame, and the BSE Sensex closed above all four EMAs of 20/50/100/200 in the daily time frame.
India VIX
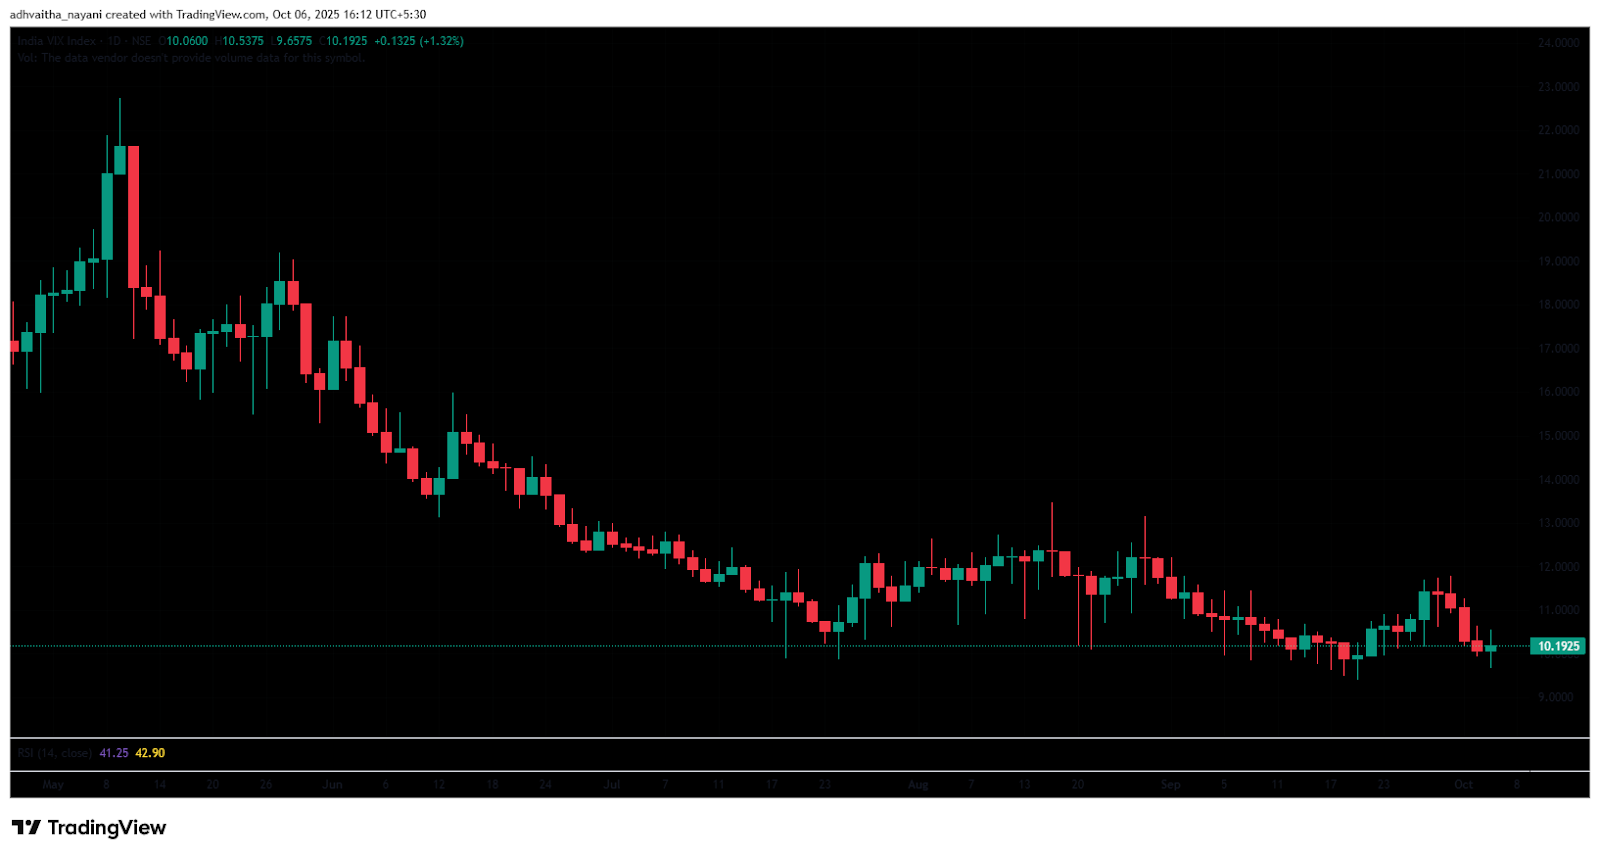
The India VIX increased by 0.13 points or 1.32%, from 10.06 to 10.19 during Monday’s session. An increase in the India VIX typically indicates higher price volatility in the stock market, suggesting a less stable market environment. However, a stable market environment and minimal volatility are anticipated when the India vix is below 15.
Market Recap on the 6th of October 2025
On Monday, the Nifty 50 opened on a mildly positive note at 24,916.55, up 22.3 points from its previous close of 24,894.25. It reached an intraday high of 25,095.95 before settling just below the 25,100 mark at 25,077.65, gaining 183.4 points, or 0.74%. Technically, the index remained above its 20, 50, 100, and 200-day EMAs on the daily chart, indicating continued bullish momentum. The BSE Sensex mirrored this trend, opening at 81,274.79, 67.62 points higher than its previous close of 81,207.17. It followed a similar trajectory to the Nifty and ended the session at 81,790.12, marking a rise of 582.95 points, or 0.72%.
Momentum indicators showed moderate strength, with the RSI at 55.26 for the Nifty 50 and 54.64 for the Sensex, both well below the overbought threshold of 70 and nearing oversold territory. Banking stocks also contributed to the broader market gains. The Bank Nifty Index advanced 515.6 points, or 0.93%, closing at 56,104.85. Monday marked the third straight session of gains for Indian benchmark indices, supported by strength in financial stocks and encouraging Q2 business updates.
Among sectoral performers, the Nifty IT Index led the pack, surging 772.8 points, or 2.3%, to close at 34,722.55. Key contributors included Coforge Ltd, LTI Mindtree Ltd, TCS Ltd, and Tech Mahindra, which gained up to 3.1%. The Nifty Capital Markets Index was the second-best performer, climbing 86.75 points, or 2%, to end at 4,333.
BSE Ltd led the rally with a 6% rise, followed by gains of up to 2.9% in Angel One Ltd, Motilal Oswal Ltd, and Nuvama Wealth Management Ltd. The Nifty India Digital Index also posted a strong performance, rising 178.6 points, or 2%, to settle at 8,996.25.
On the downside, the Nifty Media Index was the top laggard, slipping 14.50 points, or 0.90%, to close at 1,590.4. Losses were led by Tips Music Ltd, which declined 1.78%, while PVR Inox Ltd, Saregama India, and D B Corp Ltd fell by up to 1.55%.
The Nifty Metal Index also closed lower, down 91.60 points, or 0.89%, at 10,185.5, with stocks like Jindal Stainless Ltd, Jindal Steel Ltd, Tata Steel Ltd, and National Aluminium Company Ltd dropping as much as 3.46%. The Nifty CPSE Index ended in the red as well, down 17.55 points, or 0.27%, at 6,532.5.
In the broader Asian market, performance remained mixed. Japan’s Nikkei 225 Index soared 2,235.50 points, or 4.66%, to finish at 48,005, buoyed by optimism after the ruling party chose Takaichi as its new leader. Meanwhile, Hong Kong’s Hang Seng Index slipped 180.92 points, or 0.67%, to close at 26,960. Markets in China and South Korea remained shut for the day. As of 4:32 p.m. IST, U.S. Dow Jones Futures were trading at 46,882.25, up 123.97 points, or 0.27%.
Trade Setup Summary
The Nifty 50 opened on a positive note at 24,916.55 on Monday and ended the session in the green above the 25,050 level at 25,077.65. A break below 25,000 could trigger further selling towards 24,879 while breaking the next resistance level of 25,108 could trigger bullishness towards the 25,223 level.
Bank Nifty started the session on a positive note at 55,834.70 and ended the session in the green at 56,104.85, above the 56,100 level. A break below 55,750 could trigger further selling towards 55,429, while breaking the next resistance level of 56,148 could trigger bullishness towards the 56,412 level.
Sensex also opened on a positive note at 81,274.79 and ended the session in the green at 81,790.12, above the 81,700 level. A break below 81,187 could trigger further selling towards 80,652, while breaking the next resistance level of 82,031 could lead towards the 82,506 level.
Given the ongoing volatility and mixed sentiments, it’s advisable to avoid aggressive positions and wait for clear directional moves above resistance or below support. Traders should consider these key support and resistance levels when entering long or short positions following the price break from these critical levels. Additionally, traders can combine moving averages to identify more accurate entry and exit points.
Disclaimer

The views and investment tips expressed by investment experts/broking houses/rating agencies on tradebrains.in are their own, and not that of the website or its management. Investing in equities poses a risk of financial losses. Investors must therefore exercise due caution while investing or trading in stocks. Trade Brains Technologies Private Limited or the author are not liable for any losses caused as a result of the decision based on this article. Please consult your investment advisor before investing.
About: Trade Brains Portal is a stock analysis platform. Its trade name is Dailyraven Technologies Private Limited, and its SEBI-registered research analyst registration number is INH000015729.
Investments in securities are subject to market risks. Read all the related documents carefully before investing.
Registration granted by SEBI and certification from NISM in no way guarantee performance of the intermediary or provide any assurance of returns to investors.
