Indian equity markets started the week on a flat note on Monday, with both the Nifty 50 and BSE Sensex showing minimal movement by the close. Despite the lack of strong momentum, the indices managed to stay above key technical levels, signalling underlying strength.
The India VIX index edged up slightly, reflecting investor caution ahead of anticipated developments in India–US trade relations. Sector-wise, performance was mixed. FMCG and multinational company stocks saw notable gains, driven by strong performances from key players in consumer goods and industrial segments. Oil and gas stocks also contributed positively.
However, the media sector weighed on the broader market, ending in the red due to weakness in major entertainment and broadcasting stock. Globally, Asian markets were also mixed, with some indices posting mild gains while others faced declines. US futures hinted at slight bearishness, adding to the cautious tone across global markets.
In this overview, we will analyse the key technical levels and trend directions for Nifty and BSE Sensex to monitor in the upcoming trading sessions. All the charts mentioned below are based on the 5-minute timeframe.
Nifty 50
(In this analysis, we have used 20/50/100/200 EMAs, where 20 EMA (Red), 50 EMA (Orange), 100 EMA (Light Blue), and 200 EMA (Dark Blue)).
To view other technical reports, click here
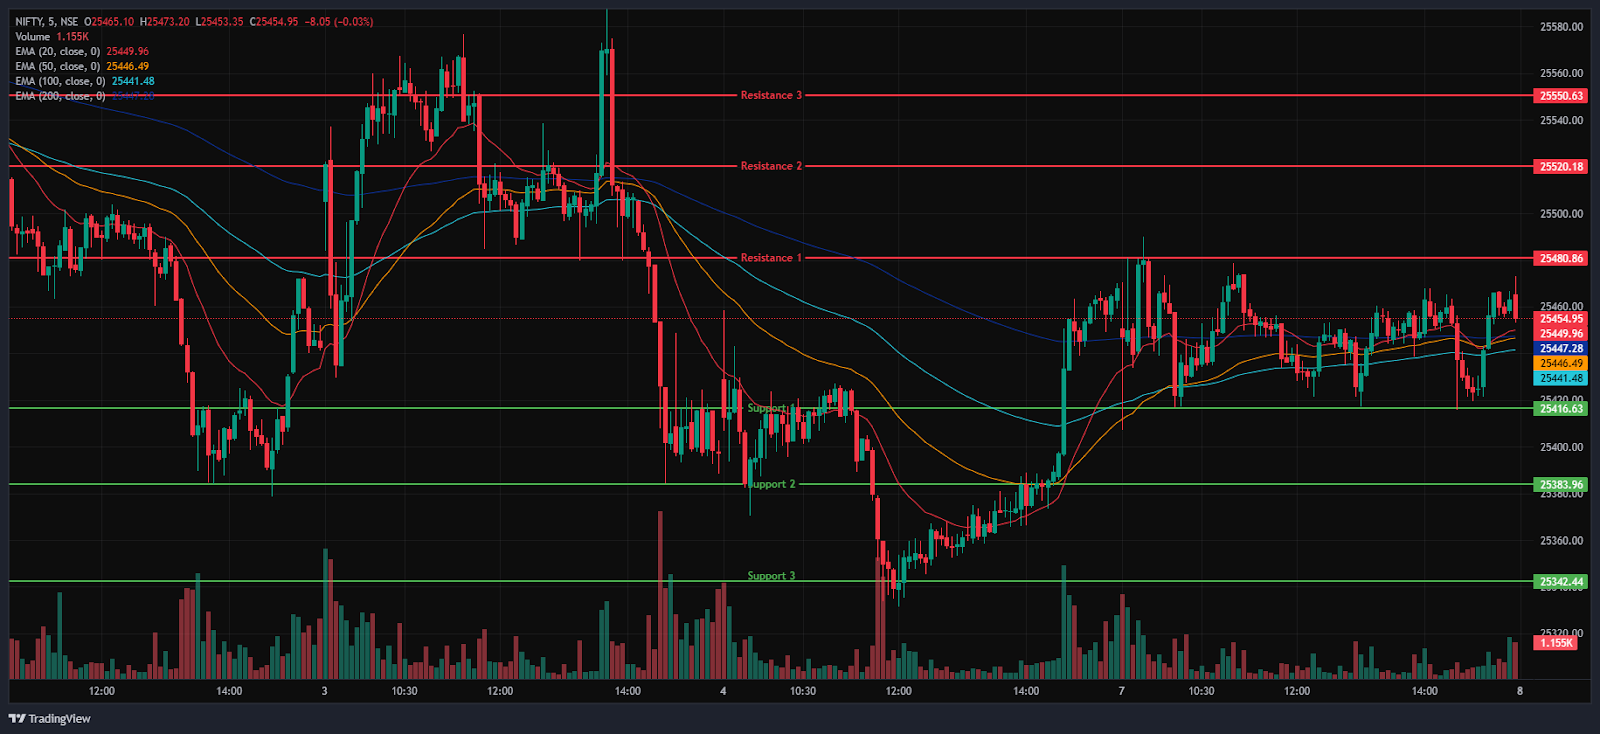
The Nifty 50 Index opened in red at 25,450.45 on Monday, down 11.45 points from Friday’s closing of 25,461. The Nifty Index was volatile in the morning session and was trading in the range of 25,425 and 25,469. It was consolidating around the opening level of 25,450 and was above the 20/50/200 EMAs in the 15-minute time frame in the morning session and traded below the 100-day EMA. In the afternoon session, the Nifty Index was volatile and slightly picked up the momentum and rebounded from its day’s low of 25,407.25 and closed in green at 25,461.30. During the afternoon session, it closed above all four EMAs (20/50/100/200 EMAs) in the 15-minute time frame in the afternoon session.
Nifty’s immediate resistance levels are R1 (25,481), R2 (25,520), and R3 (25,551), while immediate support levels are S1 (25,417), S2 (25,384), and S3 (25,342). The Nifty index had reached a day’s high at 25,489.80, closed in green above the 25,450 level, and saw a day’s low at 25,407.25. Finally, it had closed above the opening level at 25,461.30, gaining 0.3 points. The Relative Strength Index (RSI) stood at 61.02 (below the overbought zone of 70) in the daily time frame, and Nifty 50 closed above the four 20/50/100/200 EMAs in the daily time frame.
Bank Nifty
(In this analysis, we have used 20/50/100/200 EMAs, where 20 EMA (Red), 50 EMA (Orange), 100 EMA (Light Blue), and 200 EMA (Dark Blue)).
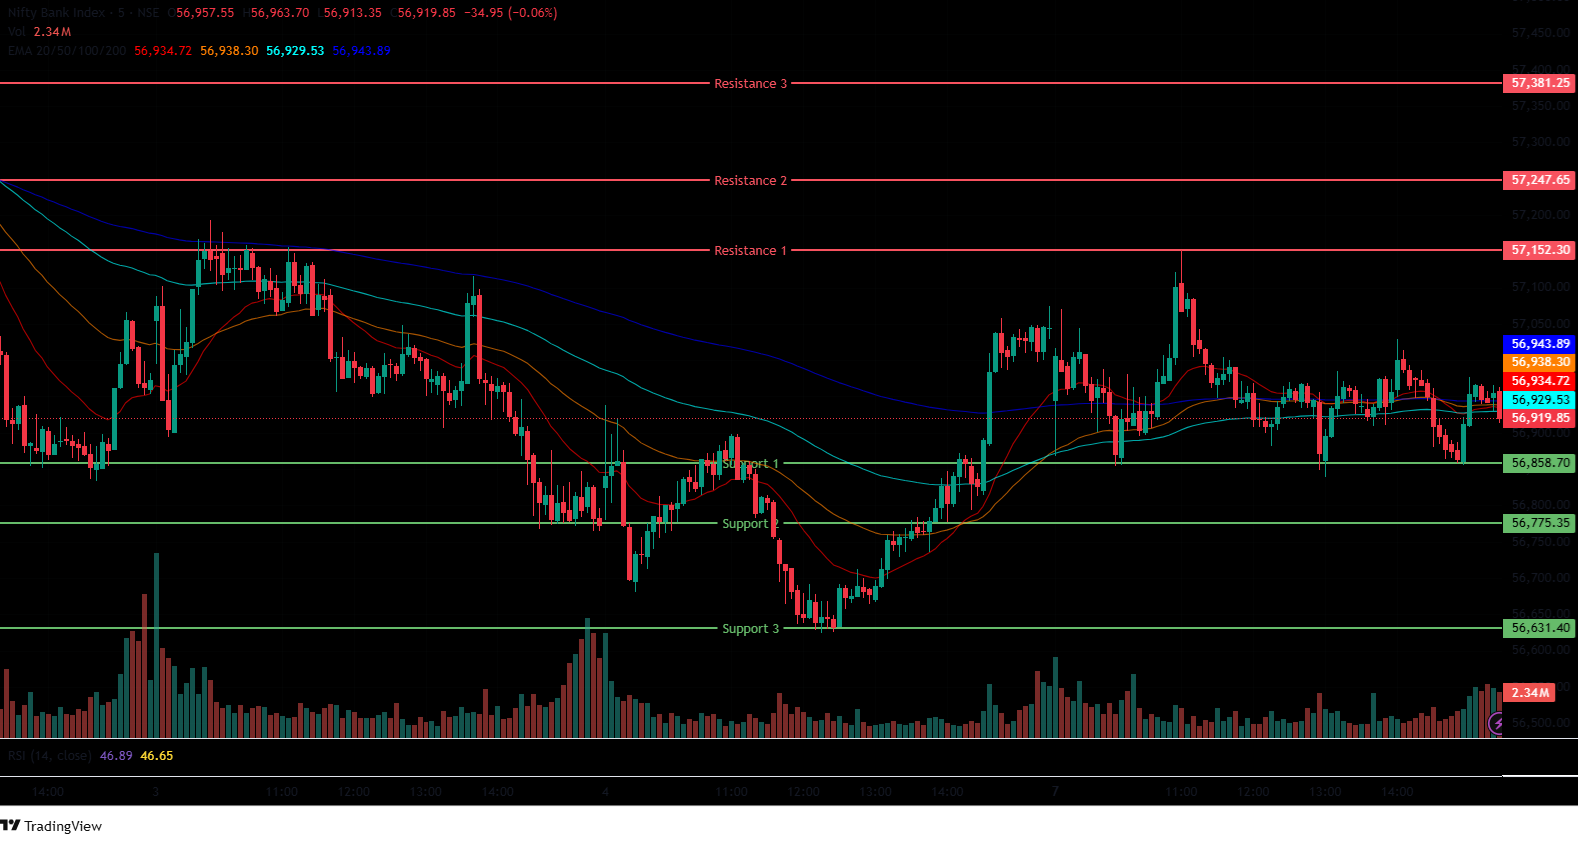
The Bank Nifty Index also followed a similar trend as the Nifty 50, opening at 56,938.70 on Monday, down by 93 points from Friday’s closing of 57,031.90. It was trading between the range of 56,900 and 56,990 levels in the morning session, indicating volatility, and was above the 20/50/200 EMAs in the 15-minute time frame but below the 100 EMA. In the afternoon session, the Bank Nifty continued to slide down and made its day’s low of 56,838.55 and closed below the 57,000 mark, around 56,949.20. During afternoon session, it closed below all three EMAs of 20/50/100 but closed above the 200 EMAs in the 15-minute time frame in the afternoon session.
Bank Nifty immediate resistance levels are R1 (57,152), R2 (57,248), and R3 (57,381), while immediate support levels are S1 (56,859), S2 (56,775), and S3 (56,631). The Bank Nifty index had peaked at 57,152.20 and had a day’s low at 56,838.55. Finally, it had closed below its day’s high in red at 56,949.20, losing by 82.7 points or 0.15%. The Relative Strength Index (RSI) stood at 57.93 (below the overbought zone of 70) in the daily time frame, and Bank Nifty was above the four 20/50/100/200 EMAs in the daily time frame.
Sensex
(In this analysis, we have used 20/50/100/200 EMAs, where 20 EMA (Red), 50 EMA (Orange), 100 EMA (Light Blue), and 200 EMA (Dark Blue)).
To view other technical reports, click here
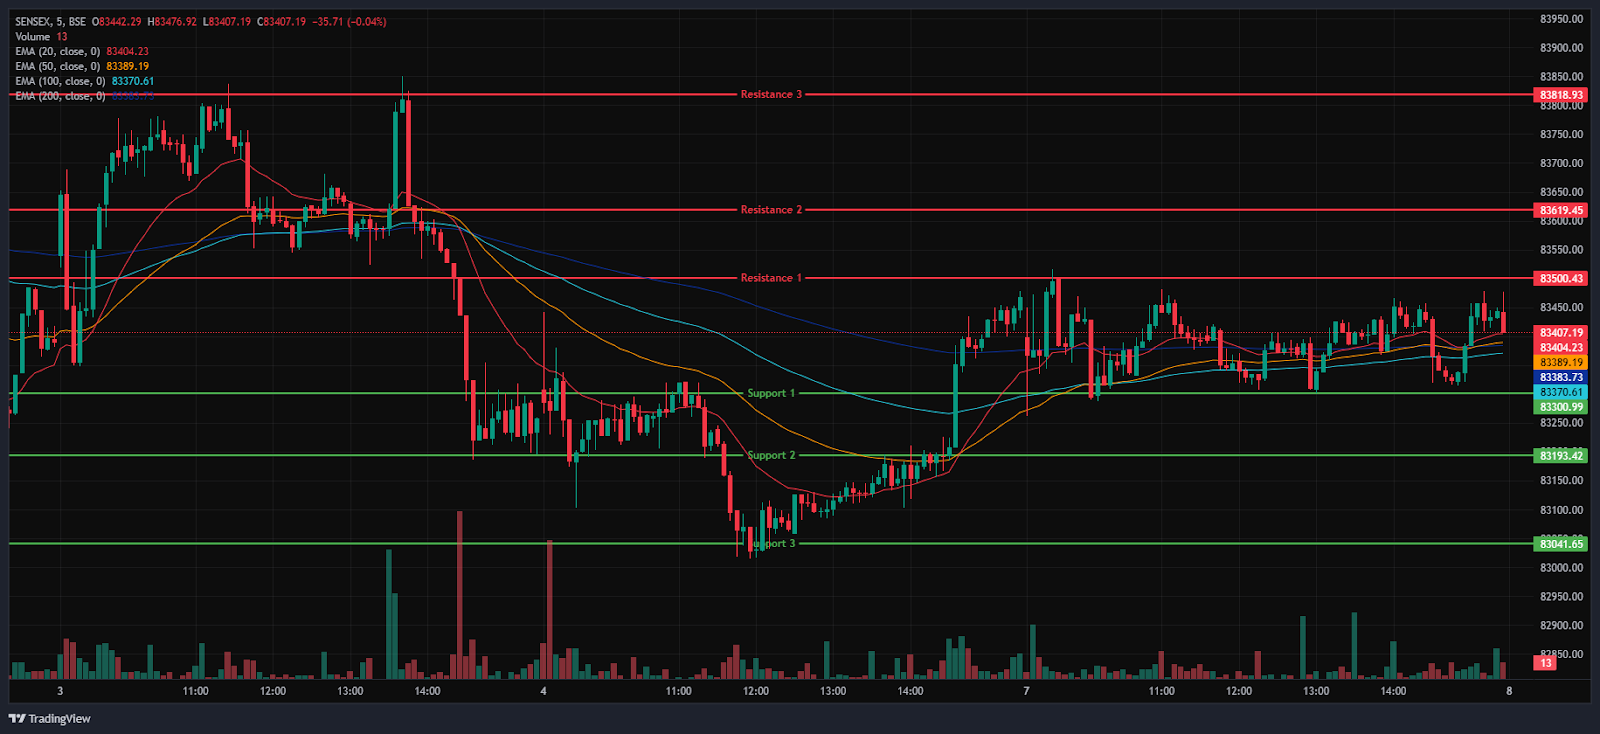
The BSE Sensex Index followed the same trend, opening at 83,398.08 on Monday, down by 34.81 points from Friday’s closing of 83,432.89. The Index was volatile in the morning session and was trading in the range of 83,305 and 83,404. It was consolidating near the opening level of 83,398 and was trading above the 20/50/200 EMAs in the 15-minute time frame in the morning session but traded below the 100-day EMA. In the afternoon session, the Sensex Index gradually picked up the momentum and bounced back from its day’s low of 83,262.23 and closed in green at 83,442.50. During noon, it traded above all three EMAs of 20/50/200 but closed below the 100 EMAs in the 15-minute time frame in the afternoon session.
BSE Sensex immediate resistance levels are R1 (83,500), R2 (83,619), and R3 (83,819), while immediate support levels are S1 (83,301), S2 (83,193), and S3 (83,042). The BSE Sensex index had peaked at 83,516.82 and had a day’s low at 83,262.23. Finally, it closed at 83,442.50, up by 9.61 points. The Relative Strength Index (RSI) stood at 59.92 (below the overbought zone of 70) in the daily time frame, and BSE Sensex was above all four 20/50/100/200 EMAs in the daily time frame.
India VIX
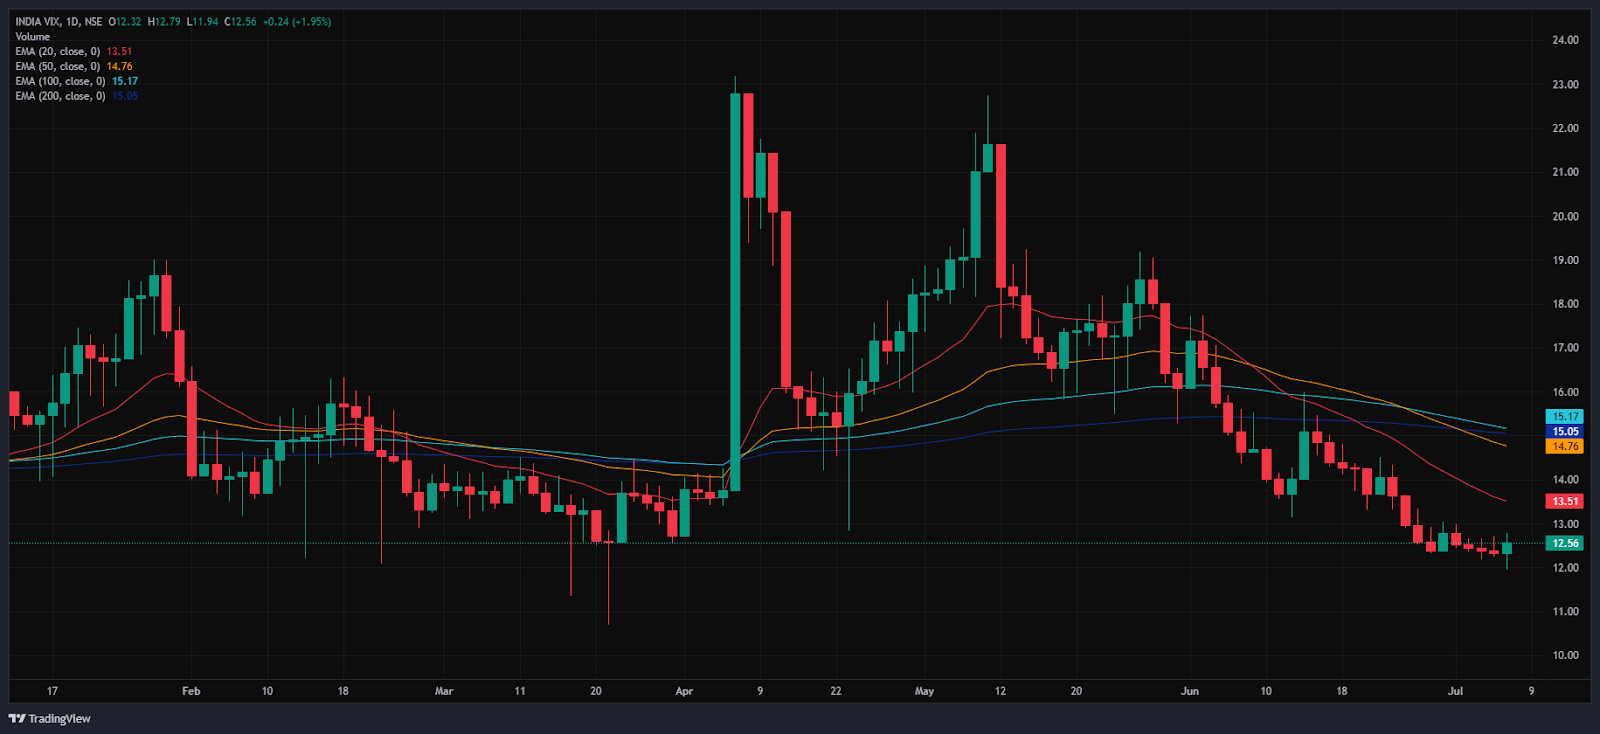
The India VIX increased from 12.32 to 12.56 on Monday, up by 0.25 points or 2%. The slight increase in the VIX index shows investor fear or uncertainty.
Market Recap 7th July 2025
The Nifty opened Monday’s trading session at 25,450.45, rose to a day-high of 25,489.8, and closed at 25,461.00. At the end of the day, the Nifty 50 was flat with +0.30 points up, or 0.00%. The BSE Sensex followed the same trend by closing flat with +9.61 points up, or 0.01%. The index opened at 83,398.08, peaked at 83,516.82, and closed at 83,442.5. With the Nifty 50 RSI at 61.02 on Monday, the Nifty ended above all 20/50/100/200 EMAs. Additionally, the BSE Sensex RSI closed at 59.92, well below the overbought level of 70, and the Sensex closed above all 20/50/100/200 EMAs. Additionally, the India VIX increased on Monday by 0.245 points or 1.99%, to 12.56 from 12.32, indicating an increase in market volatility ahead of India-US trade deals.
The sectoral indices showed mixed signals. The Nifty FMCG index, which finished the day at 55,652.85, up 917.25 points, or 1.68%, was one of the largest gainers. Godrej Consumer Products, Dabur India, Hindustan Unilever, and Emami were among the index’s top gainers, as they increased by up to 6% on Monday. Among the top gainers was the Nifty MNC index, which closed the day at 29,045.6 after rising 0.49%, with Hindustan Unilever, Cummins India, and Britannia Industries having a gain of over 3%. The Nifty Oil & Gas Index followed next, closing at 12,051.85, gaining 49.5 points, or 0.41%, with Petronet LNG Ltd, Indian Oil Corporation, and BPCL increasing by up to 2.6%.
Meanwhile, a few indices ended in red on Monday. The Nifty Media index ended the day at 1,743.5, down -18.2 points, or -1.03%. Nazara Technologies Ltd, Sun TV Network Ltd, and Zed Entertainment dragged the sector with a fall exceeding 3%.
Asian markets experienced a mixed trend on Monday. The Hong Kong Hang Seng index declined -0.12%, or -28.23 points, to close at 23,887.8, while the South Korean Kospi index slightly gained by 0.17%, or 5.19 points, to close at 3,059.47. Japan’s Nikkei 225 ended the day with losses, down by -223.2 points, or -0.56%, at 39,587.68. The Shanghai index ended the day flat at 3,473.13, up by 0.81 points, or 0.02%. On Monday, the US Dow Jones Futures closed at 44,795.79, down -34.73 points, or -0.08%, as of 4:30 PM.
Trade Setup Summary
The Nifty 50 opened in red on Monday but was volatile in the morning session, but rebounded later in the afternoon session, and closed on a positive note at 25,461.30, peaking at 25,489.80. A break below 25,417 could trigger further selling towards 25,384, while a break above 25,481 could trigger bullishness towards 25,520.
Bank Nifty opened on a similar trend, opening in red and ending at 56,949.20, below the 57,000 mark. A break below 56,859 could trigger further selling towards 56,775, while a break above 57,152 could trigger bullishness towards 57,248. Sensex opened on a similar trend, opening on a negative note, and ended above the 83,400 level at 83,442.50. A break below 83,301 could trigger further selling towards 83,193, while breaking the next resistance level of 83,500 could lead towards the 83,619 level.
Given the ongoing volatility and mixed sentiments, it’s advisable to avoid aggressive positions and wait for clear directional moves above resistance or below support. Traders should consider these key support and resistance levels when entering long or short positions following the price break from these critical levels. Additionally, traders can combine moving averages to identify more accurate entry and exit points.
Disclaimer

The views and investment tips expressed by investment experts/broking houses/rating agencies on tradebrains.in are their own, and not that of the website or its management. Investing in equities poses a risk of financial losses. Investors must therefore exercise due caution while investing or trading in stocks. Trade Brains Technologies Private Limited or the author are not liable for any losses caused as a result of the decision based on this article. Please consult your investment advisor before investing.
About: Trade Brains Portal is a stock analysis platform. Its trade name is Dailyraven Technologies Private Limited, and its SEBI-registered research analyst registration number is INH000015729.
Investments in securities are subject to market risks. Read all the related documents carefully before investing.
Registration granted by SEBI and certification from NISM in no way guarantee performance of the intermediary or provide any assurance of returns to investors.
