

The markets exhibited a mildly optimistic tone on Tuesday, maintaining their upward trajectory for the fourth straight session. Investor sentiment was buoyed by continued strength in real estate and financial sectors, supported by encouraging Q2 business updates. Both the Nifty 50 and Sensex showed resilience, trading above key technical levels and reflecting broad-based buying interest.

The fact that major indices stayed above their short- and long-term moving averages suggested sustained bullish momentum, albeit in a consolidative range. Additionally, the moderate RSI levels indicated there is still room for further upside without entering overbought territory.

Sectorally, realty stocks emerged as the day’s clear outperformers, driven by renewed investor confidence and stock-specific momentum. Oil & gas and pharma sectors also added to the gains, supported by select buying in key companies. However, some caution crept into defensives like FMCG and media, which saw profit-booking after recent gains.
The decline in PSU banks also hinted at some rotation of funds within sectors. Overall, the tone of the market remained constructive with a tilt towards cyclical sectors, underpinned by positive cues from Asian peers and stable global indicators.
In this overview, we will analyse the key technical levels and trend directions for Nifty and BSE Sensex to monitor in the upcoming trading sessions. All the charts mentioned below are based on the 5-minute timeframe.
Nifty 50
(In this analysis, we have used 20/50/100/200 EMAs, where 20 EMA (Red), 50 EMA (Orange), 100 EMA (Light Blue), and 200 EMA (Dark Blue)).
To view other technical reports, click here
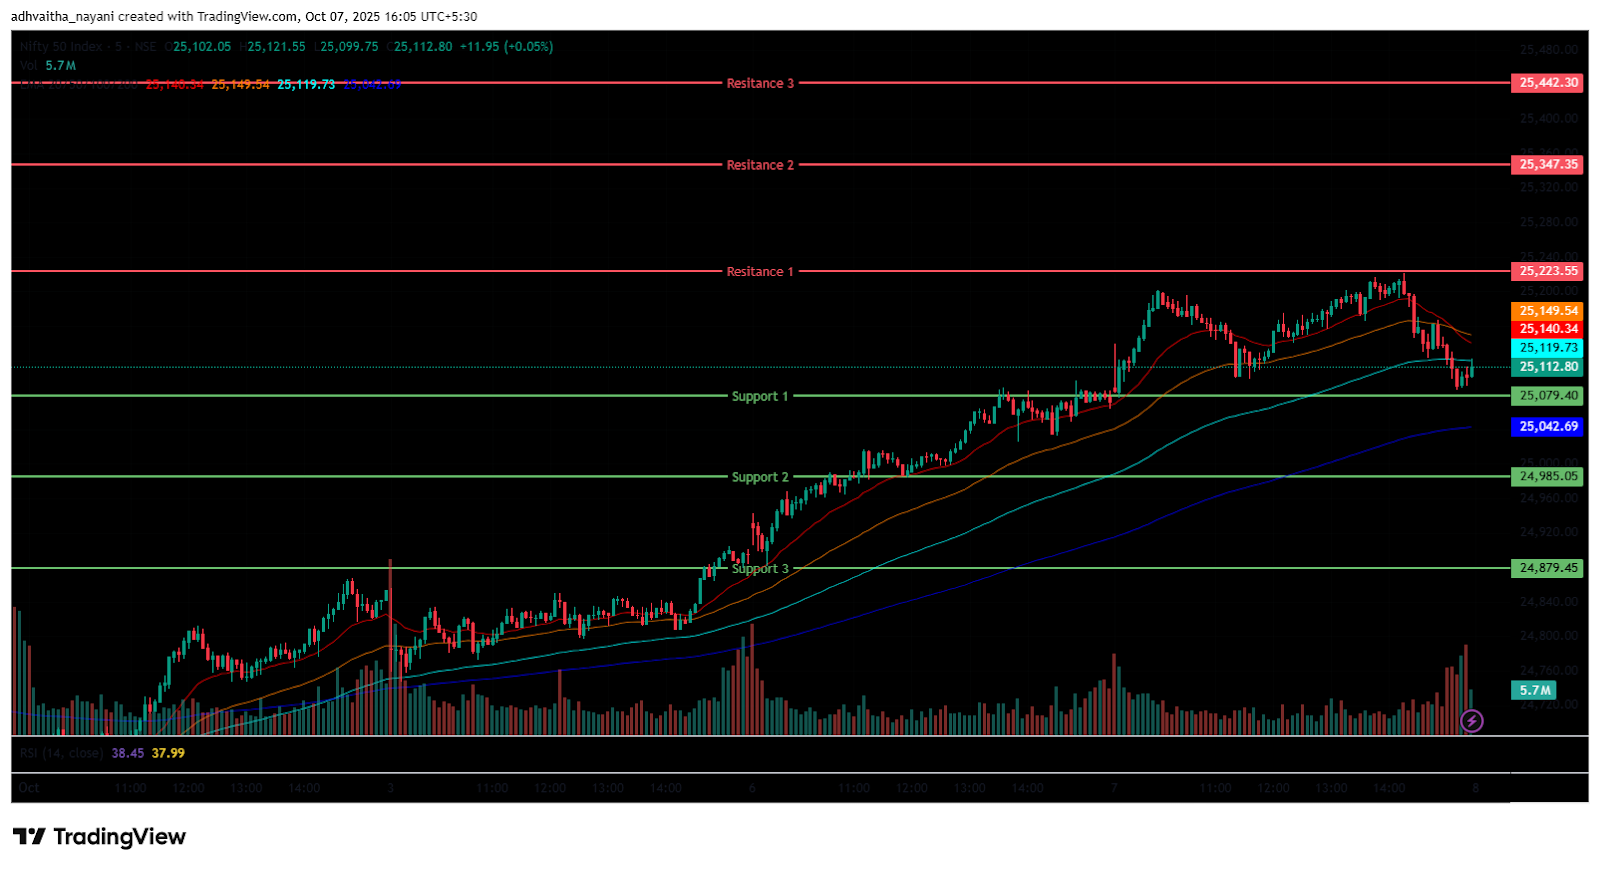
The Nifty 50 Index opened on a positive note at 25,085.30 on Tuesday, up by 7.65 points from Monday’s closing of 25,077.65. With a bullish start to the day, the index had a volatile morning session, trading in the 25,000 to 25,200 range. Additionally, the Index stood above all four EMAs of 20/50/100/200 in the 15-minute time frame during the morning session.
Further, the index surged as high as the 25,221 mark, the day’s high in the afternoon session, and was later dragged down from day high, was traded near its opening level, between the range of 25,050 and 25,250. During the afternoon session, the Nifty 50 traded above the EMAs of 50/100/200 but below the 20-period EMA in the 15-minute time frame. Nifty’s immediate resistance levels are R1 (25,223), R2 (25,347), and R3 (25,442), while immediate support levels are S1 (25,079), S2 (24,985), and S3 (24,879).
The Nifty index had reached a day’s high at 25,220.90 and saw a day’s low at 25,076.30. Finally, it had closed at 25,108.30, in green above the 25,100 level, gaining 30.65 points, or 0.12%. The Nifty 50 closed above all four EMAs of 20/50/100/200 in the daily time frame.
Momentum Indicators
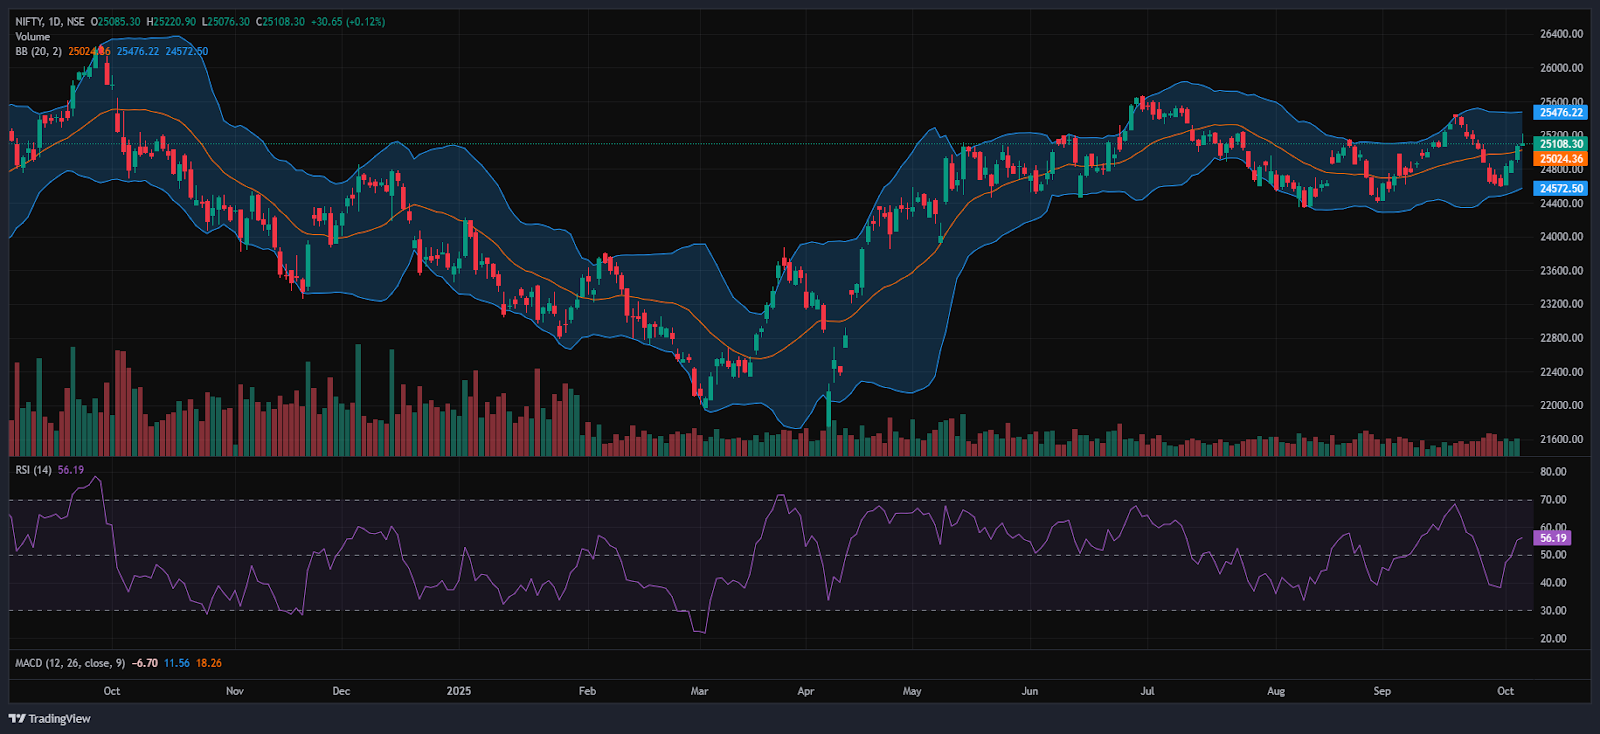
RSI (Daily): The Nifty 50’s RSI stood at 56.19, which is well below the overbought zone of 70, indicating a bullish sentiment.
Bollinger Bands (Daily): The index is trading in the upper band of its Bollinger Band range above the middle band (Simple Moving Average). Its position in the upper range indicates a bullish sentiment and on Tuesday the Nifty Index formed a shooting star Candle pattern in the uptrend, signalling a potential bearish reversal. A sustained move above the middle band signals a bullish sentiment, while a drop back toward the lower band may reinforce bearish sentiment.
Volume Analysis: Tuesday’s trading session had average volumes, which stood at 286.83 Mn.
Derivatives Data: Options OI indicates strong Put writing at 25,100, following 25,000, establishing it as a firm support zone. On the upside, a significant Call OI buildup at 25,150 and 25,200 suggests a potential resistance supply. PCR (Put/Call Ratio) stands at 1.0738 (>1), leaning towards balanced or neutral sentiment and the Short Covering signals a short bullish signal, with an overall neutral to Bullish outlook for the next trading session.
Bank Nifty
(In this analysis, we have used 20/50/100/200 EMAs, where 20 EMA (Red), 50 EMA (Orange), 100 EMA (Light Blue), and 200 EMA (Dark Blue)).
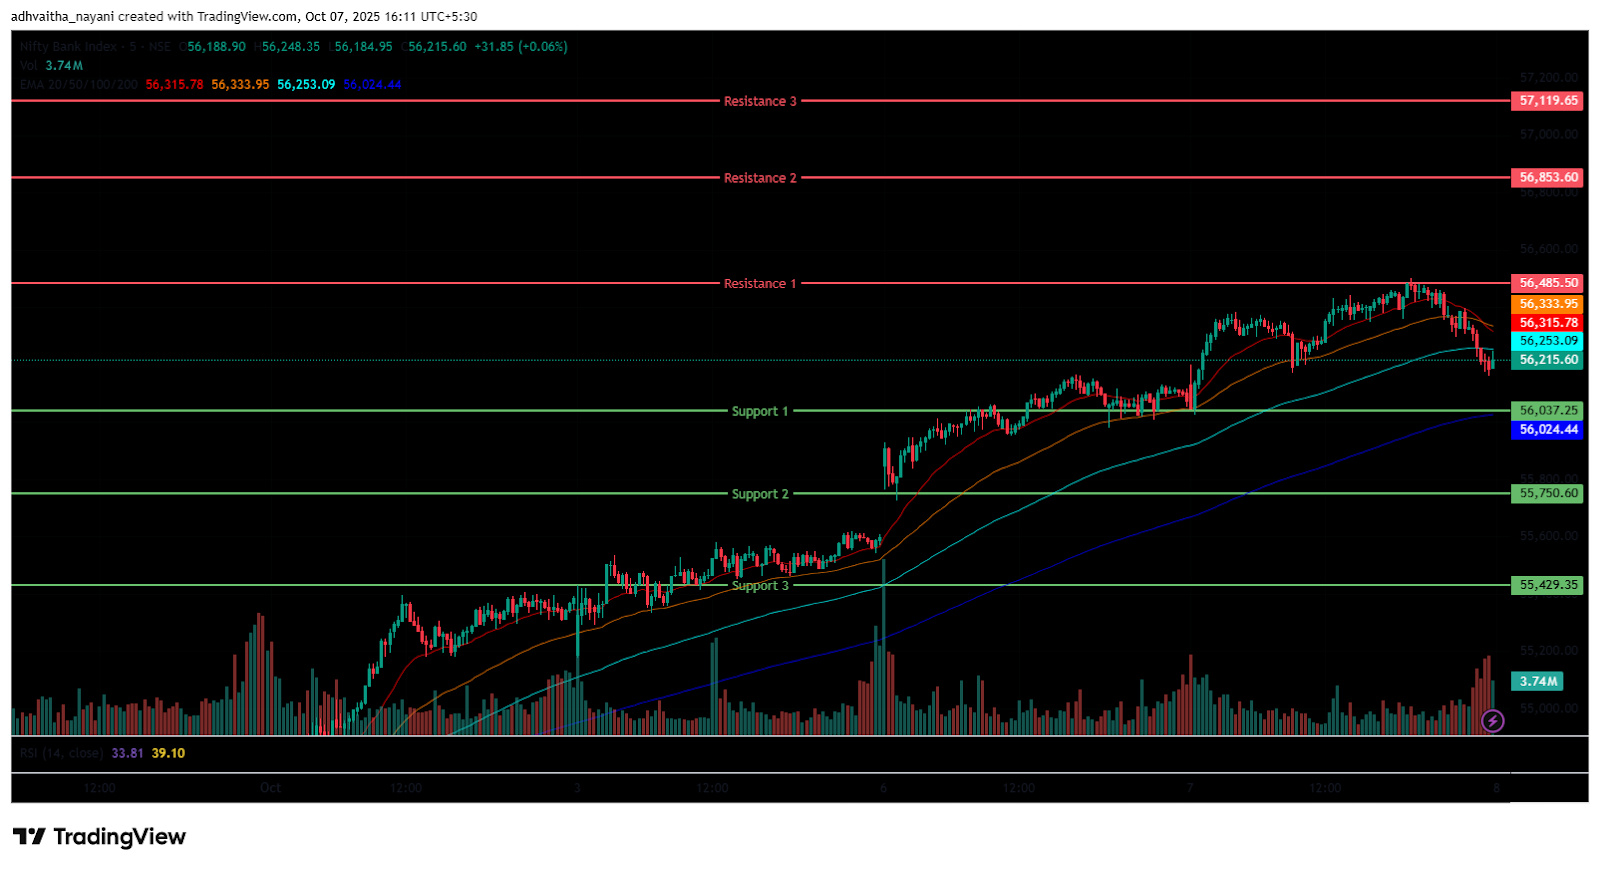
The Bank Nifty Index also started the session on a positive note at 56,126.40 on Tuesday, up by 21.55 points from Monday’s closing of 56,104.85. The index was trading between the range of 56,000 and 56,450 in the morning session, indicating stable volatility. In addition, the index was trading above all four EMAs of 20/50/100/200 in the 15-minute time frame. In the afternoon session, the Index made its day high at 56,502, and lost its momentum and dragged down to the 56,200 mark near to its opening level.
The Index was traded around the range of 56,150 and 56,500, ending in green. During the afternoon session, Bank Nifty closed above the EMAs of 50/100/200 but below the 20-period EMA in the 15-minute time frame. Bank Nifty immediate resistance levels are R1 (56,485), R2 (56,854), and R3 (57,120), while immediate support levels are S1 (56,037), S2 (55,751), and S3 (55,429).
The Bank Nifty index had peaked at 56,502.45 and made a day’s low at 56,025.05. Finally, it had closed in green at 56,239.35, closing above the 56,200 level, gaining 134.5 points or 0.24%. The Relative Strength Index (RSI) stood at 64.68 well below the overbought zone of 70 in the daily time frame, and Bank Nifty closed above all four EMAs of 20/50/100/200 in the daily time frame.
Sensex
(In this analysis, we have used 20/50/100/200 EMAs, where 20 EMA (Red), 50 EMA (Orange), 100 EMA (Light Blue), and 200 EMA (Dark Blue)).
To view other technical reports, click here
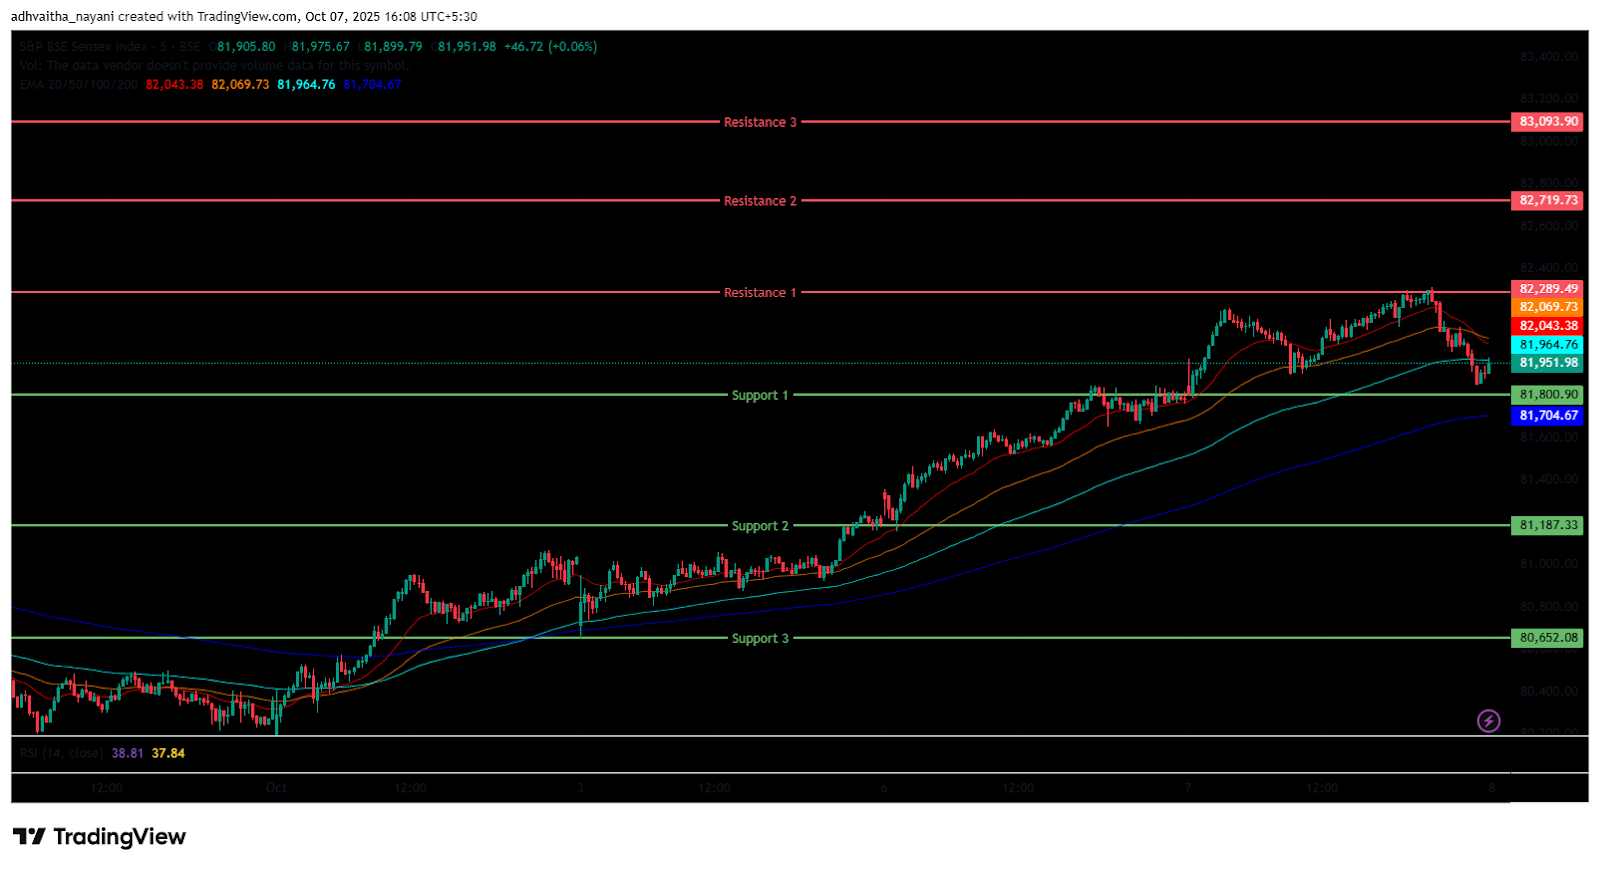
The BSE Sensex Index also opened on a positive note at 81,883.95 on Tuesday, up by 93.83 points from Monday’s closing of 81,790.12. The index started its session on a bullish note and was trading in the 81,750 to 82,250 range throughout the morning session’s 15-minute time frame, above all four EMAs of the 20/50/100/200. In the afternoon session, the Index further surged to the 82,310 level, marking its day high but did not sustain the level and dragged down to the 81,850 level near to its opening level.
The Index was traded between 81,850 and 82,350, maintaining its overall bullish trend and closing above the EMAs of 50/100/200 but below the 20-period EMA in the 15-minute time frame. BSE Sensex immediate resistance levels are R1 (82,289), R2 (82,720), and R3 (83,094), while immediate support levels are S1 (81,801), S2 (81,187), and S3 (80,652).
The BSE Sensex index had peaked at 82,309.56 and made a day’s low at 81,787.48. Finally, it had closed at 81,926.75 in green, gaining 136.63 points or 0.17%. The Relative Strength Index (RSI) stood at 55.9 (below the overbought zone of 70) in the daily time frame, and the BSE Sensex closed above all four EMAs of 20/50/100/200 in the daily time frame.
India VIX
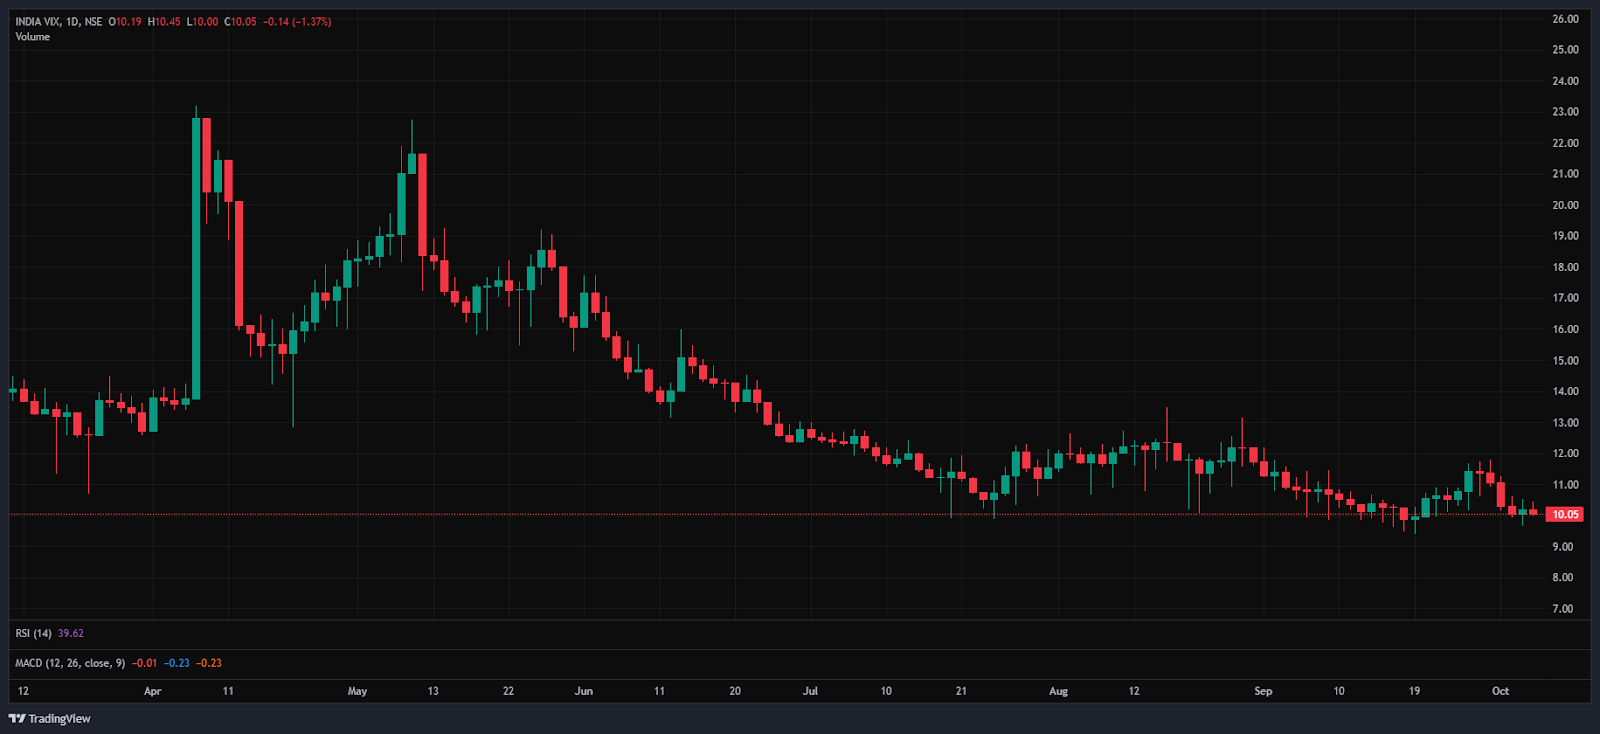
The India VIX decreased by 0.14 points or 1.40%, from 10.19 to 10.05 during Tuesday’s session. A decrease in the India VIX typically indicates lower price volatility in the stock market, suggesting a more stable market environment. However, a stable market environment and minimal volatility are anticipated when the India vix is below 15.
Market Recap on the 7th of October 2025
On Tuesday, the Nifty 50 opened marginally higher at 25,085.30, up 7.65 points from its previous close of 25,077.65. The index hit an intraday high of 25,220.90 before closing near the 25,100 mark at 25,108.30, gaining 30.65 points or 0.12%. Technically, the index maintained a strong stance by staying above its 20/50/100/200-day EMAs on the daily chart. The BSE Sensex followed a similar path, opening at 81,883.95, up 93.83 points from the previous close of 81,790.12.
It ended the session higher by 136.63 points, or 0.17%, at 81,926.75. Momentum indicators reflected moderate strength, with the RSI for Nifty 50 at 56.19 and Sensex at 55.90, both comfortably below the overbought threshold of 70.
The Bank Nifty Index also closed on a positive note, advancing 134.50 points, or 0.24%, to end at 56,239.35. This marked the fourth straight session of gains for the broader markets, driven primarily by strong performances in realty and financial stocks, coupled with encouraging Q2 business updates.
Among sectoral performers, the Nifty Realty Index rose 9.60 points or 1.09%, to close at 891.70. Real estate majors like Anant Raj Ltd, Brigade Enterprises Ltd, Lodha Developers Ltd, and Phoenix Mills Ltd saw gains of up to 4.3%. Following closely, the Nifty Oil & Gas Index climbed 56.55 points or 0.49%, ending at 11,516.25. Indraprastha Gas Ltd surged 5.8%, while Petronet LNG Ltd, Mahanagar Gas Ltd, and GAIL (India) Ltd posted gains of up to 2.6%. The Nifty Pharma Index also posted a modest uptick, closing 95.45 points or 0.44%, higher at 21,875.30.
On the flip side, the Nifty FMCG Index was the top sectoral laggard, shedding 293.80 points or -0.53%, to finish at 54,763.85. Stocks like Britannia Industries Ltd, Tata Consumer Products Ltd, Emami Ltd, and Hindustan Unilever Ltd dropped by up to -2.06%.
The Nifty Media Index also declined, ending 7.30 points or -0.46%, lower at 1,583.10. Nazara Technologies Ltd led the fall with a -1.92% dip, while Tips Music Ltd, PVR Inox Ltd, and Hathway Cable & Datacom Ltd slipped by up to -1.84%. The Nifty PSU Bank Index dropped 31.40 points or -0.41%, closing at 7,583.75.
Asian markets largely reflected a positive tone on Tuesday. Japan’s Nikkei 225 added 69.24 points or 0.14%, finishing at 48,014, while Singapore’s Straits Times Index jumped 50.55 points or 1.13%, to close at 4,472.26. Markets in China, Hong Kong, and South Korea remained closed for the day. As of 5:08 p.m. IST, U.S. Dow Jones Futures were trading marginally higher at 46,699.23, up 4.26 points or 0.01%.
Trade Setup Summary
The Nifty 50 opened on a positive note at 25,085.30 on Tuesday and ended the session in the green above the 25,100 level at 25,108.30. A break below 25,079 could trigger further selling towards 24,985 while breaking the next resistance level of 25,223 could trigger bullishness towards the 25,347 level.
Bank Nifty started the session on a positive note at 56,126.40 and ended the session in the green at 56,239.35, above the 56,200 level. A break below 56,037 could trigger further selling towards 55,751, while breaking the next resistance level of 56,485 could trigger bullishness towards the 56,854 level.
Sensex also opened on a positive note at 81,883.95 and ended the session in the green at 81,926.75, above the 81,900 level. A break below 81,801 could trigger further selling towards 81,187, while breaking the next resistance level of 82,289 could lead towards the 82,720 level.
Given the ongoing volatility and mixed sentiments, it’s advisable to avoid aggressive positions and wait for clear directional moves above resistance or below support. Traders should consider these key support and resistance levels when entering long or short positions following the price break from these critical levels. Additionally, traders can combine moving averages to identify more accurate entry and exit points.
Disclaimer

The views and investment tips expressed by investment experts/broking houses/rating agencies on tradebrains.in are their own, and not that of the website or its management. Investing in equities poses a risk of financial losses. Investors must therefore exercise due caution while investing or trading in stocks. Trade Brains Technologies Private Limited or the author are not liable for any losses caused as a result of the decision based on this article. Please consult your investment advisor before investing.
About: Trade Brains Portal is a stock analysis platform. Its trade name is Dailyraven Technologies Private Limited, and its SEBI-registered research analyst registration number is INH000015729.
Investments in securities are subject to market risks. Read all the related documents carefully before investing.
Registration granted by SEBI and certification from NISM in no way guarantee performance of the intermediary or provide any assurance of returns to investors.
