
![]()
![]()
The market sentiment on Friday reflected cautious optimism, with benchmark indices opening strong but facing resistance near key technical levels. The Nifty 50 managed to hold onto marginal gains by the close, suggesting that while bullish momentum exists, it’s currently constrained by overhead technical resistance.

The index’s position just below its 50-day exponential moving average indicates traders are awaiting a clearer directional cue, especially with mixed performances across sectors. The Sensex mirrored volatility, opening on a positive note but slipping slightly by the end of the session, underlining the indecisiveness among investors amid broader economic optimism.

Sectoral movements painted a mixed picture. Auto, capital markets, and logistics showed resilience, likely buoyed by robust domestic demand and improving macro fundamentals. On the other hand, IT and FMCG stocks saw notable selling pressure, possibly due to valuation concerns or profit-booking after recent rallies. The muted movement in momentum indicators like the RSI for both Nifty and Sensex further confirms a wait-and-watch approach. Still, the overall weekly gains, strong GDP data and GST reforms suggest underlying confidence in India’s growth trajectory.
In this overview, we will analyse the key technical levels and trend directions for Nifty and BSE Sensex to monitor in the upcoming trading sessions. All the charts mentioned below are based on the 5-minute timeframe.
Nifty 50
(In this analysis, we have used 20/50/100/200 EMAs, where 20 EMA (Red), 50 EMA (Orange), 100 EMA (Light Blue), and 200 EMA (Dark Blue)).
To view other technical reports, click here
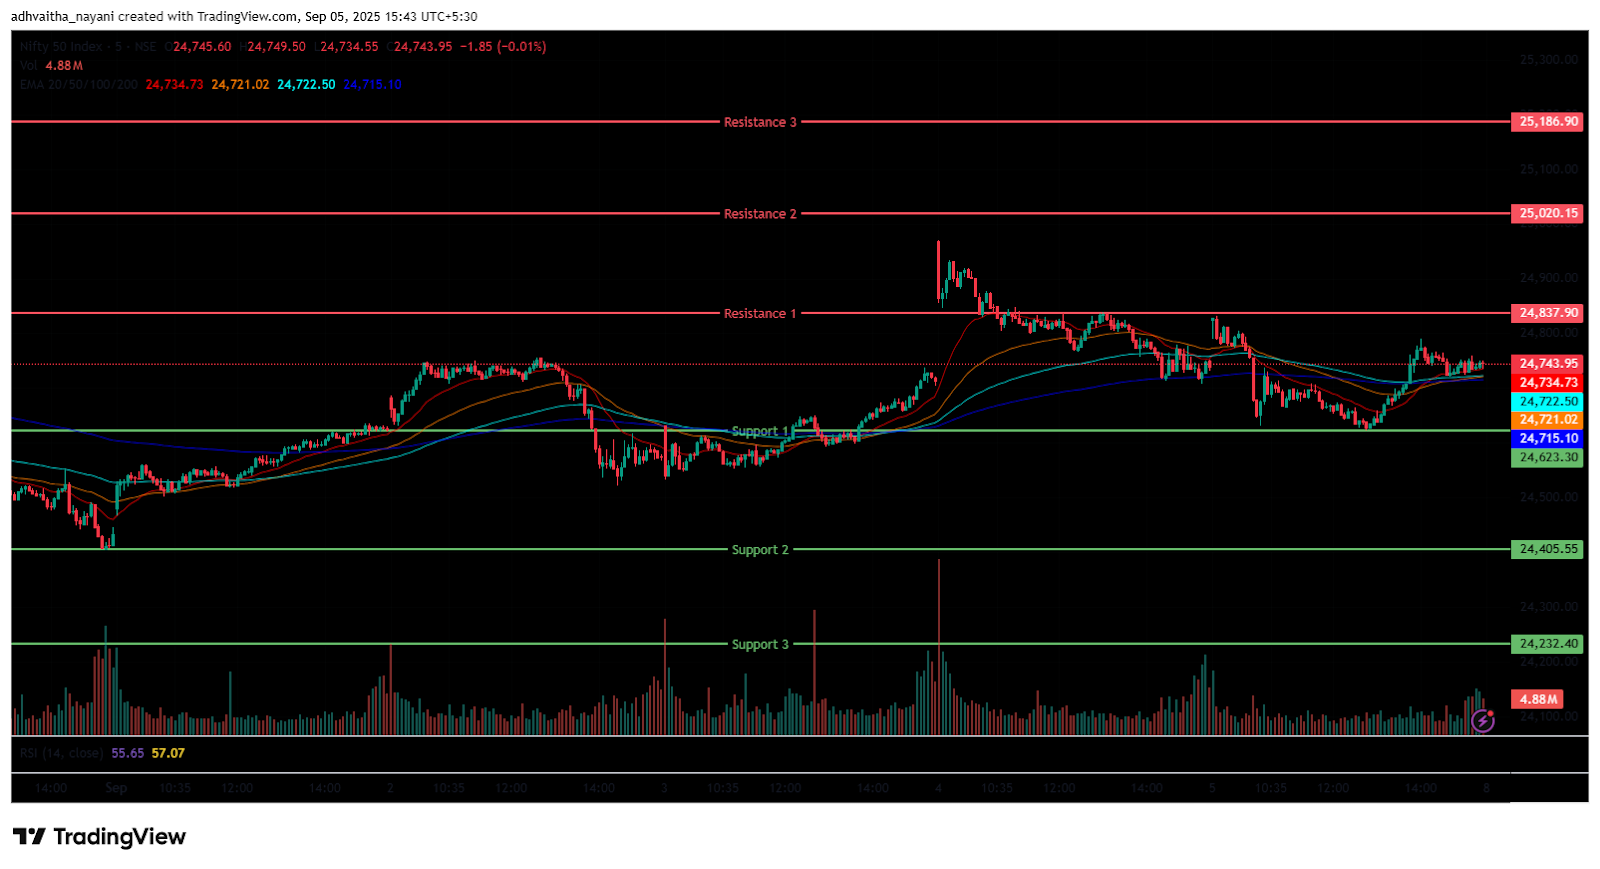
The Nifty 50 Index opened on a gap up at 24,818.85 on Friday, up by 84.55 points from Thursday’s closing of 24,734.30. Although it started the morning session on a positive note, the Nifty Index did not sustain the 24,800 mark and was later dragged down to 24,600, fluctuating between 24,600 and 24,800. In the morning session, the Index traded below its opening level at 24,638 and was traded at below all four EMAs of 20/50/100/200 in the 15-minute time frame.
Later, in the afternoon session, the index rebounded above the 24,700 level from the 24,600 level; the Nifty Index held above the 24,700 level, trading in green. Overall, the index ended in a mixed state on Friday session. During the afternoon session, the Nifty 50 was traded above all four EMAs of 20/50/100/200 in the 15-minute time frame. Nifty’s immediate resistance levels are R1 (24,838), R2 (25,020), and R3 (25,187), while immediate support levels are S1 (24,623), S2 (24,406), and S3 (24,232).
The Nifty index had reached a day’s high at 24,832.35 and saw a day’s low at 24,621.60. Finally, it had closed at 24,741.00, in green above the 24,700 level, gaining 6.7 points, or 0.027%. The Nifty 50 closed above the 20/100/200 EMAs but remained below the 50 EMAs in the daily time frame.
Momentum Indicators
RSI (Daily): The Nifty 50’s RSI stood at 49.31, which is well below the overbought zone of 70, but closer to the oversold zone of 30.
Bollinger Bands (Daily): The Nifty 50 is currently trading near its upper band and near to the middle band (Simple Moving Average). Its position in the upper range, along with solid support around the 24,700 level, suggests a mildly bullish sentiment. A sustained move above the middle band could signal a potential bullish shift, while a drop back toward the lower band may reinforce bearish sentiment.
Volume Analysis: Friday’s trading session average volumes stood at 210.07 Mn.
Derivatives Data: Options OI indicates strong Put writing at 24,700, following 24,600, establishing it as a firm support zone. On the upside, a significant Call OI buildup at 24,900 and 25,000 suggests a potential resistance supply. PCR (Put/Call Ratio) stands at 0.7678 (<1), leaning towards bullish sentiment and the long buildup signals a potential upward move.
Bank Nifty
(In this analysis, we have used 20/50/100/200 EMAs, where 20 EMA (Red), 50 EMA (Orange), 100 EMA (Light Blue), and 200 EMA (Dark Blue)).
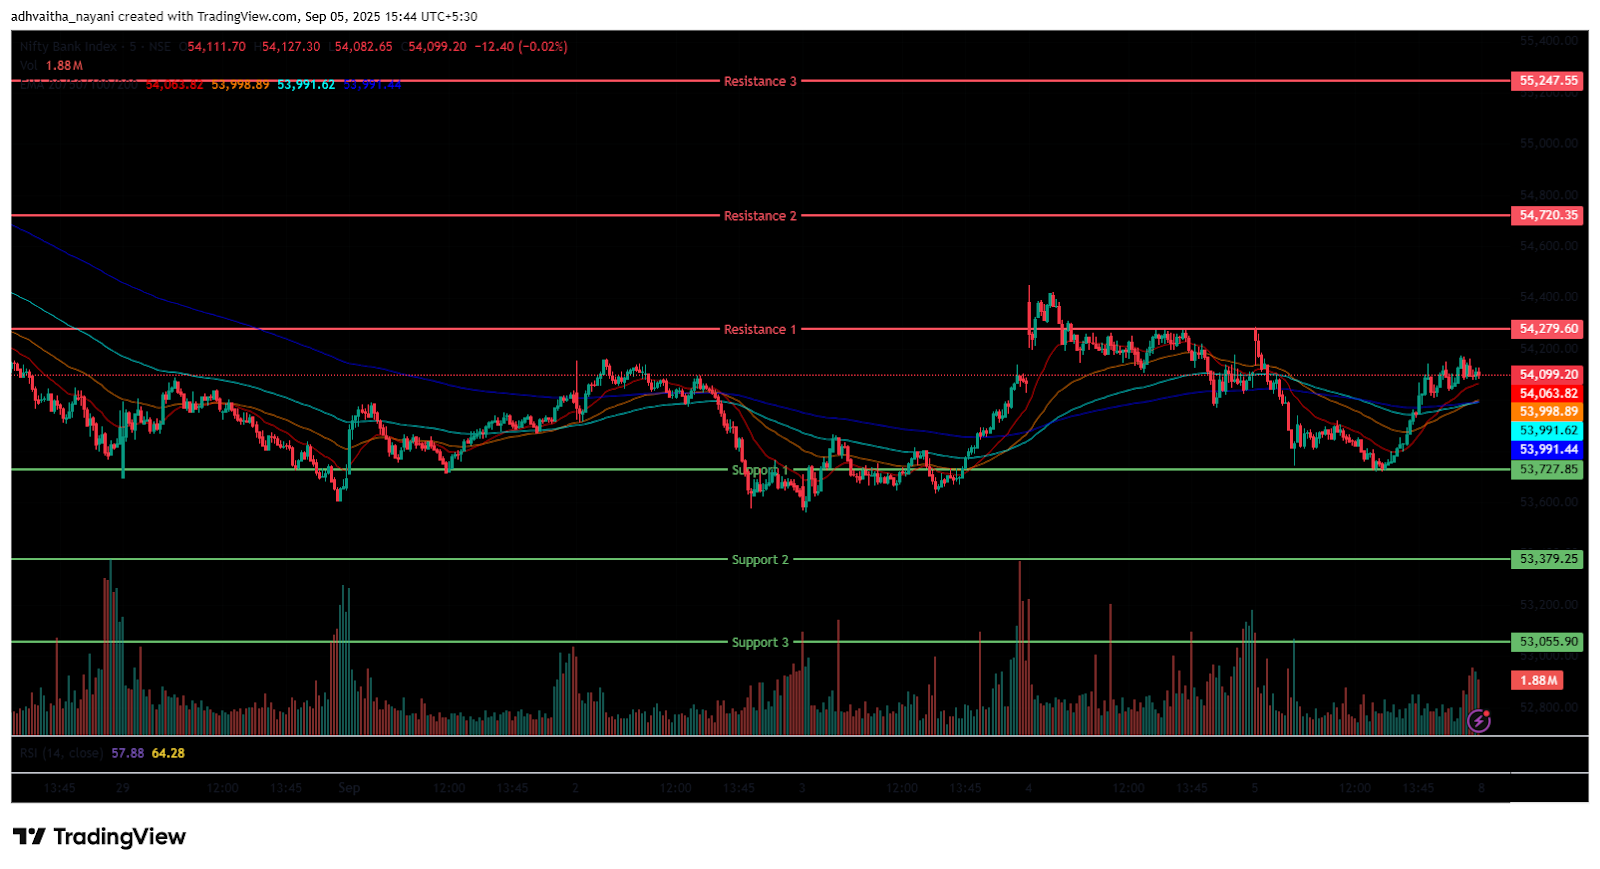
The Bank Nifty Index started the session on a gap up at 54,308.05 on Friday, up by 232.6 points from Thursday’s closing of 54,114.55. The index began on a bullish note and made its day’s high at the 54,300 mark. But later the Index did not sustain and was dragged down to the 53,700 mark and traded below its opening level at 53,751 in the morning session. The index was traded below all four EMAs of 20/50/100/200 in the 15-minute time frame and was trading between the 53,700 and 54,300 levels in the morning session.
The Bank Nifty index rebounded from its day’s low to above the 54,098 mark but held above the 54,000 mark during the afternoon session and traded in the green. During the afternoon session, Bank Nifty closed above the EMAs of 20/50/100 but remained below the 200 EMAs in the 15-minute time frame. Bank Nifty immediate resistance levels are R1 (54,280), R2 (54,720), and R3 (55,248), while immediate support levels are S1 (53,728), S2 (53,379), and S3 (53,056).
The Bank Nifty index had peaked at 54,308.05 and made a day’s low at 53,719.55. Finally, it had closed in green at 54,114.55, breaking above the 54,100 level, gaining 39.10 points or 0.072%. The Relative Strength Index (RSI) stood at 37.92 and was near the oversold zone in the daily time frame, and Bank Nifty closed below the EMAs of 20/50/100 but remained above the 200 EMA in the daily time frame.
Sensex
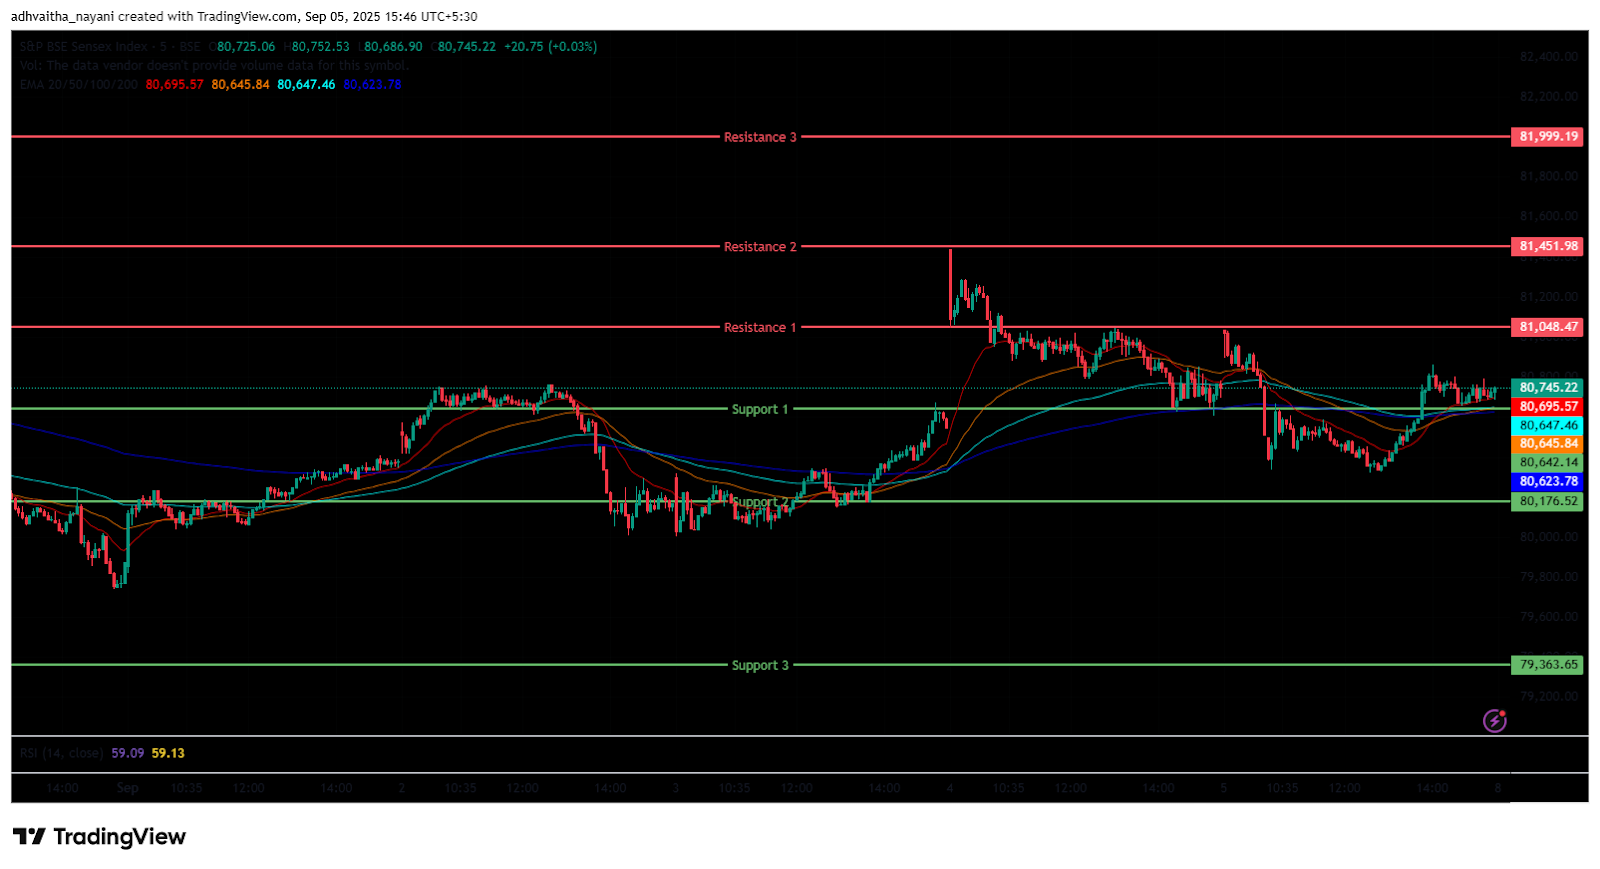
(In this analysis, we have used 20/50/100/200 EMAs, where 20 EMA (Red), 50 EMA (Orange), 100 EMA (Light Blue), and 200 EMA (Dark Blue)).
To view other technical reports, click here
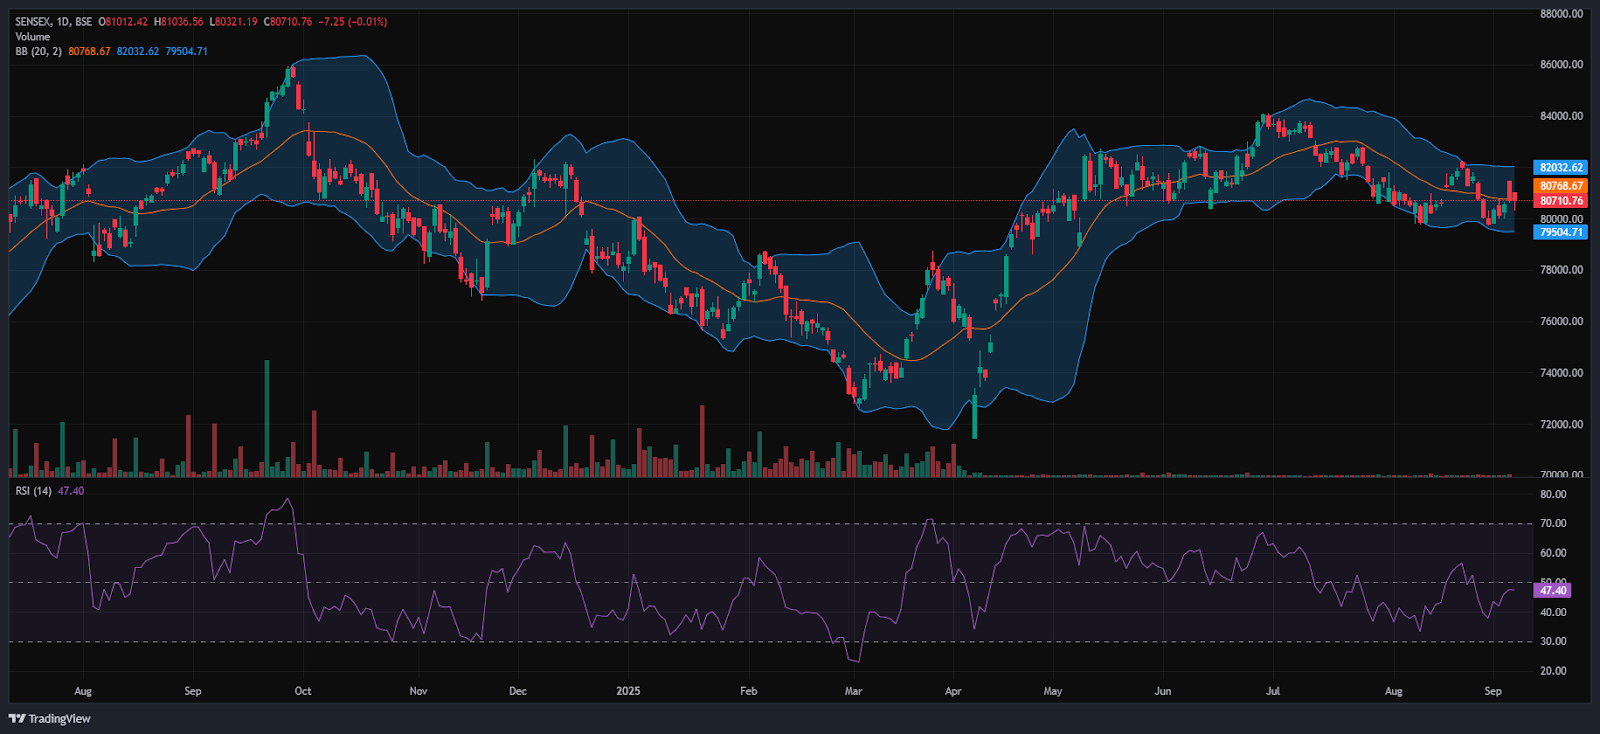
The BSE Sensex Index opened on a gap up at 81,012.42 on Friday, up by 294.41 points from Thursday’s closing of 80,718.01. The Index was more volatile in the morning session; the Index plunged to the 80,300 mark and was trading below its opening level in the morning session at 80,366. The Index was traded below all four EMAs of 20/50/100/200 in the 15-minute time frame and was trading between 80,300 and 81,000 in the morning session.
The Sensex Index further rebounded from its day low and held above the 80,700 mark in the afternoon session, maintaining its overall mixed trend, and was trading above all four EMAs of 20/50/100/200 in the 15-minute time frame. BSE Sensex immediate resistance levels are R1 (81,049), R2 (81,452), and R3 (81,999), while immediate support levels are S1 (80,695), S2 (80,176), and S3 (79,364).
The BSE Sensex index had peaked at 81,036.56 and made a day’s low at 80,321.19. Finally, it had closed at 80,710.76 in red, losing 7.25 points. The Relative Strength Index (RSI) stood at 47.40 (below the overbought zone of 70 but nearing the oversold zone in the daily time frame), and the BSE Sensex closed below the EMAs of 20/50/100 but remained above the 200 EMA in the daily time frame.
India VIX
The India VIX decreased by 0.073 points or 0.67%, from 10.85 to 10.78 during Friday’s session. A decrease in the India VIX typically indicates lower expected volatility in the stock market, suggesting a calmer and more stable market environment.
Market Recap on the 5th of September 2025
On Friday, the Nifty 50 opened on a strong note at 24,818.85, rising 84.55 points from its previous close of 24,734.3. It touched an intraday high of 24,832.35 before settling at 24,741, posting a modest gain of 6.7 points or 0.027%. The index remained just below its 50-day EMA but held above the 20-, 100-, and 200-day EMAs on the daily chart.
The BSE Sensex followed a similar path, opening higher at 81,012.42, up 294.41 points from its previous close, but ending slightly lower at 80,710.76, down by 7.25 points. In terms of momentum indicators, the Relative Strength Index (RSI) for the Nifty 50 stood at 49.31, while the Sensex RSI was at 47.4, both staying comfortably below the overbought threshold of 70. The Bank Nifty Index also closed in the green, gaining 39.1 points or 0.07%, to end the day at 54,114.55.
Among sectoral indices, the Nifty Auto Index led the gains, closing at 26,320.6, up 325.75 points or 1.3%. Key contributors included Eicher Motors, Mahindra & Mahindra, Ashok Leyland, and Exide Industries, which rose up to 2.4%. The Nifty Capital Market Index also performed well, ending at 4,271.35, up 43.8 points or 1%. Notable gainers included BSE Ltd, which surged 4.5%, followed by KFin Technologies Ltd with a 2.8% rise, and CAMS Ltd, up 1.8%. The Nifty Transportation & Logistics Index also featured among the top gainers, climbing 236.35 points or 0.9%, to close at 25,248.7.
On the losing side, the Nifty IT Index declined the most, ending at 34,635.85, down 507.25 points or 1.44%. Persistent Systems Ltd led the losses with a 3.1% drop, while Mphasis Ltd, Coforge Ltd, and HCL Technologies Ltd also fell by up to 2.2%. The Nifty FMCG Index also closed lower at 56,292.10, down 811.95 points or 1.42%. Major losers included Varun Beverages Ltd, ITC Ltd, Radico Khaitan Ltd, and Emami Ltd, with declines of up to 4.1%.
Asian markets ended Friday on a broadly positive note. Hong Kong’s Hang Seng Index climbed 369.49 points or 1.45%, to close at 25,428.00. The Shanghai Composite gained 46.63 points or 1.22%, to settle at 3,812.51, while South Korea’s KOSPI edged up 4.29 points or to close at 3,205.12. Japan’s Nikkei 225 Index also advanced, rising 403.73 points or 0.94%, to finish at 42,984.00. As of 4:54 p.m. IST, US Dow Jones Futures were slightly down by 14.74 points or 0.03%, trading at 45,604.55.
For the week, the Nifty gained 1.29%, or 314.15 points, closing above the 24,700 mark. The broader Indian market saw a revival, supported by the country’s five-quarter high GDP growth of 7.8% in Q1 FY26, which exceeded the RBI’s projection of 6.5%. Sentiment was further boosted by optimism over the upcoming GST reforms, set to be implemented on September 22, 2025.
Trade Setup Summary
The Nifty 50 opened on a positive note at 24,818.85 on Friday and ended the day in the green above the 24,700 level at 24,741.00. A break below 24,623 could trigger further selling towards 24,406, while breaking the next resistance level of 24,838 could trigger bullishness towards the 25,020 level.
Bank Nifty started the session on a positive note at 54,308.05 and ended the session in the green at 54,114.55, above the 54,100 level. A break below 53,728 could trigger further selling towards 53,379, while breaking the next resistance level of 54,280 could trigger bullishness towards the 54,720 level.
Sensex opened on a positive note at 81,012.42 on Friday and ended in the red at 80,710.76, above the 80,700 level. A break below 80,696 could trigger further selling towards 80,176, while breaking the next resistance level of 81,049 could lead towards the 81,452 level.
Given the ongoing volatility and mixed sentiments, it’s advisable to avoid aggressive positions and wait for clear directional moves above resistance or below support. Traders should consider these key support and resistance levels when entering long or short positions following the price break from these critical levels. Additionally, traders can combine moving averages to identify more accurate entry and exit points.
Disclaimer

The views and investment tips expressed by investment experts/broking houses/rating agencies on tradebrains.in are their own, and not that of the website or its management. Investing in equities poses a risk of financial losses. Investors must therefore exercise due caution while investing or trading in stocks. Trade Brains Technologies Private Limited or the author are not liable for any losses caused as a result of the decision based on this article. Please consult your investment advisor before investing.
About: Trade Brains Portal is a stock analysis platform. Its trade name is Dailyraven Technologies Private Limited, and its SEBI-registered research analyst registration number is INH000015729.
Investments in securities are subject to market risks. Read all the related documents carefully before investing.
Registration granted by SEBI and certification from NISM in no way guarantee performance of the intermediary or provide any assurance of returns to investors.

