On Wednesday, the Indian equity markets witnessed a mild pullback after a four-day rally, with both the Nifty 50 and Sensex closing lower amid cautious investor sentiment. The broader trend reflected consolidation, as traders appeared to book profits ahead of key global events. Despite the dip, the benchmark indices held above crucial technical support levels, suggesting underlying strength. However, global uncertainties, especially surrounding the extended US government shutdown, weighed on the mood, prompting a risk-off approach among market participants.
Sectorally, the market was on a mixed note. IT and consumer durables led the gains, driven by strong buying interest in heavyweight stocks and optimism around earnings resilience in export-driven sectors. On the other hand, realty, media, and auto stocks saw notable declines, hinting at selective profit booking and concerns over demand outlook in domestic-focused sectors. The overall tone remained cautious yet constructive, with momentum indicators signalling stability rather than weakness, suggesting that the current pullback may be temporary unless global cues worsen.
In this overview, we will analyse the key technical levels and trend directions for Nifty and BSE Sensex to monitor in the upcoming trading sessions. All the charts mentioned below are based on the 5-minute timeframe.
Nifty 50

(In this analysis, we have used 20/50/100/200 EMAs, where 20 EMA (Red), 50 EMA (Orange), 100 EMA (Light Blue), and 200 EMA (Dark Blue)).
To view other technical reports, click here
The Nifty 50 Index opened on a negative note at 25,079.75 on Wednesday, down by 28.55 points from Tuesday’s closing of 25,108.30. With a bearish start to the day, the index had a volatile morning session, trading in the 25,000 to 25,200 range. Additionally, the Index stood below the EMAs of 20/50 but above the 100/200-period EMAs in the 15-minute time frame during the morning session.
Further, the index surged as high as the 25,150 mark in the afternoon session and was later dragged down to the 25,000 level and was traded in the range of 25,000 and 25,150. During the afternoon session, the Nifty 50 traded below the EMAs of 20/50/100 but above the 200-period EMA in the 15-minute time frame. Nifty’s immediate resistance levels are R1 (25,083), R2 (25,147), and R3 (25,222), while immediate support levels are S1 (25,010), S2 (24,941), and S3 (24,878).
The Nifty index had reached a day’s high at 25,192.50 and saw a day’s low at 25,008.50. Finally, it had closed at 25,046.15, in red below the 25,050 level, losing 62.15 points, or 0.25%. The Nifty 50 closed above all four EMAs of 20/50/100/200 in the daily time frame.
Momentum Indicators
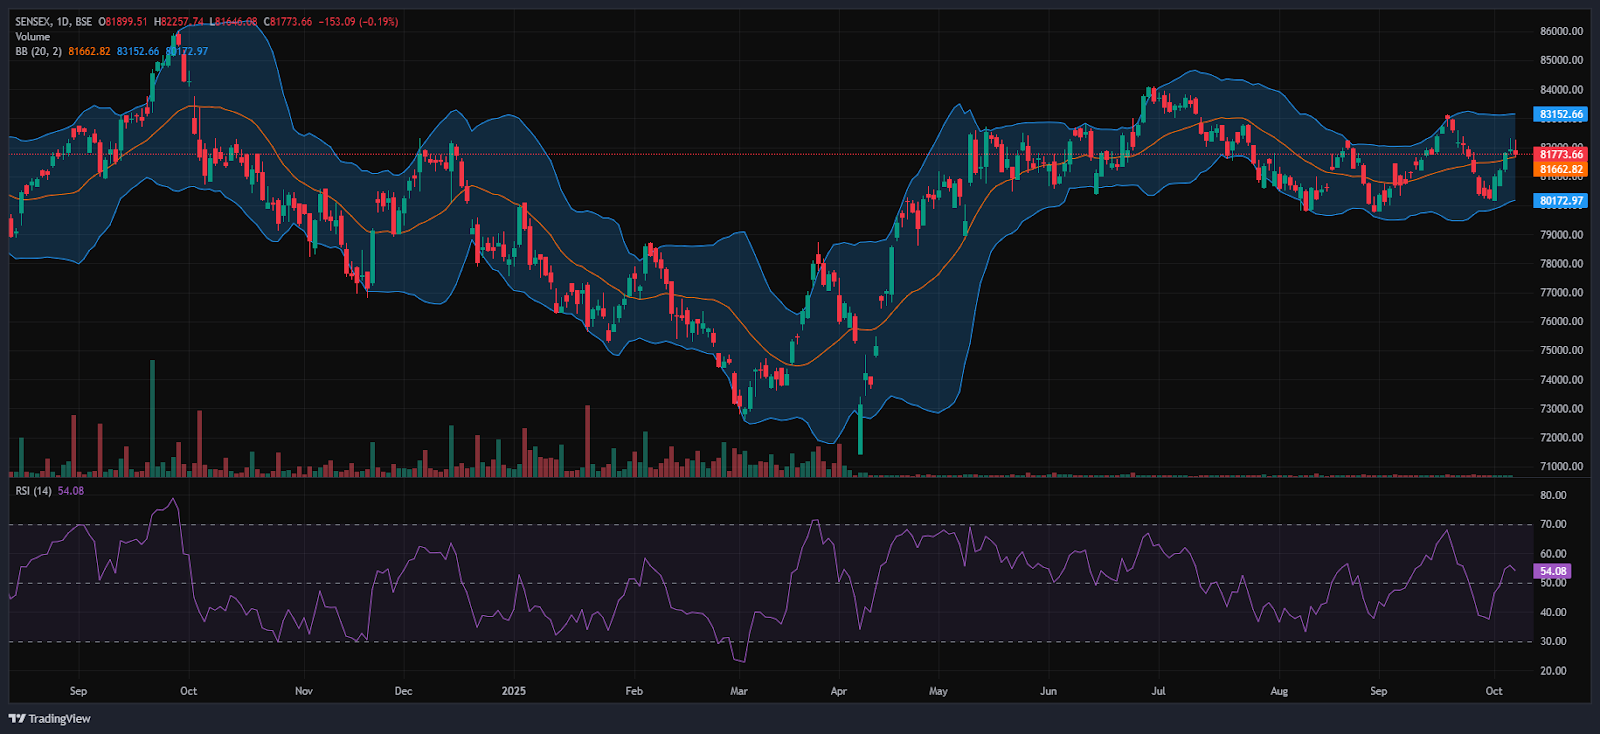
RSI (Daily): The Nifty 50’s RSI stood at 53.75, which is well below the overbought zone of 70, indicating a bullish sentiment.
Bollinger Bands (Daily): The index is trading in the upper band of its Bollinger Band range above the middle band (Simple Moving Average). Its position in the upper range indicates a bullish sentiment but near to the middle band, it can be seen as neutral and the middle band as Strong support at the 25,033 level on Wednesday. The Nifty Index formed a shooting star Candle pattern in the uptrend, signalling a potential bearish reversal. A sustained move above the middle band signals a bullish sentiment, while a drop back toward the lower band may reinforce bearish sentiment.
Volume Analysis: Wednesday’s trading session had average volumes, which stood at 225.97 Mn.
Derivatives Data: Options OI indicates strong Put writing at 25,000, following 24,900, establishing it as a firm support zone. On the upside, a significant Call OI buildup at 25,100 and 25,200 suggests a potential resistance supply. PCR (Put/Call Ratio) stands at 0.6303 (<1), leaning towards bullish sentiment and the Short Covering signals a short-term bullish signal, with an overall Bullish outlook for the next trading session.
Bank Nifty
(In this analysis, we have used 20/50/100/200 EMAs, where 20 EMA (Red), 50 EMA (Orange), 100 EMA (Light Blue), and 200 EMA (Dark Blue)).
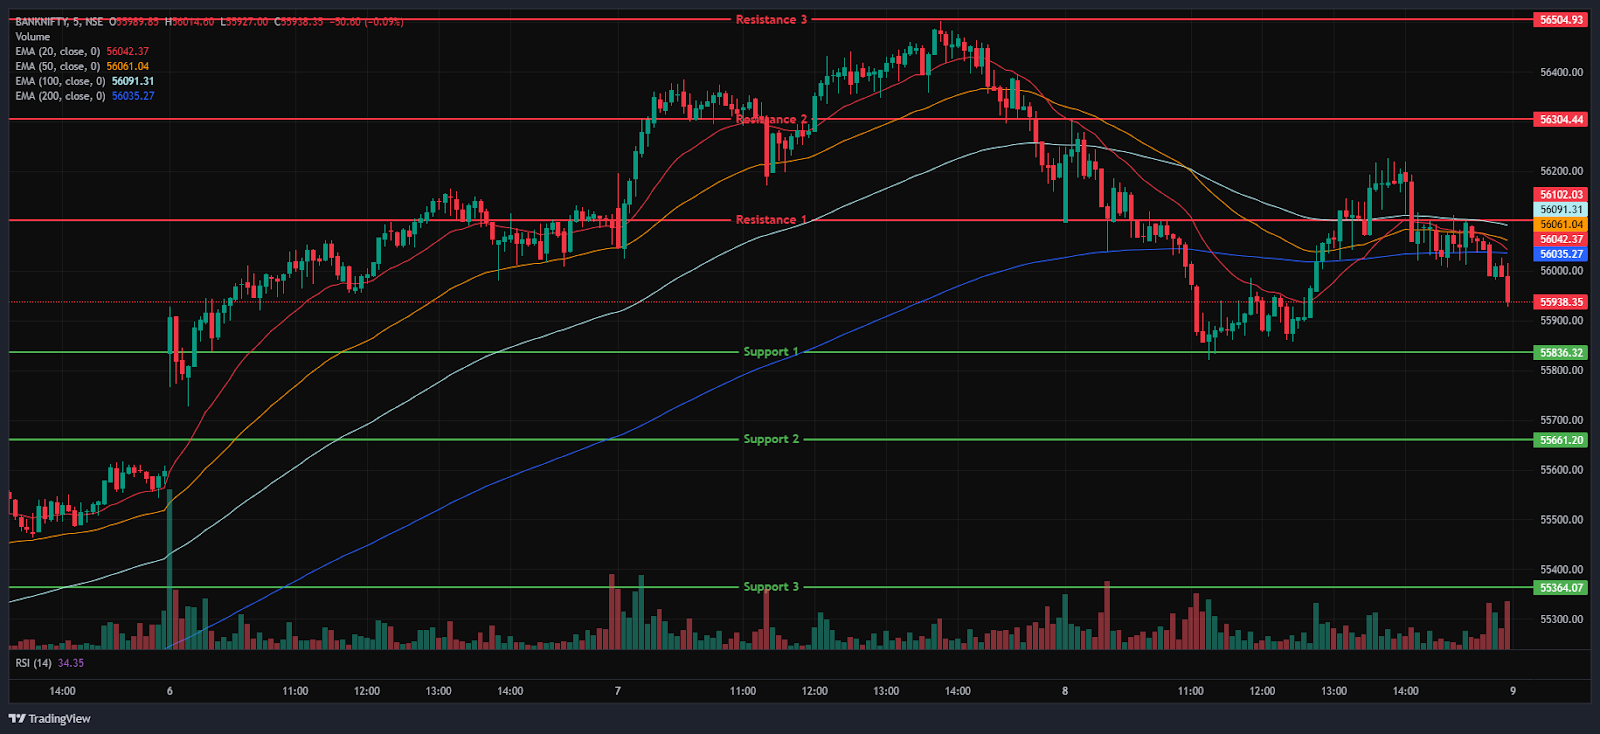
The Bank Nifty Index also started the session on a negative note at 56,098.50 on Wednesday, down by 140.85 points from Tuesday’s closing of 56,239.35. The index was trading between the range of 55,800 and 56,300 in the morning session, indicating high volatility. In addition, the index was trading below the EMAs of 20/50 but above the EMAs of 100/200 in the 15-minute time frame. In the afternoon session, the Index recovered and surged as high as at 56,226, but later did not sustain and lost its momentum and dragged down to the 55,900 mark, below its opening level.
The Index was traded around the range of 55,950 and 56,250, ending in red. During the afternoon session, Bank Nifty closed below the EMAs of 20/50 but above the 100/200-period EMAs in the 15-minute time frame. Bank Nifty immediate resistance levels are R1 (56,102), R2 (56,304), and R3 (56,505), while immediate support levels are S1 (55,836), S2 (55,661), and S3 (55,364).
The Bank Nifty index had peaked at 56,303.60 and made a day’s low at 55,821.00. Finally, it had closed in red at 56,018.25, closing below the 56,100 level, losing 221.10 points or 0.39%. The Relative Strength Index (RSI) stood at 60.96 well below the overbought zone of 70 in the daily time frame, and Bank Nifty closed above all four EMAs of 20/50/100/200 in the daily time frame.
Sensex
(In this analysis, we have used 20/50/100/200 EMAs, where 20 EMA (Red), 50 EMA (Orange), 100 EMA (Light Blue), and 200 EMA (Dark Blue)).
To view other technical reports, click here
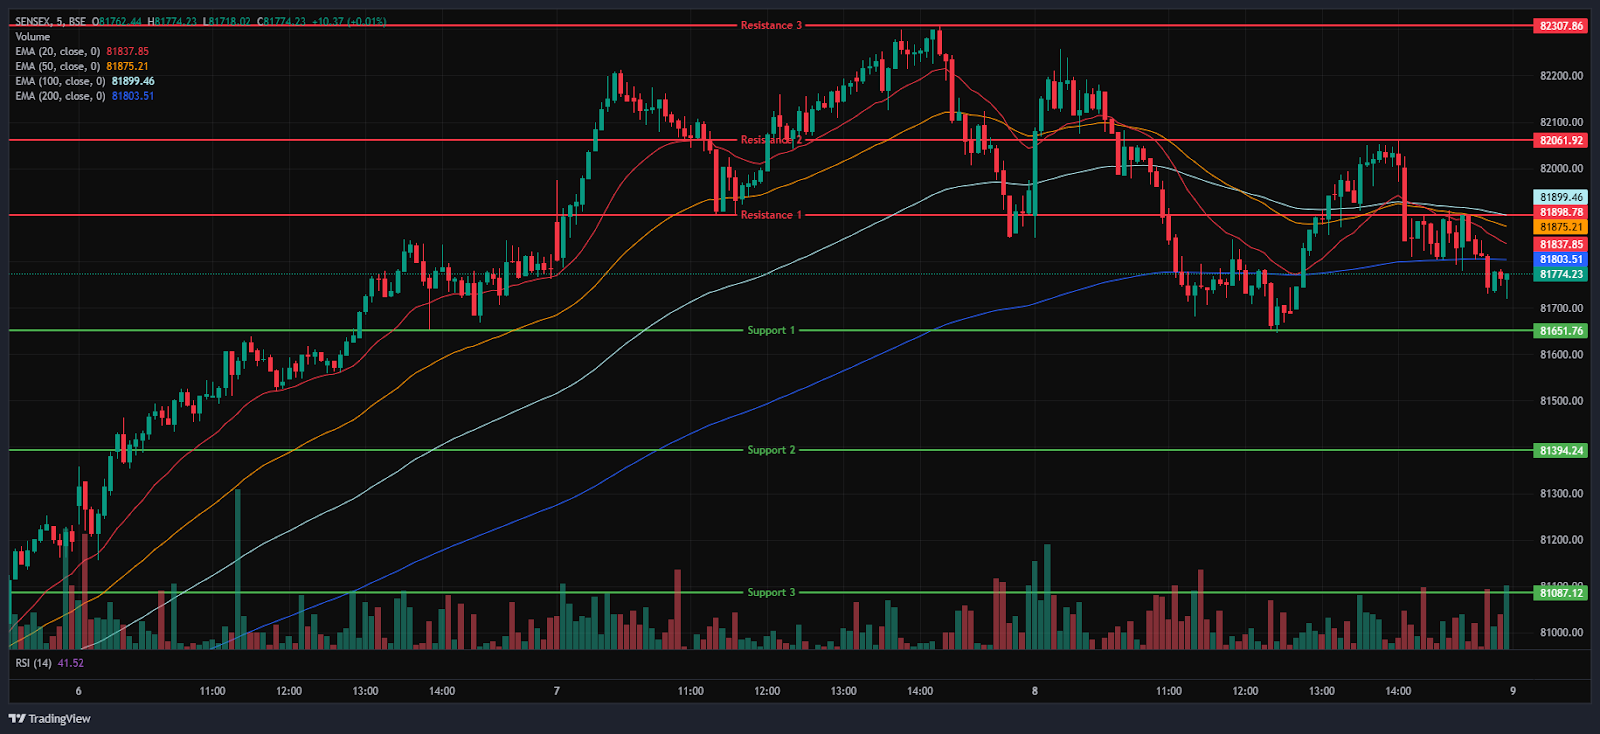
The BSE Sensex Index also opened on a negative note at 81,899.51 on Wednesday, down by 27.24 points from Tuesday’s closing of 81,926.75. The index started its session on a bearish note and was trading in the 81,600 to 82,300 range throughout the morning session’s 15-minute time frame, below the EMAs of the 20/50 but above the EMAs of 100/200. In the afternoon session, the Index further recovered and surged as high as the 82,100 level but later the Index did not sustain the level and dragged down to the 81,750 level below its opening level.
The Index was traded between 81,700 and 82,100, maintaining its overall bearish trend and closing below the EMAs of 20/50 but above the 100/200-period EMA in the 15-minute time frame. BSE Sensex immediate resistance levels are R1 (81,899), R2 (82,062), and R3 (82,308), while immediate support levels are S1 (81,652), S2 (81,394), and S3 (81,087).
The BSE Sensex index had peaked at 82,257.74 and made a day’s low at 81,646.08. Finally, it had closed at 81,773.66 in red, losing 153.09 points or 0.19%. The Relative Strength Index (RSI) stood at 54.08 (below the overbought zone of 70) in the daily time frame, and the BSE Sensex closed above all four EMAs of 20/50/100/200 in the daily time frame.
India VIX
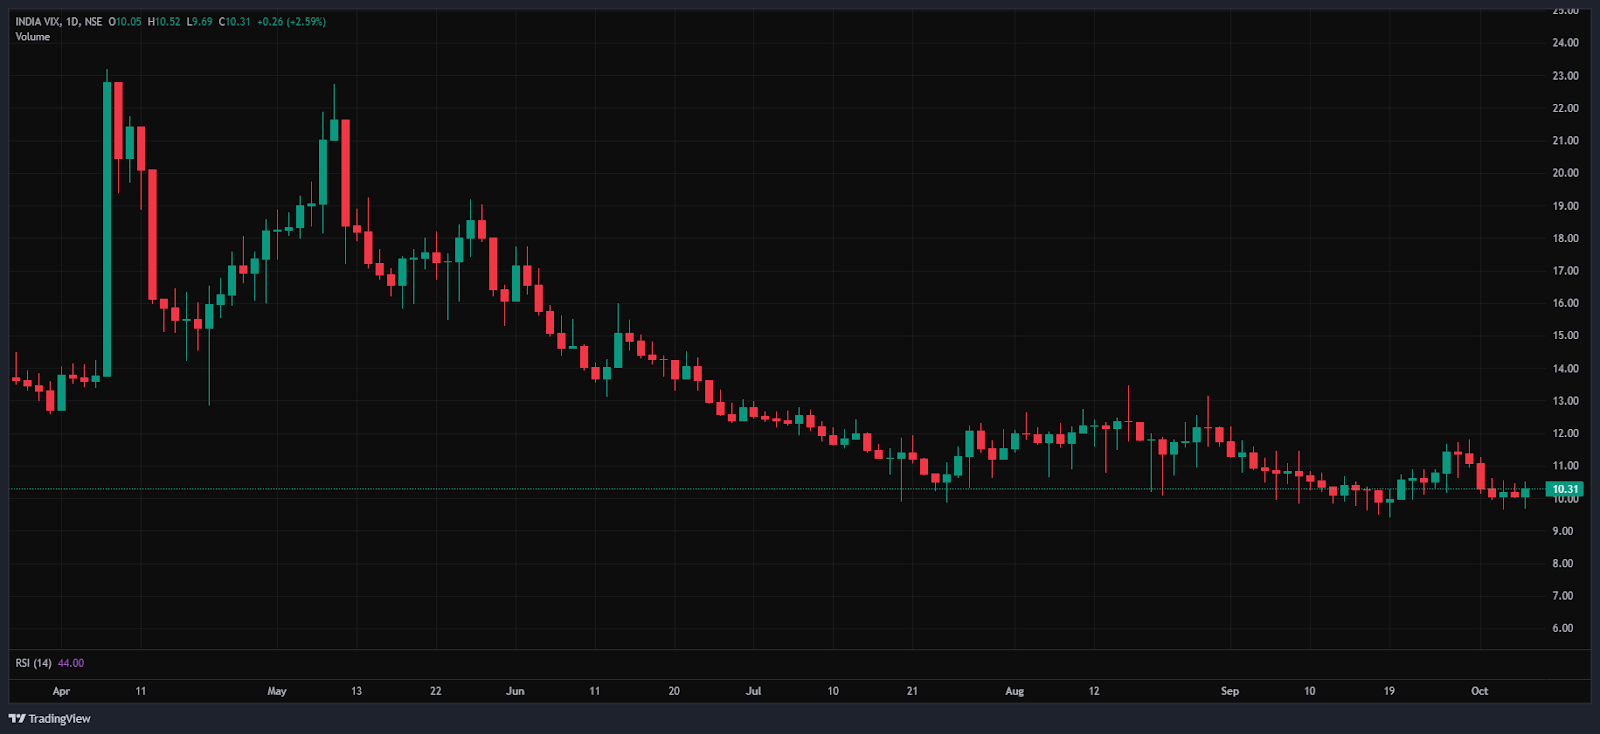
The India VIX increased by 0.26 points or 2.61%, from 10.05 to 10.31 during Wednesday’s session. An increase in the India VIX typically indicates higher price volatility in the stock market, suggesting a less stable market environment. However, a stable market environment and minimal volatility are anticipated when the India vix is below 15.
Market Recap on the 8th of October 2025
On Wednesday, the Nifty 50 opened on a slightly negative note at 25,079.75, down -28.55 points from its previous close of 25,108.30. It touched an intraday low of 25,008.5 before closing near the 25,000-mark at 25,046.15, down by -62.15 points, or -0.25%. Technically, the index remained above all the 20/50/100 & 200-day EMAs on the daily chart. The BSE Sensex also reflected a similar trend, opening at 81,899.51, down -27.24 points from its previous close of 81,926.75. It traded in a similar pattern to the Nifty 50 and settled below the 81,800 level at 81,773.66, losing -153.09 points, or -0.19%.
Momentum indicators showed moderate strength, with the RSI for Nifty 50 at 53.75 and for Sensex at 54.08, both well below the overbought level of 70. Also, the Bank Nifty Index closed in negative territory, losing -221.1 points, or -0.39%, to end at 56,018.25. The broad indices declined after rallying for four consecutive sessions on Wednesday, driven by global market uncertainty with heightened caution as the US Government shutdown extends into its second week.
The Nifty IT Index topped among the sectoral gainers, closing at 35,232.25, up 522.8 points or 1.5%. Major IT stocks, including Infosys Ltd, TCS Ltd, Coforge Ltd and LTIMindtree Ltd, gained up to 2.5%. The Nifty Consumer Durables Index followed next, with 270.75 points or a 0.7% gain, to close at 32,236.20.
The shares of Titan Company Ltd gained the highest, with a 4.3% increase, followed by Cera Sanitaryware Ltd and Century Plyboards Ltd, which rose by up to 1.5%. The Nifty India Digital Index also gained on Wednesday, closing at 9,122.55, up 42.7 points or 0.5%.
The Nifty Realty index was the major loser, declining by -16.3 points or -1.8%, closing at 875.4. Anant Raj Ltd, Oberoi Realty Ltd, and Signature Global Ltd all fell by up to -4.9%. The Nifty Media Index followed the decline, closing at 1,555.95, down -27.15 points, or -1.7%. Prime Focus Ltd dropped -3.4%, while other media stocks like Zee Entertainment Ltd, Nazara Technologies Ltd and DB Corp Ltd slipped by up to -2.9%. The Nifty Auto index also fell -411.15 points or -1.5%, closing at 26,522.4.
Asian markets showed mixed sentiment on Wednesday. Hong Kong’s Hang Seng Index lost -128.31 points, or -0.48%, to close at 26,829.46. Japan’s Nikkei 225 Index declined by -215.89 points, or -0.45%, ending at 47,734.99, and Singapore’s Straits Times Index decreased by -15.96 points, or -0.36%, ending at 4,456.3.
Markets in China and South Korea remained closed for the day. As of 4:54 p.m. IST, US Dow Jones Futures were trading at 46,959, up 108 points, or 0.23%, ahead of Federal Open Market Committee (FOMC) minutes for the September meeting.
Trade Setup Summary
The Nifty 50 opened on a negative note at 25,079.75 on Wednesday and ended the session in the red below the 25,050 level at 25,046.15. A break below 25,010 could trigger further selling towards 24,941 while breaking the next resistance level of 25,083 could trigger bullishness towards the 25,147 level.
Bank Nifty started the session on a negative note at 56,098.50 and ended the session in the red at 56,018.25, below the 56,100 level. A break below 55,836 could trigger further selling towards 55,661, while breaking the next resistance level of 56,102 could trigger bullishness towards the 56,304 level.
Sensex also opened on a negative note at 81,899.51 and ended the session in the red at 81,773.66, below the 81,800 level. A break below 81,652 could trigger further selling towards 81,394, while breaking the next resistance level of 81,899 could lead towards the 82,062 level.
Given the ongoing volatility and mixed sentiments, it’s advisable to avoid aggressive positions and wait for clear directional moves above resistance or below support. Traders should consider these key support and resistance levels when entering long or short positions following the price break from these critical levels. Additionally, traders can combine moving averages to identify more accurate entry and exit points.
Disclaimer

The views and investment tips expressed by investment experts/broking houses/rating agencies on tradebrains.in are their own, and not that of the website or its management. Investing in equities poses a risk of financial losses. Investors must therefore exercise due caution while investing or trading in stocks. Trade Brains Technologies Private Limited or the author are not liable for any losses caused as a result of the decision based on this article. Please consult your investment advisor before investing.
About: Trade Brains Portal is a stock analysis platform. Its trade name is Dailyraven Technologies Private Limited, and its SEBI-registered research analyst registration number is INH000015729.
Investments in securities are subject to market risks. Read all the related documents carefully before investing.
Registration granted by SEBI and certification from NISM in no way guarantee performance of the intermediary or provide any assurance of returns to investors.
