
![]()
![]()
Indian equity benchmarks began the week on a positive note, reflecting cautious optimism in the market. Both the Nifty 50 and the BSE Sensex managed to close higher on Monday, although gains were modest. The Nifty 50 remained comfortably above its key moving averages, except the 50-day EMA, suggesting underlying strength despite some resistance. Broader market sentiment was stable, supported by balanced momentum indicators, as reflected in the RSI levels, which stayed below the overbought zone. Banking stocks also participated in the uptrend, with the Bank Nifty closing marginally in the green.

Sectorally, the auto space led the rally, driving broader gains, while PSU banks and realty stocks also saw positive traction. On the other hand, the IT and CPSE indices ended in the red, with several heavyweight tech and energy stocks facing selling pressure. Global cues were largely supportive, as major Asian markets ended the day on a strong footing. A positive trend in U.S. futures added to the constructive tone, keeping investor sentiment buoyant heading into the rest of the week.

In this overview, we will analyse the key technical levels and trend directions for Nifty and BSE Sensex to monitor in the upcoming trading sessions. All the charts mentioned below are based on the 5-minute timeframe.
Nifty 50
(In this analysis, we have used 20/50/100/200 EMAs, where 20 EMA (Red), 50 EMA (Orange), 100 EMA (Light Blue), and 200 EMA (Dark Blue)).
To view other technical reports, click here
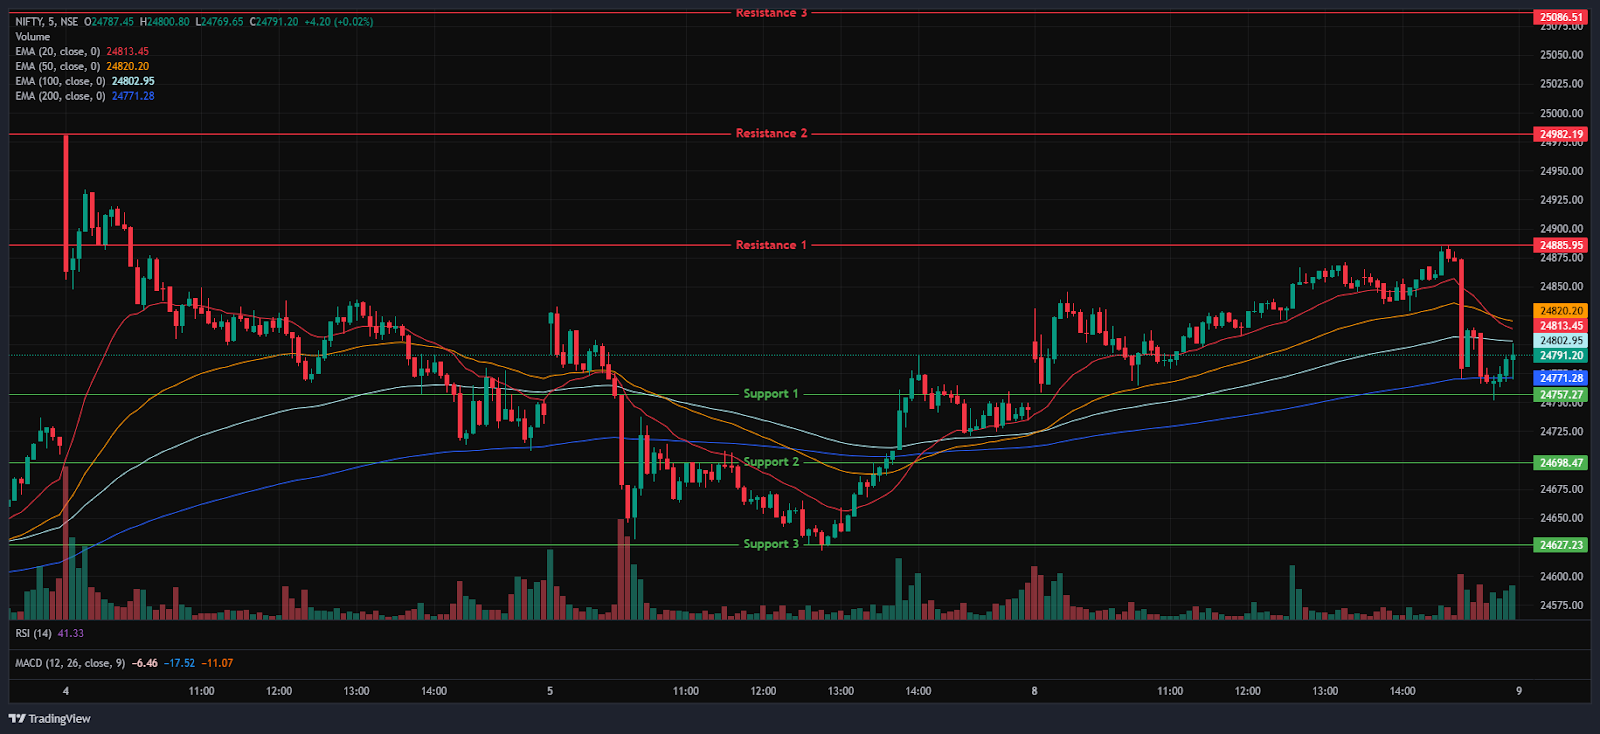
The Nifty 50 Index opened on a positive note at 24,802.60 on Monday, up by 61.6 points from Friday’s closing of 24,741.00. In the morning session, the index started on a gap up; the Nifty Index sustained and surged above the 24,850 mark and traded above its opening level at 24,854. In the morning session, the Index traded in a range between 24,750 and 24,850 and was traded at above all four EMAs of 20/50/100/200 in the 15-minute time frame.
Later, in the afternoon session, the index lost its momentum and pulled down to the 24,750 level from the 24,850 level; the Nifty Index held above the 24,750 level, trading in green. Overall, the index ended in a mixed state on the Monday session. During the afternoon session, the Nifty 50 was traded above the EMAs of 50/100/200 but remained below the 20 EMA in the 15-minute time frame. Nifty’s immediate resistance levels are R1 (24,886), R2 (24,982), and R3 (25,086), while immediate support levels are S1 (24,757), S2 (24,698), and S3 (24,627).
The Nifty index had reached a day’s high at 24,885.50 and saw a day’s low at 24,751.55. Finally, it had closed at 24,773.15, in green above the 24,750 level, gaining 32.15 points, or 0.13%. The Nifty 50 closed above the 20/100/200 EMAs but remained below the 50 EMAs in the daily time frame.
Momentum Indicators

RSI (Daily): The Nifty 50’s RSI stood at 50.39, which is well below the overbought zone of 70, indicating a neutral sentiment.
Bollinger Bands (Daily): The index is still trading in the upper half of its Bollinger Band range near the middle band (Simple Moving Average). Its position in the upper range, along with solid support around the 24,750 level, means the market is still structurally bullish with temporary selling pressure. A sustained move above the middle band could signal a potential bullish shift, while a drop back toward the lower band may reinforce bearish sentiment.
Volume Analysis: Monday’s trading session average volumes stood at 213.23 Mn.
Derivatives Data: Options OI indicates strong Put writing at 24,700, following 24,600, establishing it as a firm support zone. On the upside, a significant Call OI buildup at 24,900 and 25,000 suggests a potential resistance supply. PCR (Put/Call Ratio) stands at 0.8779 (<1), leaning towards bullish sentiment and the long buildup signals a potential upward move.
Bank Nifty
(In this analysis, we have used 20/50/100/200 EMAs, where 20 EMA (Red), 50 EMA (Orange), 100 EMA (Light Blue), and 200 EMA (Dark Blue)).
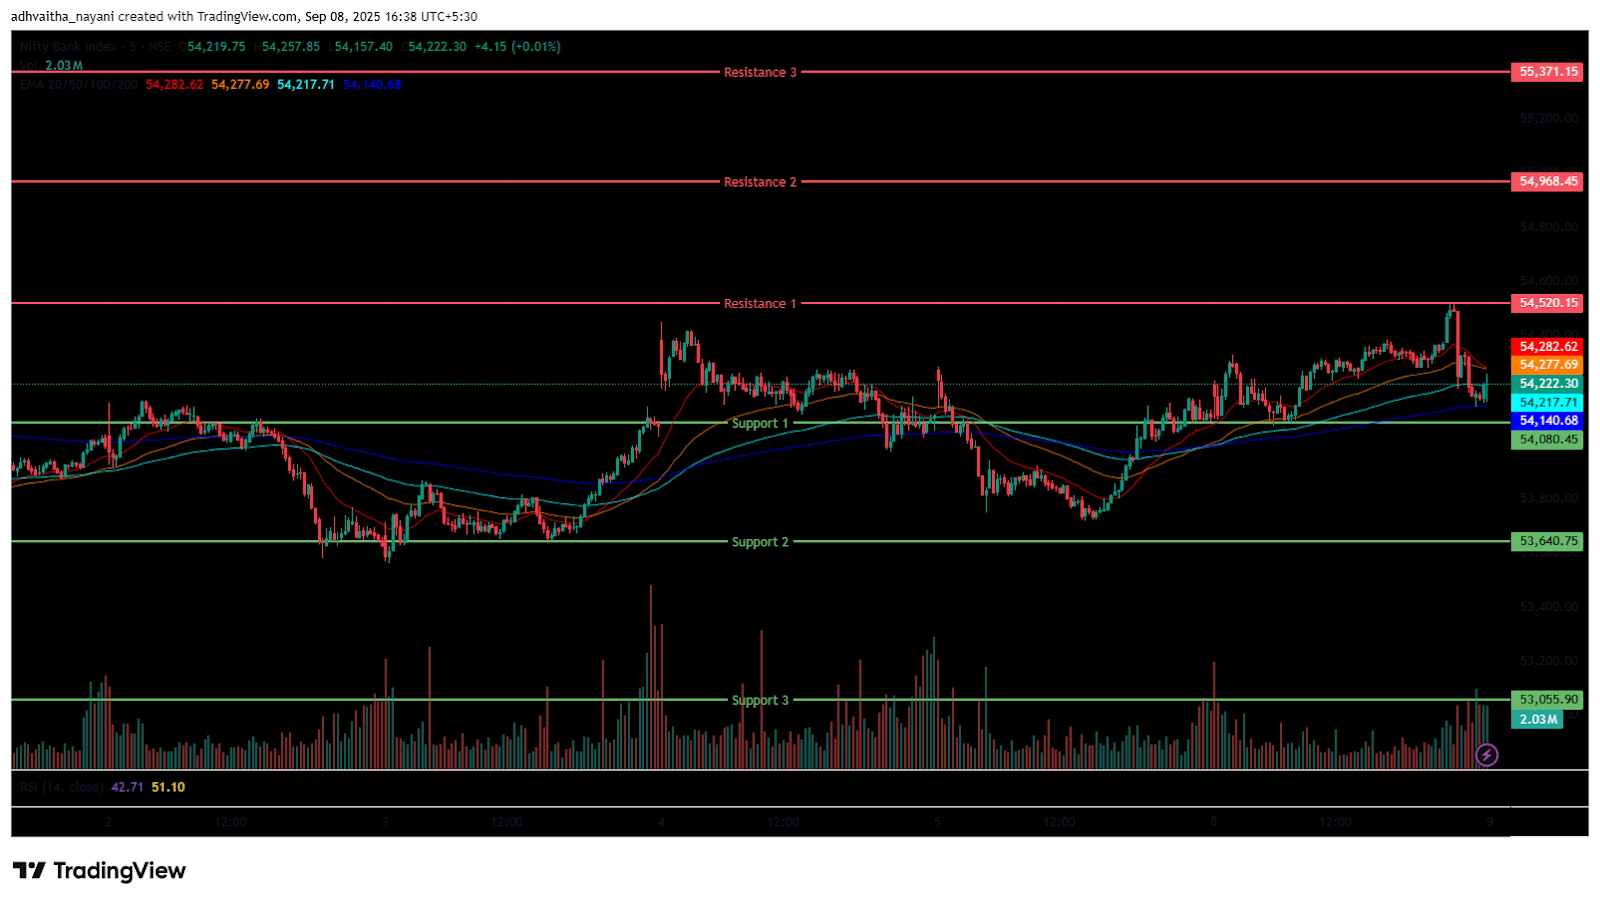
The Bank Nifty Index started the session on a positive note at 54,215.40 on Monday, up by 100.85 points from Friday’s closing of 54,114.55. The index began on a bullish note and surged to the 54,350 mark and traded above its opening level at 54,339 in the morning session. The index was traded above all four EMAs of 20/50/100/200 in the 15-minute time frame and was trading between the 54,000 and 54,350 levels in the morning session.
The Bank Nifty index lost its momentum from its day’s high to the 54,100 mark but held above the 54,150 mark during the afternoon session and traded in the green. During the afternoon session, Bank Nifty closed above the EMAs of 50/100 but remained below the 20/200 EMAs in the 15-minute time frame. Bank Nifty immediate resistance levels are R1 (54,520), R2 (54,968), and R3 (55,371), while immediate support levels are S1 (54,080), S2 (53,641), and S3 (53,056).
The Bank Nifty index had peaked at 54,518.70 and made a day’s low at 54,067.15. Finally, it had closed in green at 54,186.90, breaking above the 54,150 level, gaining 72,35 points or 0.13%. The Relative Strength Index (RSI) stood at 39.16 and was near the oversold zone in the daily time frame, and Bank Nifty closed below the EMAs of 20/50/100 but remained above the 200 EMA in the daily time frame.
Sensex
(In this analysis, we have used 20/50/100/200 EMAs, where 20 EMA (Red), 50 EMA (Orange), 100 EMA (Light Blue), and 200 EMA (Dark Blue)).
To view other technical reports, click here
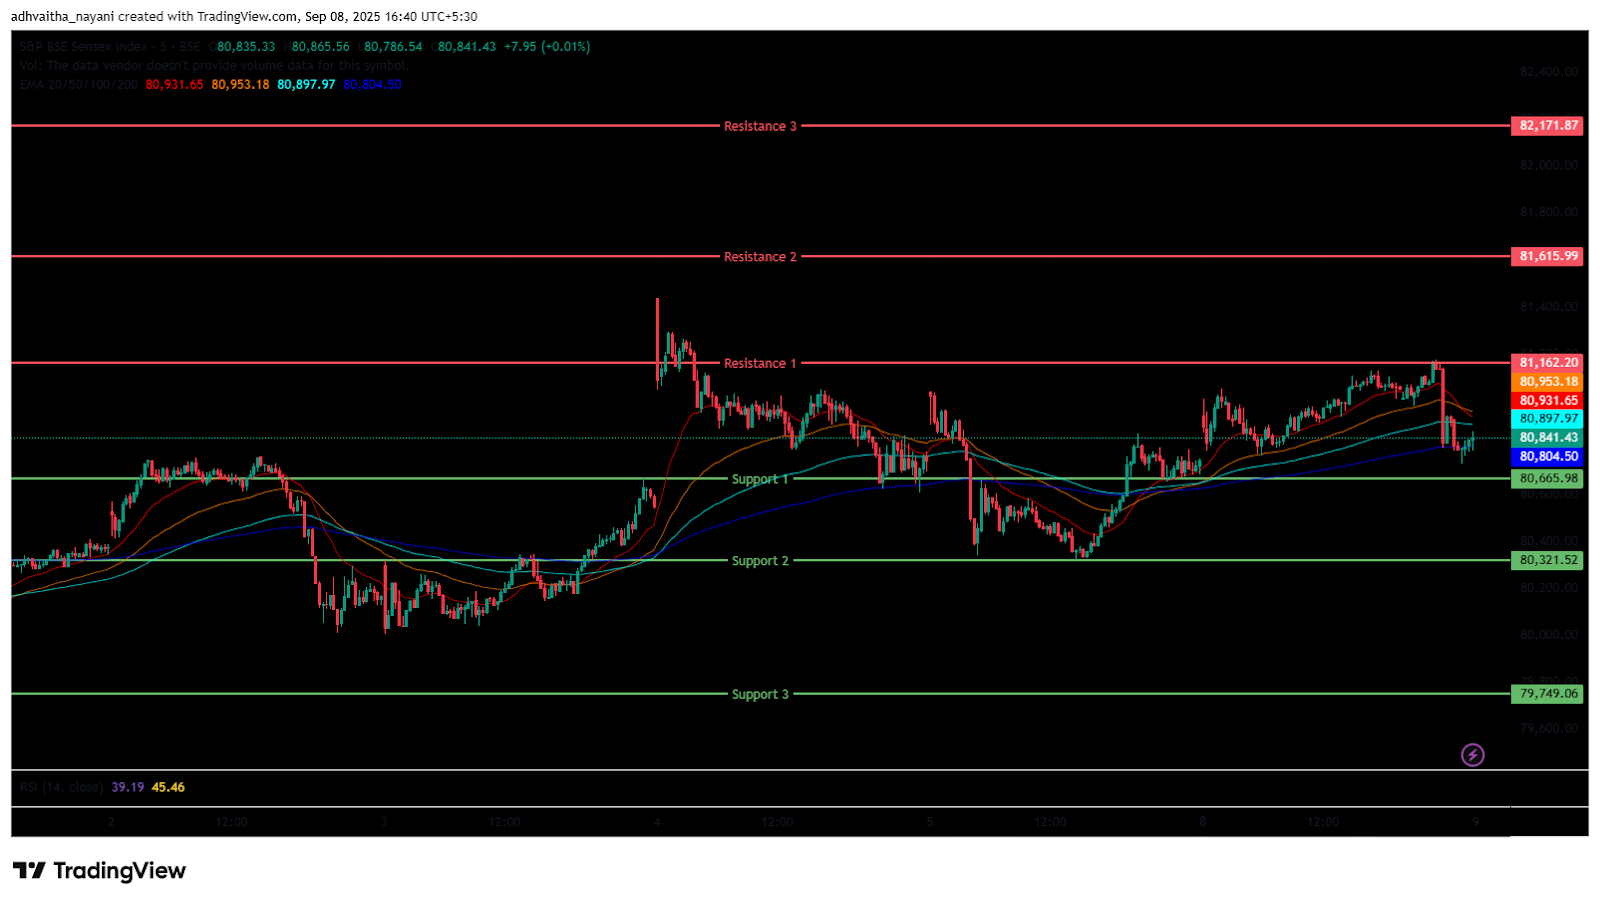
The BSE Sensex Index opened on a positive note at 80,904.40 on Monday, up by 193.64 points from Friday’s closing of 80,710.76. The Index was bullish in the morning session; the Index surged to the 81,100 mark and was trading above its opening level in the morning session at 81,062. The Index was traded above all four EMAs of 20/50/100/200 in the 15-minute time frame and was trading between 80,750 and 81,100 in the morning session.
The Sensex Index further lost its momentum and dropped to 80,733, a day’s low from its high of 81,150. However, the Index managed to stay above 80,750 during the afternoon session, maintaining its overall mixed trend, and was trading above the EMAs of 100/200 but remained below the 20/50 EMAs in the 15-minute time frame. BSE Sensex immediate resistance levels are R1 (81,162), R2 (81,616), and R3 (82,172), while immediate support levels are S1 (80,666), S2 (80,321), and S3 (79,749).
The BSE Sensex index had peaked at 81,171.38 and made a day’s low at 80,733.07. Finally, it had closed at 80,787.30 in green, gaining 76.54 points. The Relative Strength Index (RSI) stood at 48.22 (below the overbought zone of 70 but nearing the oversold zone in the daily time frame), and the BSE Sensex closed below the EMAs of 20/50/100 but remained above the 200 EMA in the daily time frame.
India VIX
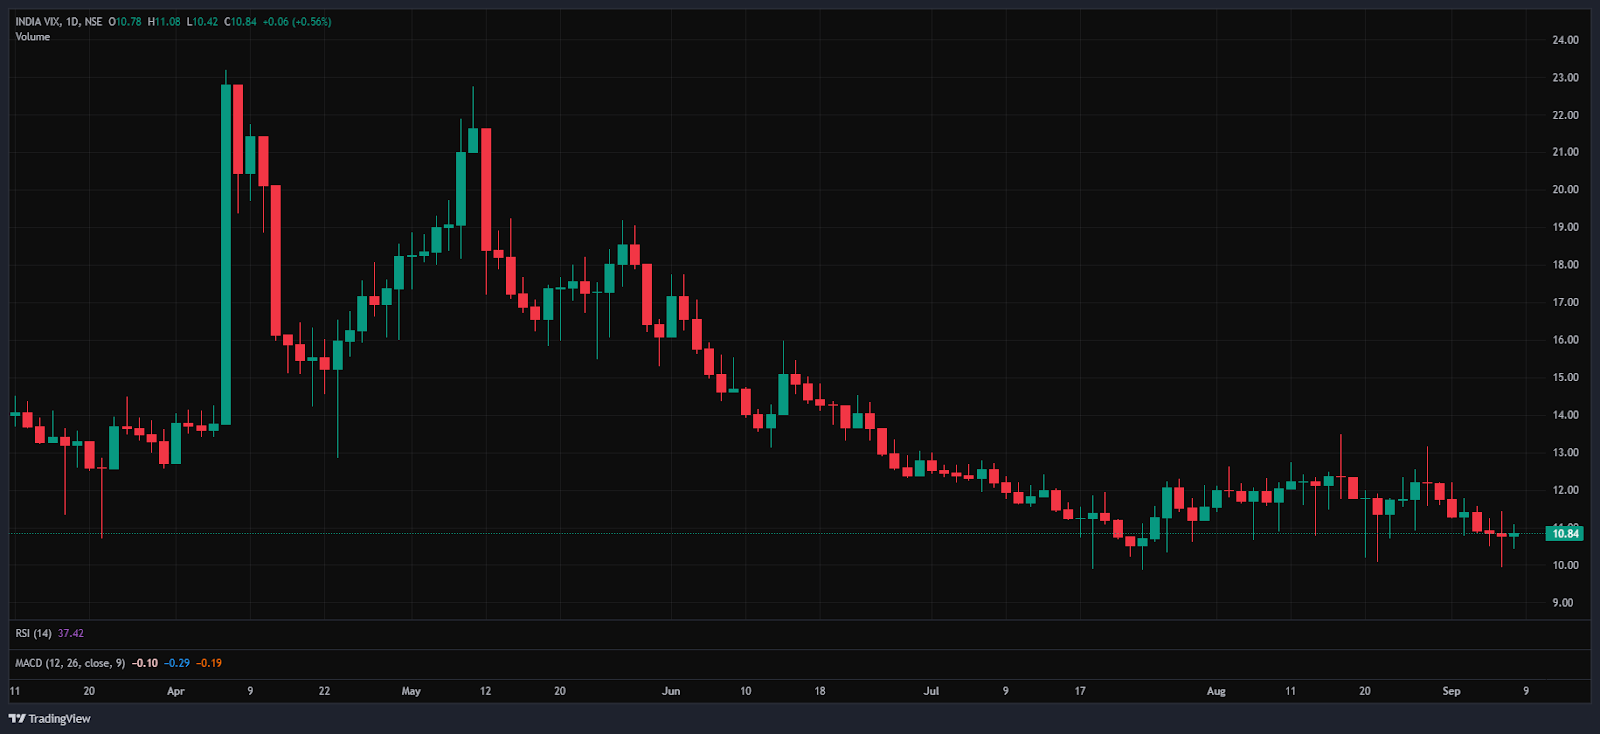
The India VIX increased by 0.057 points or 0.53%, from 10.78 to 10.84 during Monday’s session. An increase in the India VIX typically indicates higher volatility in the stock market, suggesting a more unstable market environment.
Market Recap on the 8th of September 2025
On Monday, the Nifty 50 opened on a positive note at 24,802.60, marking a rise of 61.60 points from its previous close of 24,741.00. It recorded an intraday high of 24,885.50 and ended the session at 24,773.15, gaining 32.15 points, or 0.13%. The index remained just below the 50-day EMA but stayed above the 20-, 100-, and 200-day EMAs on the daily chart.
The BSE Sensex followed a similar path, rising 193.64 points after opening at 80,904.40, and closed at 80,787.30, up 76.54 points or 0.09%. In terms of momentum, the Nifty 50’s Relative Strength Index (RSI) stood at 49.08, while the Sensex’s RSI was at 47.39, both below the overbought level of 70. The Bank Nifty Index also maintained a slightly positive trend, ending in the green with a gain of 72.35 points, or 0.13%, closing at 54,186.90.
Among the key gainers, the Nifty Auto Index led the rally, closing at 27,189.2, up by 868.60 points, or 3.3%. Auto stocks such as Bharat Forge Ltd, Ashok Leyland, Samvardhana Motherson International Ltd, and Tata Motors Ltd saw gains of up to 5.8%. The Nifty PSU Bank Index also saw upward movement, closing at 6,889.20, up by 33.5 points, or 0.49%. Indian Overseas Bank was the top performer in this segment, gaining 1.5%, followed by Central Bank of India, also up 1.5%, and Indian Bank, which rose by 0.9%. The Nifty Realty Index was also among the top gainers, ending the day at 876.55, up 4.05 points, or 0.46%.
On the losing side, the Nifty IT Index recorded the biggest decline during Monday’s session. It closed at 34,310.45, falling by -325.40 points, or -0.94%. Persistent Systems Ltd was the top loser, down -2.4%, while LTIMindtree Ltd, Tech Mahindra Ltd, and HCL Technologies Ltd also fell by up to -2.1%. The Nifty CPSE Index also ended the day in the red at 6,217.05, losing -30.60 points, or -0.49%. Key losers included Coal India Ltd, Oil India Ltd, Power Grid Corporation of India Ltd, and ONGC Ltd, with their shares declining up to -1.4%.
On the global front, Asian markets displayed a broadly bullish trend. Hong Kong’s Hang Seng Index ended the day higher at 25,628, rising 210 points, or 0.82%. The Shanghai Composite Index gained 14.33 points, or 0.37%, to close at 3,826.84. South Korea’s KOSPI Index also closed in the green at 3,219.59, up 14.47 points, or 0.45%. Japan’s Nikkei 225 Index surged 627.25 points, or 1.44%, to finish at 43,646. As of 4:25 p.m. IST, US Dow Jones Futures were trading higher by 77.43 points, or 0.17%, at 45,478.29.
Trade Setup Summary
The Nifty 50 opened on a positive note at 24,802.6 on Monday and ended the day in the green above the 24,700 level at 24,773.15. A break below 24,757 could trigger further selling towards 24,698, while breaking the next resistance level of 24,886 could trigger bullishness towards the 24,982 level.
Bank Nifty started the session on a positive note at 54,215.4 and ended the session in the green at 54,186.9, above the 54,150 level. A break below 54,080 could trigger further selling towards 53,641, while breaking the next resistance level of 54,520 could trigger bullishness towards the 54,968 level.
Sensex also opened on a positive note at 80,904.4 and ended in the green at 80,787.3, above the 80,750 level. A break below 80,666 could trigger further selling towards 80,321, while breaking the next resistance level of 81,162 could lead towards the 81,616 level.
Given the ongoing volatility and mixed sentiments, it’s advisable to avoid aggressive positions and wait for clear directional moves above resistance or below support. Traders should consider these key support and resistance levels when entering long or short positions following the price break from these critical levels. Additionally, traders can combine moving averages to identify more accurate entry and exit points.
Disclaimer

The views and investment tips expressed by investment experts/broking houses/rating agencies on tradebrains.in are their own, and not that of the website or its management. Investing in equities poses a risk of financial losses. Investors must therefore exercise due caution while investing or trading in stocks. Trade Brains Technologies Private Limited or the author are not liable for any losses caused as a result of the decision based on this article. Please consult your investment advisor before investing.
About: Trade Brains Portal is a stock analysis platform. Its trade name is Dailyraven Technologies Private Limited, and its SEBI-registered research analyst registration number is INH000015729.
Investments in securities are subject to market risks. Read all the related documents carefully before investing.
Registration granted by SEBI and certification from NISM in no way guarantee performance of the intermediary or provide any assurance of returns to investors.

